| Param | Original file | Final file |
|---|---|---|
| Filename | modeM0/AS1C09_003T01_9000006442_50131cztM0_level2.fits | modeM0/AS1C09_003T01_9000006442_50131cztM0_level2_quad_clean.evt |
| Size (bytes) | 1,151,239,680 | 58,008,960 |
| Size | 1.1 GB | 55.3 MB |
| Events in quadrant A | 13,718,080 | 238,225 |
| Events in quadrant B | 3,746,473 | 649,035 |
| Events in quadrant C | 13,055,227 | 159,409 |
| Events in quadrant D | 11,617,791 | 275,697 |
| Mode M9 | |||
|---|---|---|---|
| Quadrant | BADHDUFLAG | Total packets | Discarded packets |
| A | 0 | 11 | 0 |
| B | 0 | 11 | 0 |
| C | 0 | 11 | 0 |
| D | 0 | 11 | 0 |
| Mode M0 | |||
|---|---|---|---|
| Quadrant | BADHDUFLAG | Total packets | Discarded packets |
| A | 0 | 44989 | 5 |
| B | 0 | 15372 | 1 |
| C | 0 | 43010 | 1 |
| D | 0 | 38741 | 1 |
| Mode SS | |||
|---|---|---|---|
| Quadrant | BADHDUFLAG | Total packets | Discarded packets |
| A | 0 | 128 | 0 |
| B | 0 | 128 | 0 |
| C | 0 | 128 | 0 |
| D | 0 | 128 | 0 |
| Quadrant | Total seconds | Saturated seconds | Saturation percentage |
|---|---|---|---|
| A | 6204 | 4180 | 67.375887% |
| B | 6205 | 173 | 2.788074% |
| C | 6205 | 4730 | 76.228848% |
| D | 6205 | 3388 | 54.601128% |
Noise dominated data is calculated using 1-second bins in cleaned event files. If a bin has >2000 counts, and if more than 50% of those come from <1% of pixels, then it is considered to be noise-dominated and hence unusable.
| Quadrant | # 1 sec bins | Bins with >0 counts | Bins with >2000 counts | High rate bins dominated by noise | Noise dominated (total time) | Noise dominated (detector-on time) | Marked lightcurve |
|---|---|---|---|---|---|---|---|
| A | 7349 | 6205 | 4166 | 4166 | 56.69% | 67.14% | 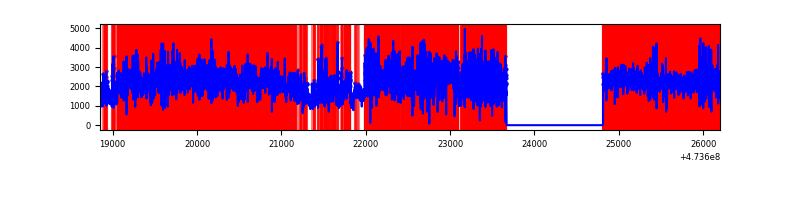 |
| B | 7350 | 6206 | 106 | 106 | 1.44% | 1.71% | 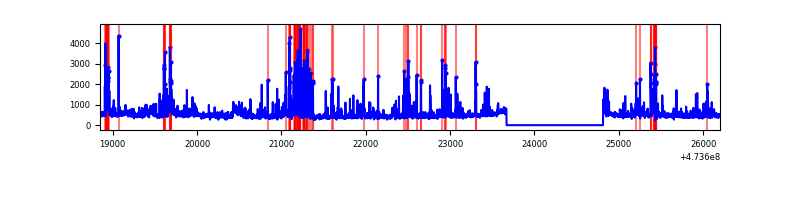 |
| C | 7350 | 6205 | 3611 | 3611 | 49.13% | 58.20% | 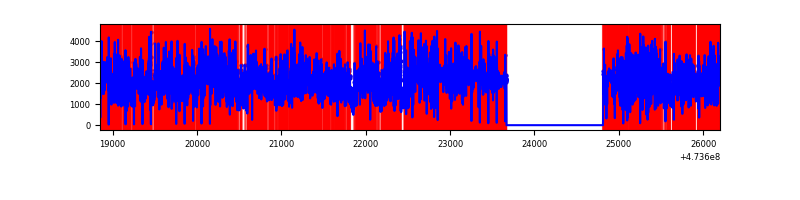 |
| D | 7350 | 6205 | 3059 | 3059 | 41.62% | 49.30% | 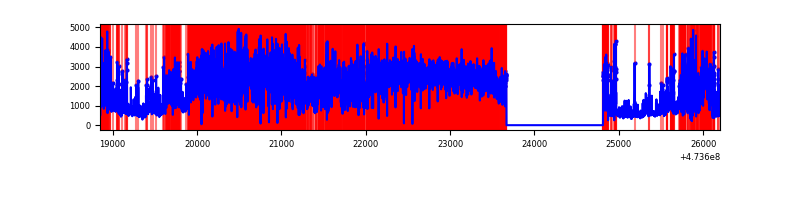 |
Top three noisy pixels from each quadrant. If the there are fewer than three noisy pixels in the level2.evt file, extra rows are filled as -1
| Pixel properties | Quadrant properties | ||||||
|---|---|---|---|---|---|---|---|
| Quadrant | DetID | PixID | Counts | Sigma | Mean | Median | Sigma |
| A | 6 | 250 | 6650267 | 53923.85 | 485 | 473 | 123.3 |
| A | 0 | 98 | 2059561 | 16697.35 | 485 | 473 | 123.3 |
| A | 4 | 207 | 917862 | 7439.2 | 485 | 473 | 123.3 |
| B | 2 | 176 | 237812 | 1740.62 | 642 | 622 | 136.3 |
| B | 4 | 170 | 198875 | 1454.88 | 642 | 622 | 136.3 |
| B | 5 | 185 | 125211 | 914.3 | 642 | 622 | 136.3 |
| C | 4 | 111 | 6999775 | 74085.74 | 326 | 324 | 94.5 |
| C | 15 | 197 | 749023 | 7924.61 | 326 | 324 | 94.5 |
| C | 15 | 147 | 709250 | 7503.63 | 326 | 324 | 94.5 |
| D | 15 | 106 | 1992276 | 14097.19 | 488 | 469 | 141.3 |
| D | 15 | 168 | 1668401 | 11804.93 | 488 | 469 | 141.3 |
| D | 12 | 6 | 1331542 | 9420.79 | 488 | 469 | 141.3 |
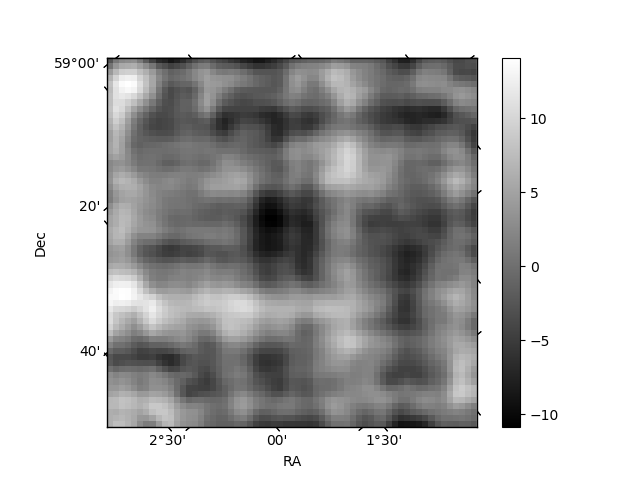
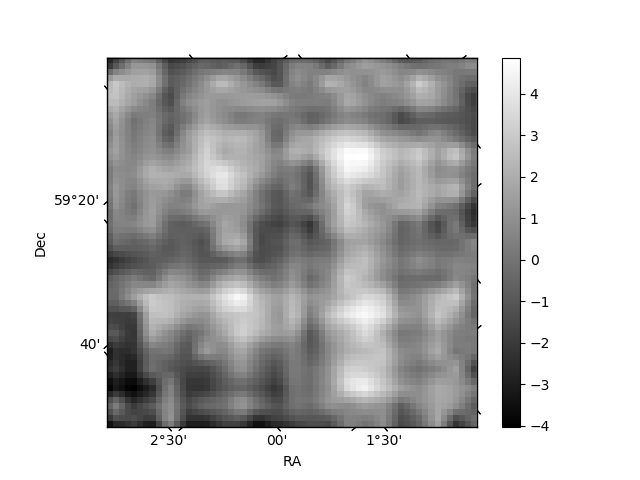
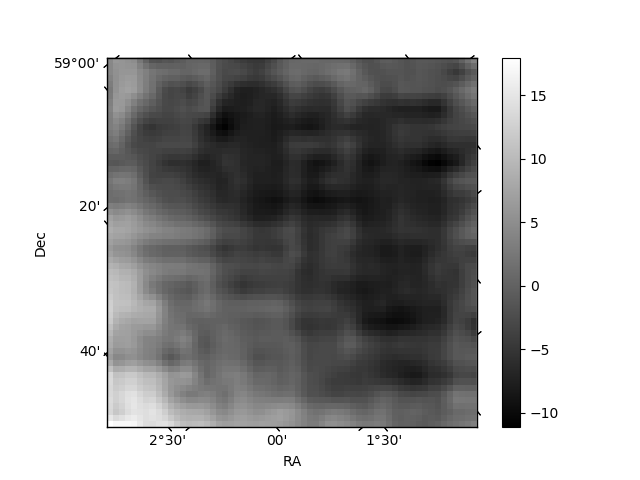
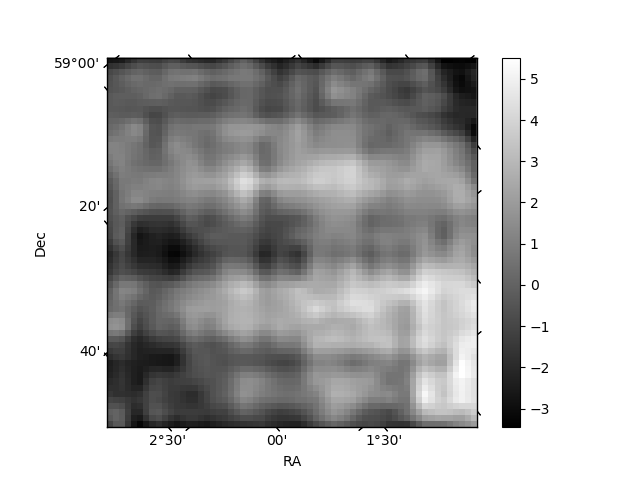
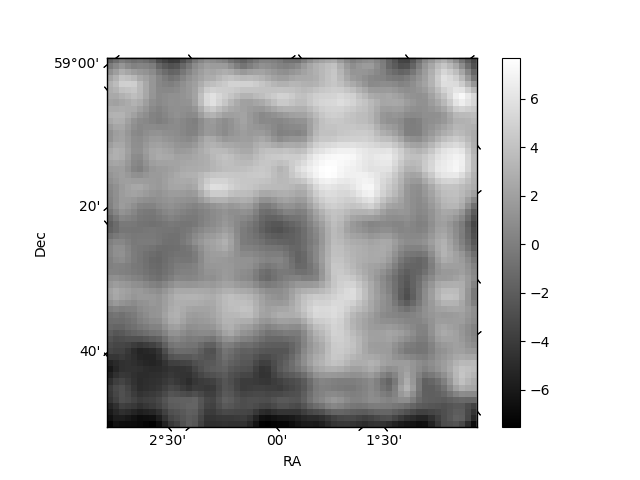
Histogram calculated using DETX and DETY for each event in the final _common_clean file
| Quadrant A | 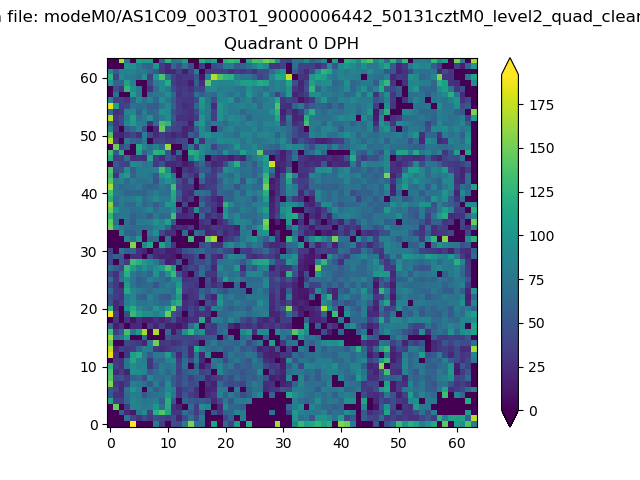 |
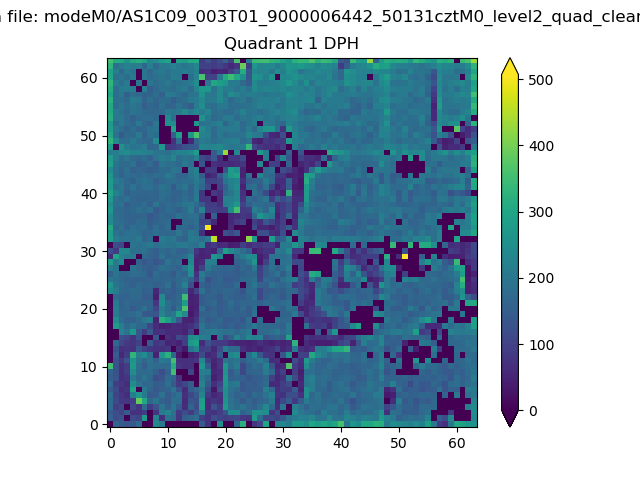 |
Quadrant B |
|---|---|---|---|
| Quadrant D | 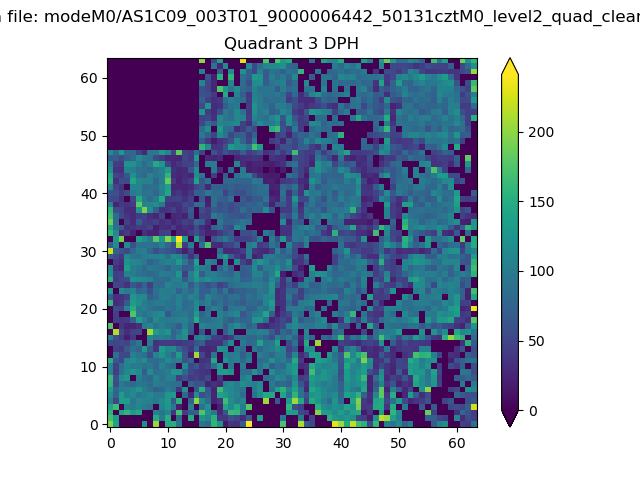 |
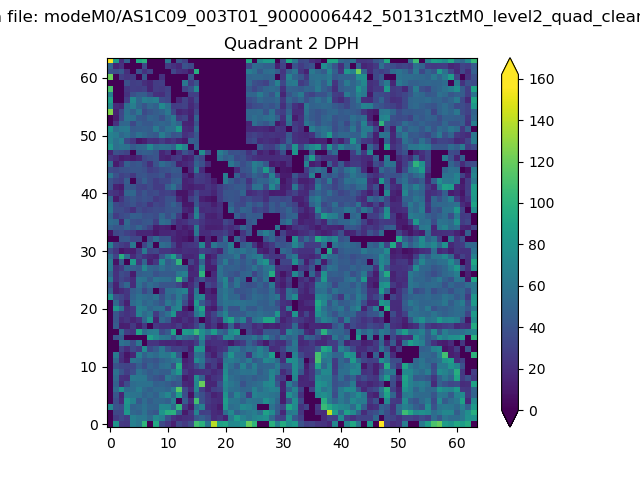 |
Quadrant C |
| Plot type | Count rate plots | Images |
|---|---|---|
| Comparison with Poisson distribution Blue bars denote a histogram of data divided into 1 sec bins. Red curve is a Poisson curve with rate = median count rate of data. |
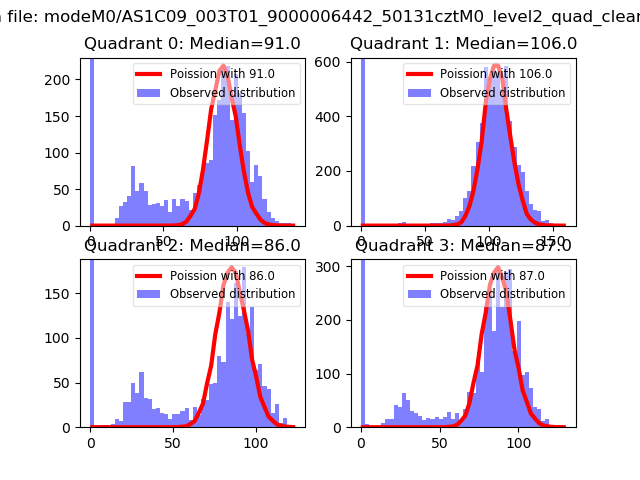 |
 |
| Quadrant-wise count rates Data is divided into 100 sec bins |
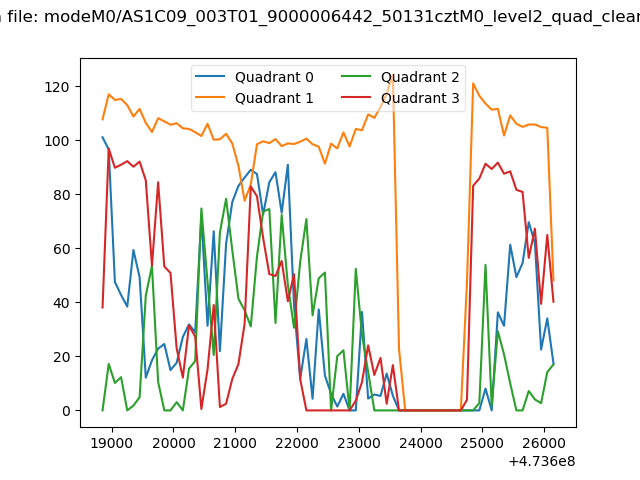 |
|
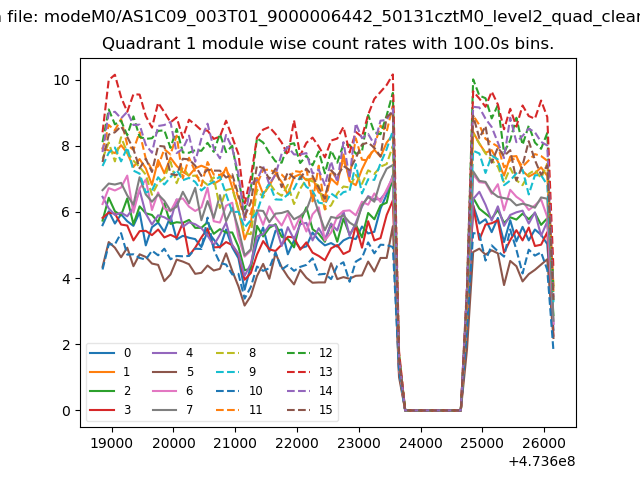
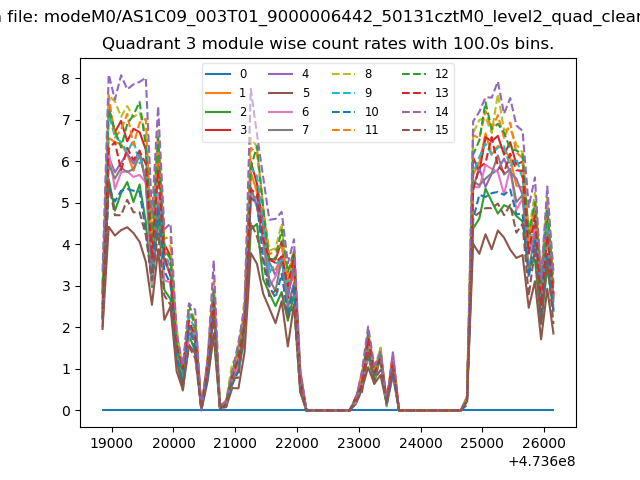
| Module-wise count rates for Quadrant A Data is divided into 100 sec bins |
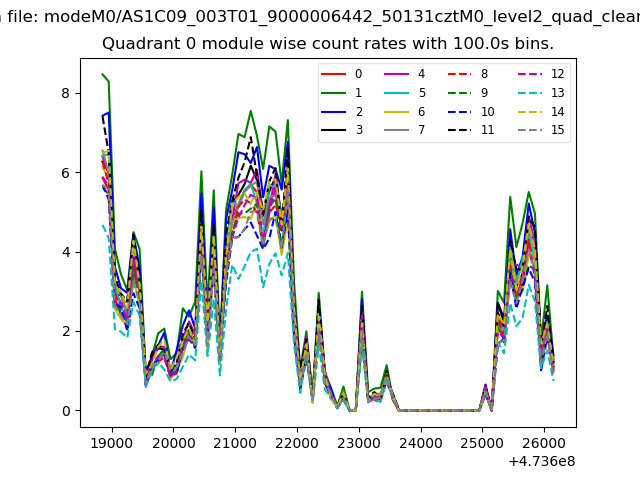 |
 |
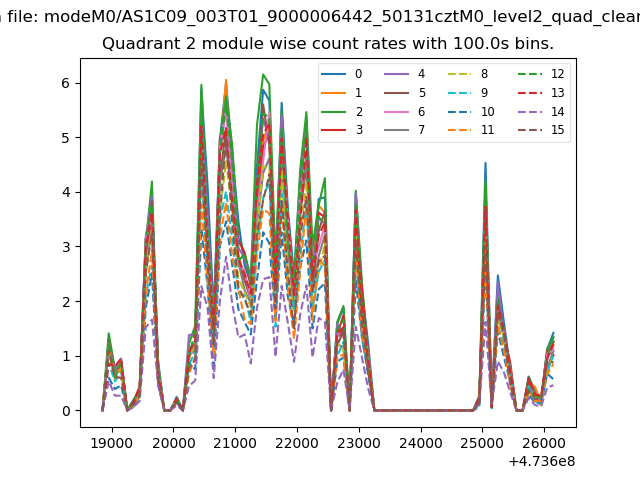
| Module-wise count rates for Quadrant B Data is divided into 100 sec bins |
 |
 |
| Module-wise count rates for Quadrant C Data is divided into 100 sec bins |
 |
 |
| Module-wise count rates for Quadrant D Data is divided into 100 sec bins |
 |
 |
| Parameter | Plot |
|---|---|
| CZT HV Monitor | 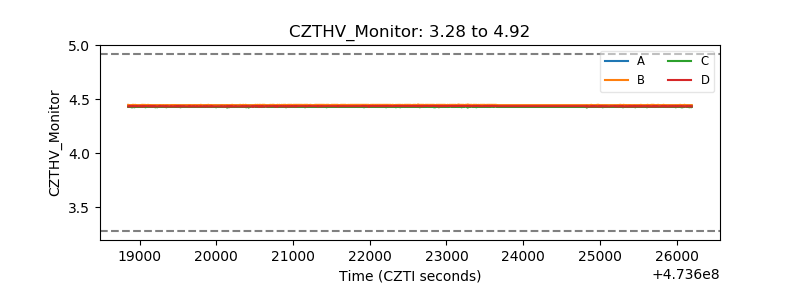 |
| D_VDD | 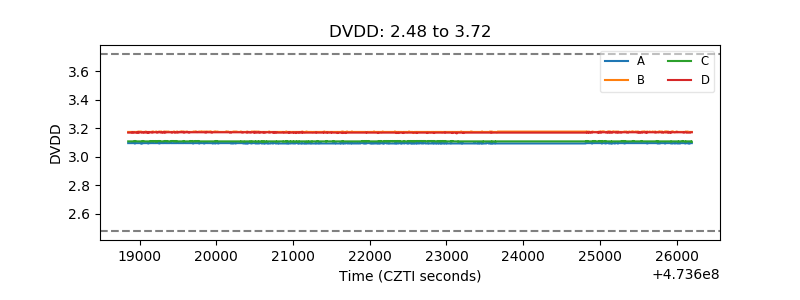 |
| Temperature 1 | 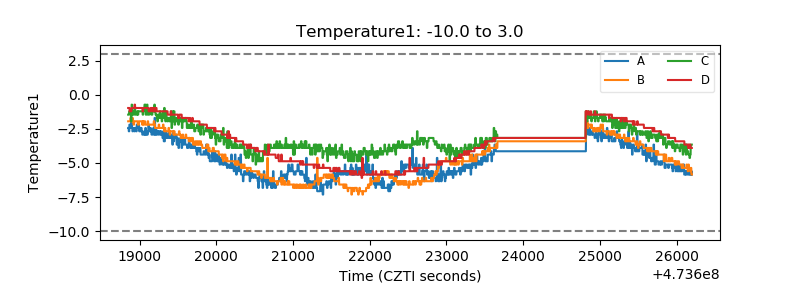 |
| Veto HV Monitor | 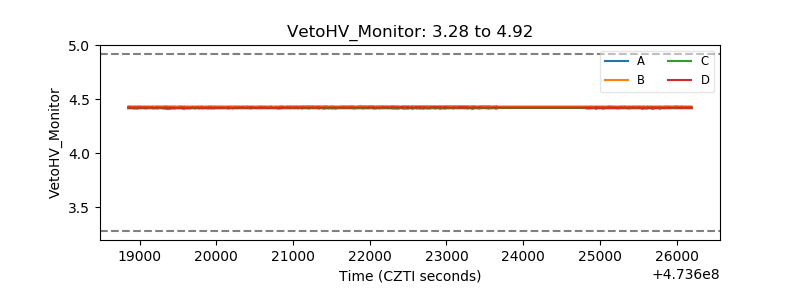 |
| Veto LLD | 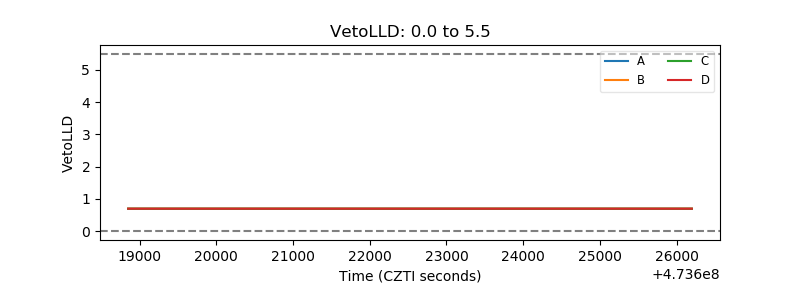 |
| Alpha Counter | 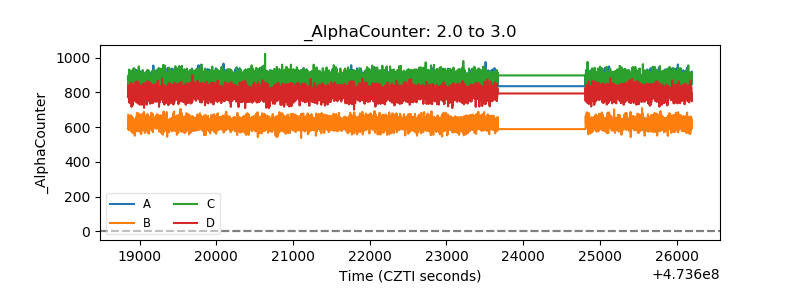 |
| _CPM_Rate | 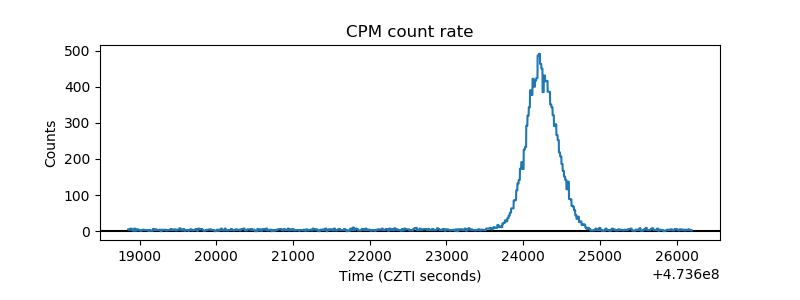 |
| CZT Counter | 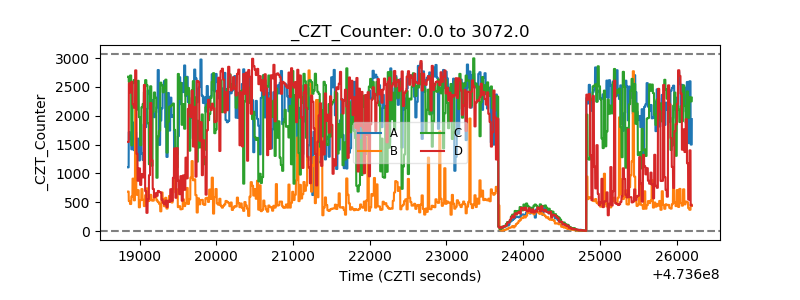 |
| +2.5 Volts monitor | 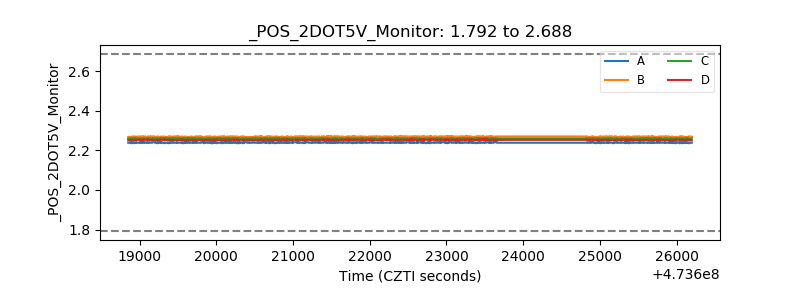 |
| +5 Volts monitor | 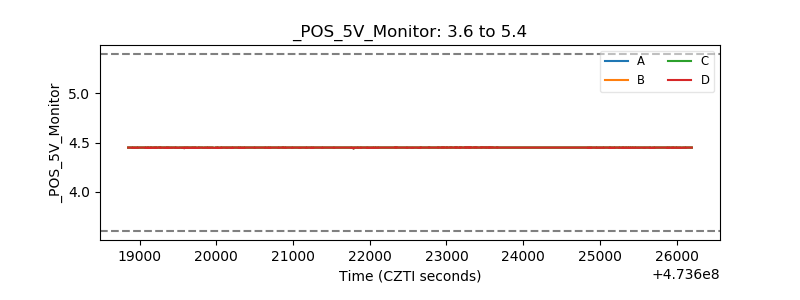 |
| _ROLL_ROT | 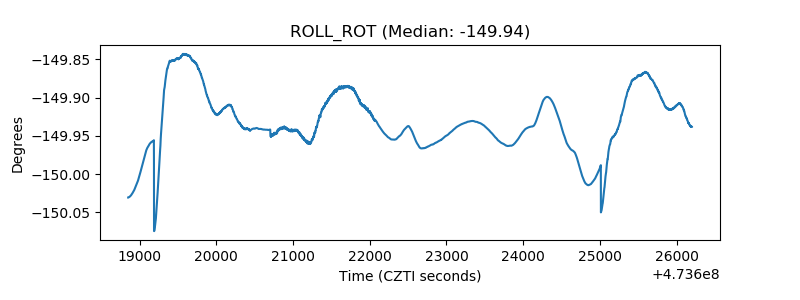 |
| _Roll_DEC | 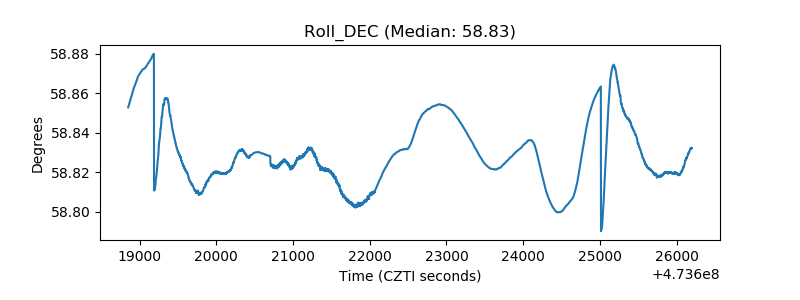 |
| _Roll_RA | 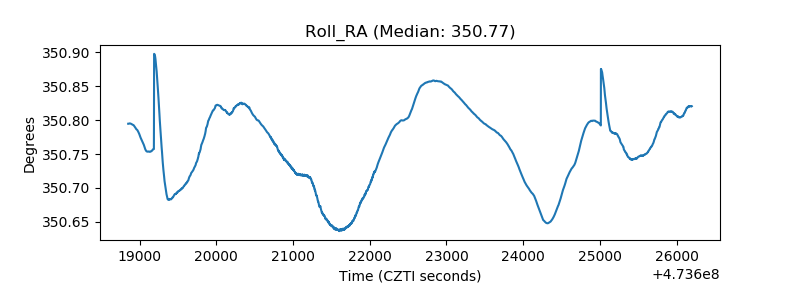 |
| Veto Counter | 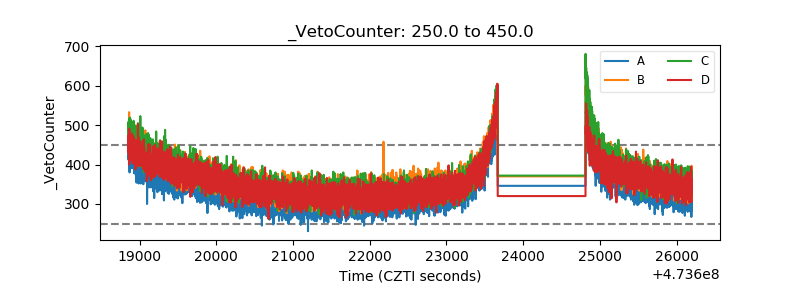 |