| Param | Original file | Final file |
|---|---|---|
| Filename | modeM0/AS1C09_003T01_9000006442_50132cztM0_level2.fits | modeM0/AS1C09_003T01_9000006442_50132cztM0_level2_quad_clean.evt |
| Size (bytes) | 1,196,784,000 | 64,517,760 |
| Size | 1.1 GB | 61.5 MB |
| Events in quadrant A | 13,466,803 | 292,377 |
| Events in quadrant B | 5,023,851 | 654,689 |
| Events in quadrant C | 13,965,969 | 170,639 |
| Events in quadrant D | 11,321,802 | 362,173 |
| Mode M9 | |||
|---|---|---|---|
| Quadrant | BADHDUFLAG | Total packets | Discarded packets |
| A | 0 | 11 | 0 |
| B | 0 | 12 | 0 |
| C | 0 | 12 | 0 |
| D | 0 | 12 | 0 |
| Mode M0 | |||
|---|---|---|---|
| Quadrant | BADHDUFLAG | Total packets | Discarded packets |
| A | 0 | 44650 | 5 |
| B | 0 | 19564 | 2 |
| C | 0 | 46085 | 2 |
| D | 0 | 38291 | 2 |
| Mode SS | |||
|---|---|---|---|
| Quadrant | BADHDUFLAG | Total packets | Discarded packets |
| A | 0 | 138 | 0 |
| B | 0 | 138 | 0 |
| C | 0 | 138 | 0 |
| D | 0 | 138 | 0 |
| Quadrant | Total seconds | Saturated seconds | Saturation percentage |
|---|---|---|---|
| A | 6786 | 4054 | 59.740642% |
| B | 6786 | 570 | 8.399646% |
| C | 6786 | 5174 | 76.245211% |
| D | 6786 | 2848 | 41.968759% |
Noise dominated data is calculated using 1-second bins in cleaned event files. If a bin has >2000 counts, and if more than 50% of those come from <1% of pixels, then it is considered to be noise-dominated and hence unusable.
| Quadrant | # 1 sec bins | Bins with >0 counts | Bins with >2000 counts | High rate bins dominated by noise | Noise dominated (total time) | Noise dominated (detector-on time) | Marked lightcurve |
|---|---|---|---|---|---|---|---|
| A | 7711 | 6787 | 3640 | 3640 | 47.21% | 53.63% | 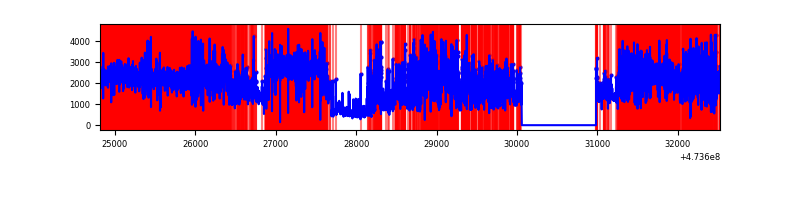 |
| B | 7711 | 6787 | 389 | 389 | 5.04% | 5.73% | 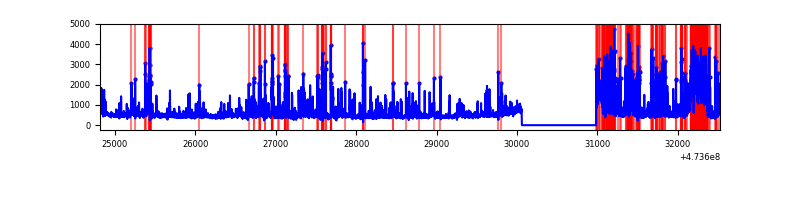 |
| C | 7711 | 6787 | 3763 | 3763 | 48.80% | 55.44% | 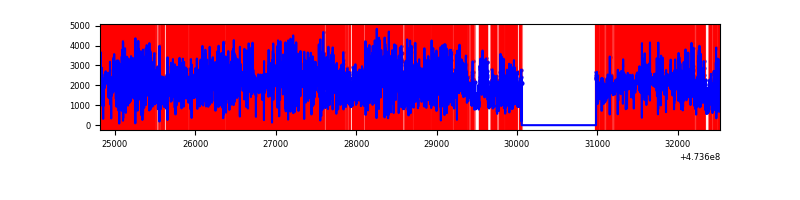 |
| D | 7711 | 6787 | 2644 | 2644 | 34.29% | 38.96% | 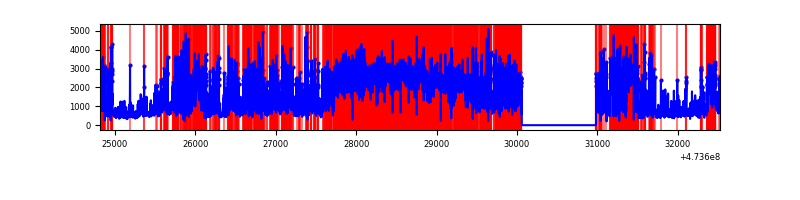 |
Top three noisy pixels from each quadrant. If the there are fewer than three noisy pixels in the level2.evt file, extra rows are filled as -1
| Pixel properties | Quadrant properties | ||||||
|---|---|---|---|---|---|---|---|
| Quadrant | DetID | PixID | Counts | Sigma | Mean | Median | Sigma |
| A | 6 | 250 | 5119279 | 38092.99 | 537 | 526 | 134.4 |
| A | 4 | 13 | 1898834 | 14126.92 | 537 | 526 | 134.4 |
| A | 0 | 98 | 1120421 | 8334.09 | 537 | 526 | 134.4 |
| B | 4 | 170 | 1024552 | 7054.71 | 685 | 661 | 145.1 |
| B | 4 | 206 | 457711 | 3149.12 | 685 | 661 | 145.1 |
| B | 5 | 185 | 152242 | 1044.41 | 685 | 661 | 145.1 |
| C | 4 | 111 | 4908717 | 47142.47 | 361 | 358 | 104.1 |
| C | 15 | 230 | 2755114 | 26458.13 | 361 | 358 | 104.1 |
| C | 15 | 147 | 1166752 | 11202.66 | 361 | 358 | 104.1 |
| D | 15 | 106 | 2777685 | 16935.85 | 568 | 548 | 164.0 |
| D | 15 | 168 | 1421849 | 8667.54 | 568 | 548 | 164.0 |
| D | 2 | 249 | 842862 | 5136.7 | 568 | 548 | 164.0 |
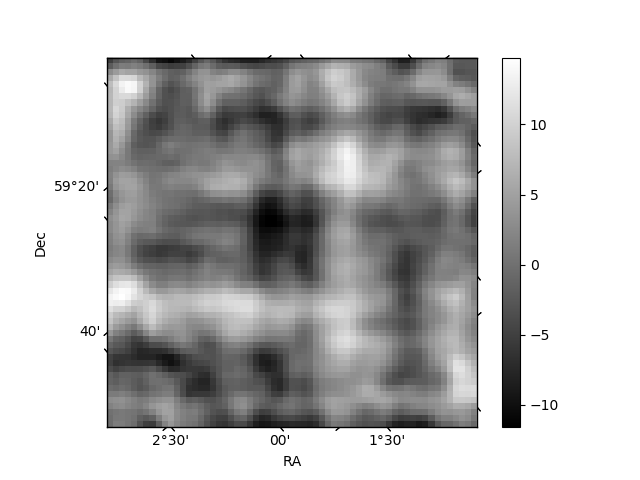
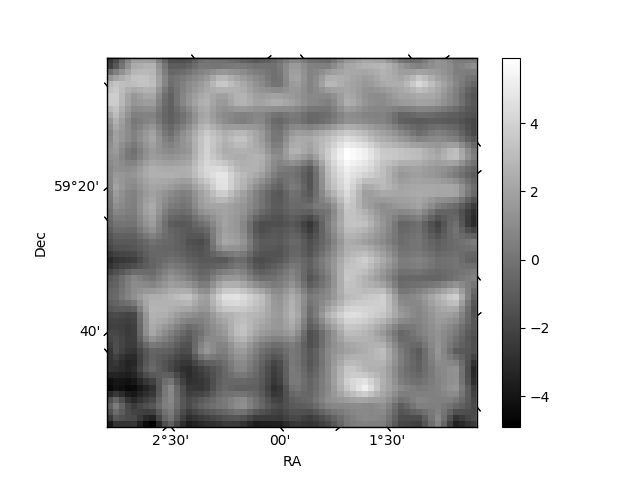
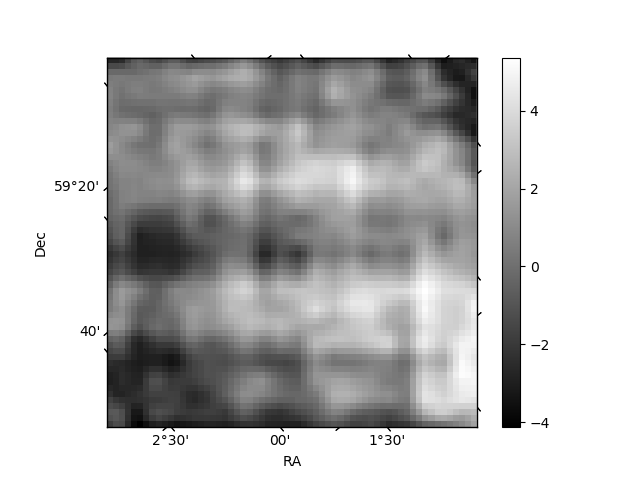
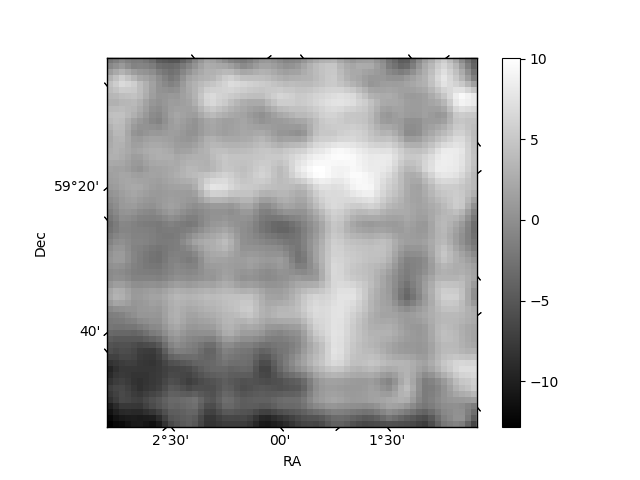
Histogram calculated using DETX and DETY for each event in the final _common_clean file
| Quadrant A | 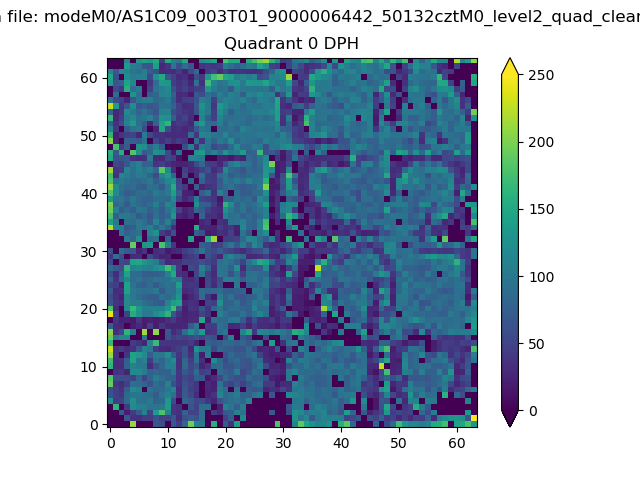 |
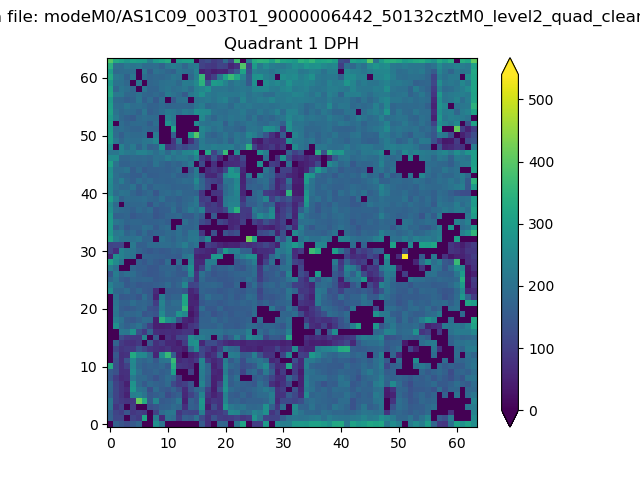 |
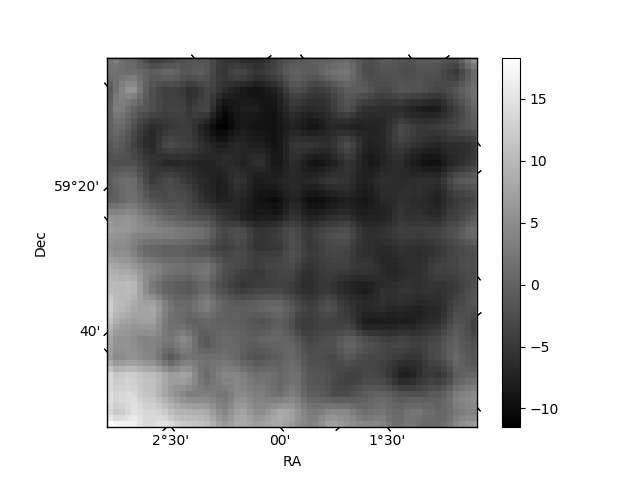
Quadrant B |
|---|---|---|---|
| Quadrant D | 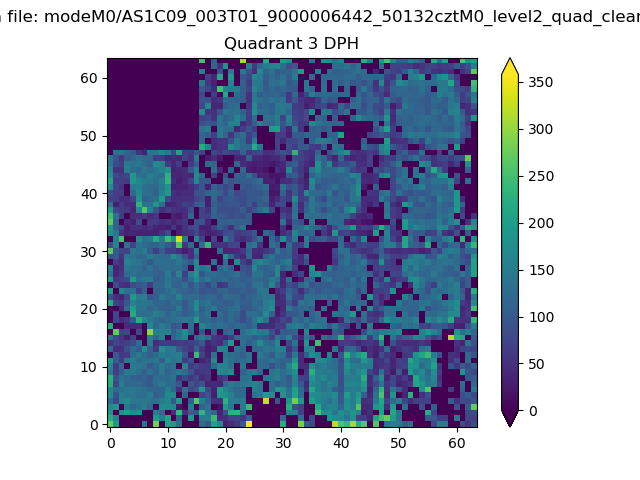 |
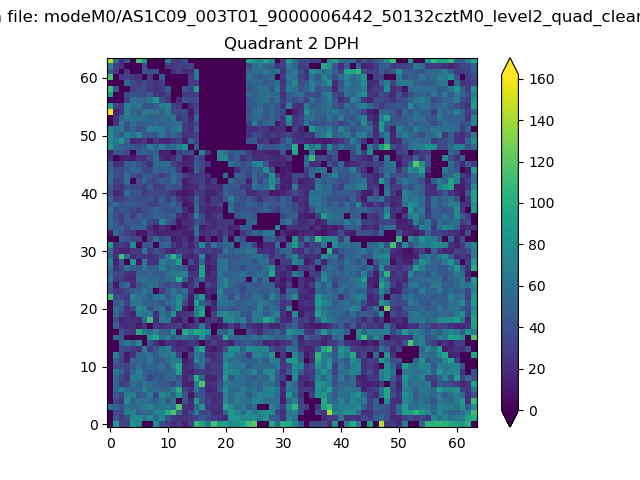 |
Quadrant C |
| Plot type | Count rate plots | Images |
|---|---|---|
| Comparison with Poisson distribution Blue bars denote a histogram of data divided into 1 sec bins. Red curve is a Poisson curve with rate = median count rate of data. |
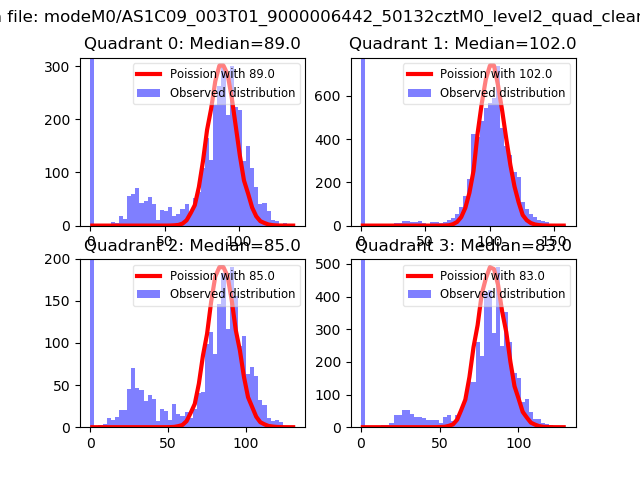 |
 |
| Quadrant-wise count rates Data is divided into 100 sec bins |
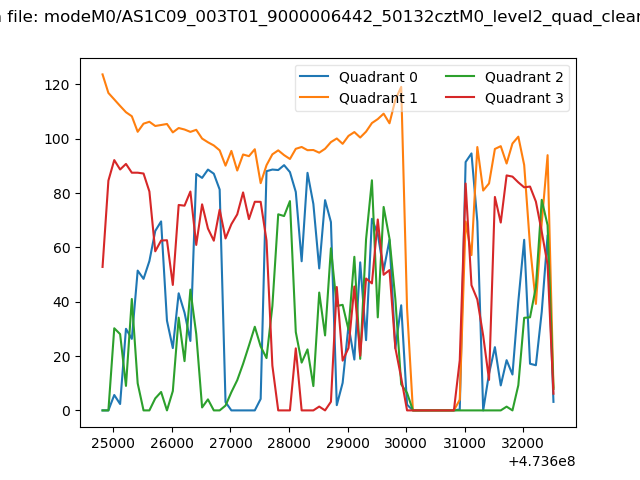 |
|
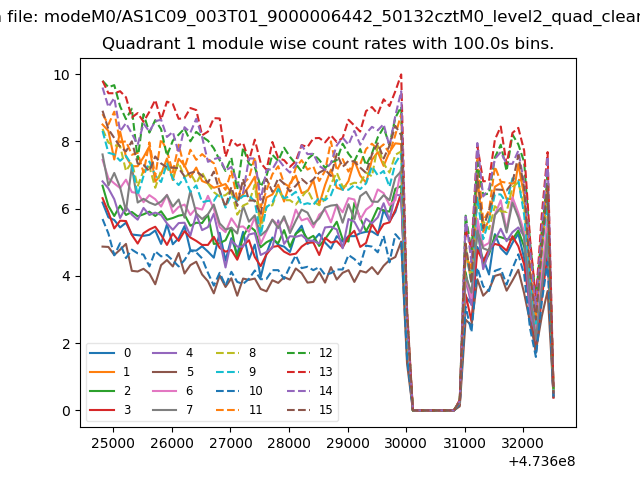
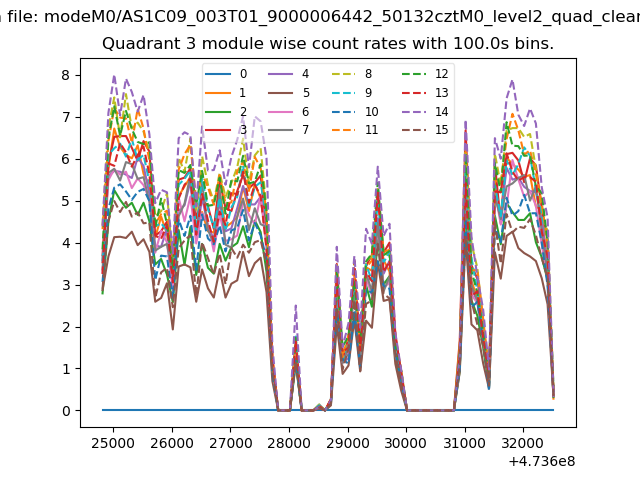
| Module-wise count rates for Quadrant A Data is divided into 100 sec bins |
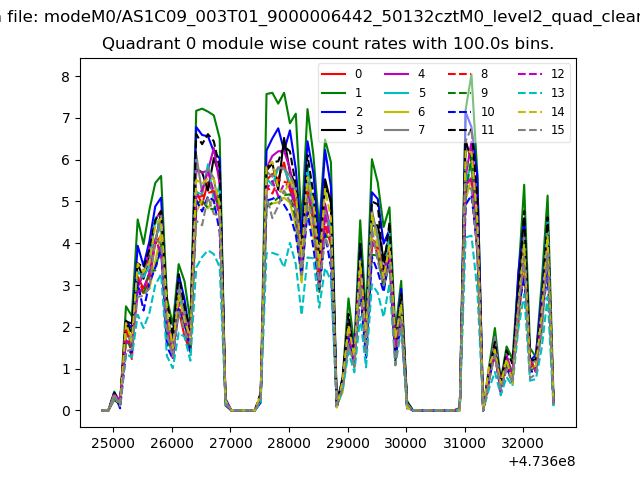 |
 |
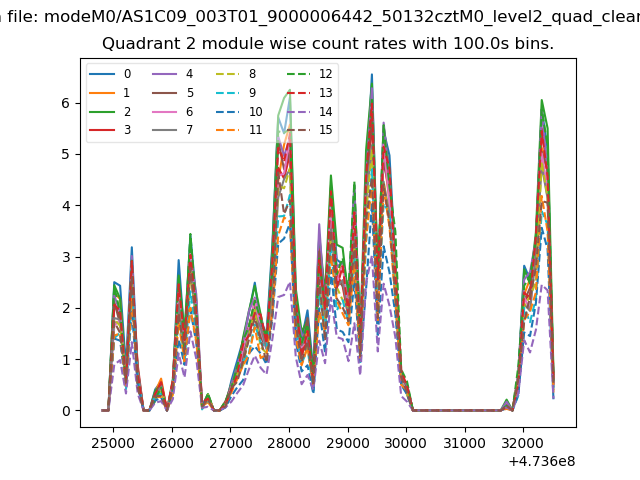
| Module-wise count rates for Quadrant B Data is divided into 100 sec bins |
 |
 |
| Module-wise count rates for Quadrant C Data is divided into 100 sec bins |
 |
 |
| Module-wise count rates for Quadrant D Data is divided into 100 sec bins |
 |
 |
| Parameter | Plot |
|---|---|
| CZT HV Monitor | 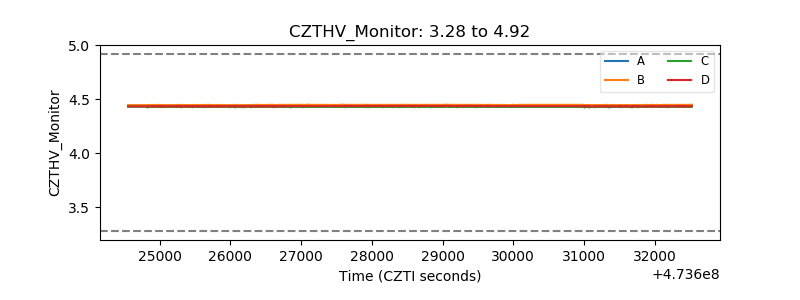 |
| D_VDD | 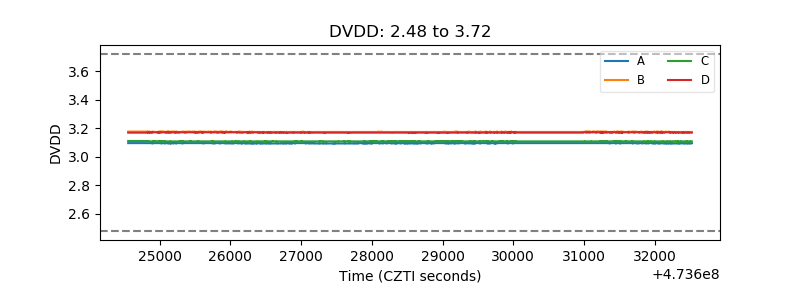 |
| Temperature 1 | 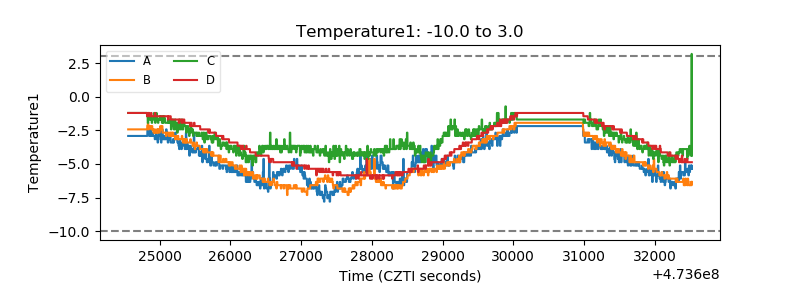 |
| Veto HV Monitor | 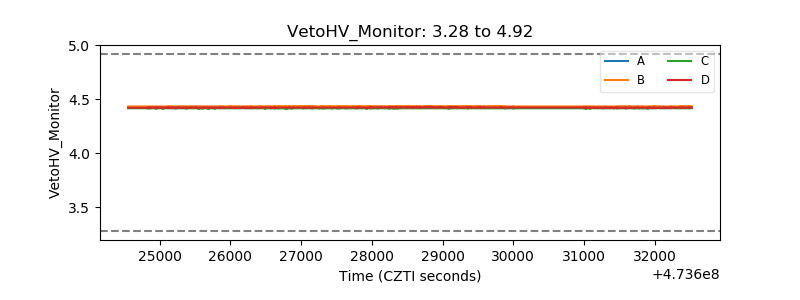 |
| Veto LLD | 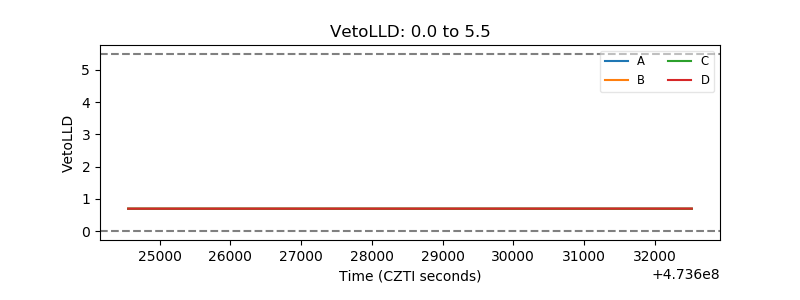 |
| Alpha Counter | 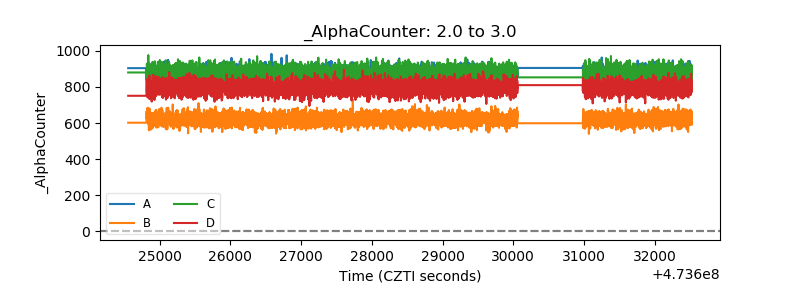 |
| _CPM_Rate | 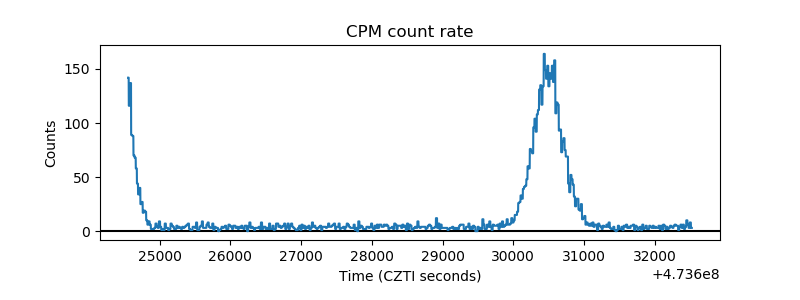 |
| CZT Counter | 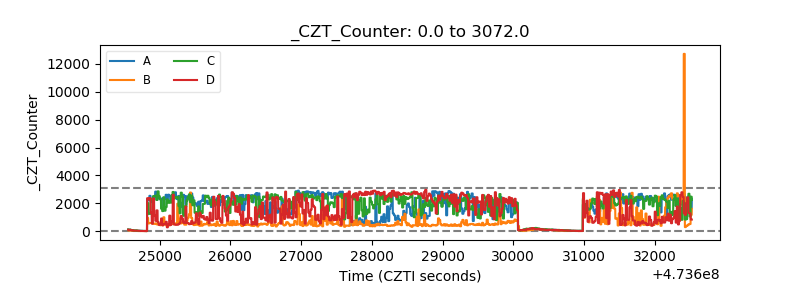 |
| +2.5 Volts monitor | 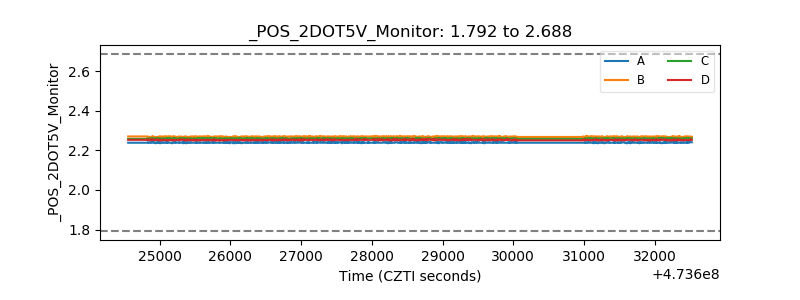 |
| +5 Volts monitor | 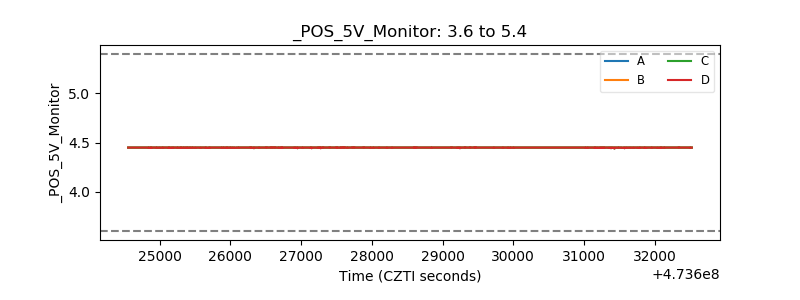 |
| _ROLL_ROT | 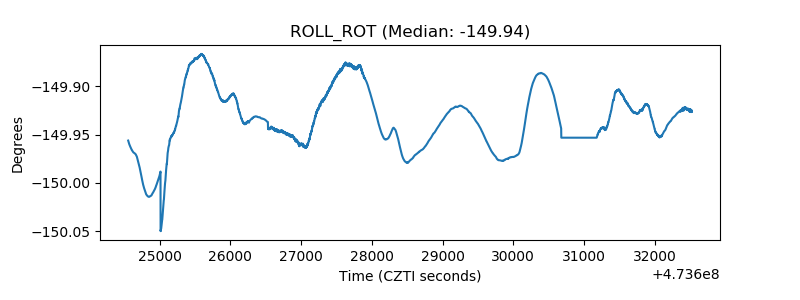 |
| _Roll_DEC | 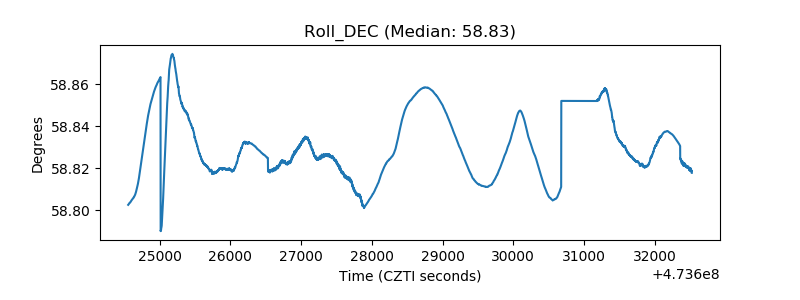 |
| _Roll_RA | 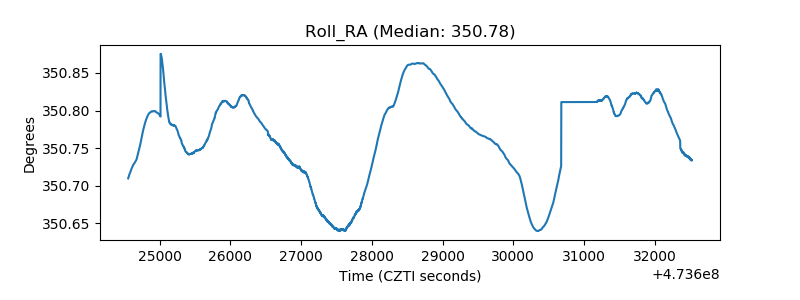 |
| Veto Counter | 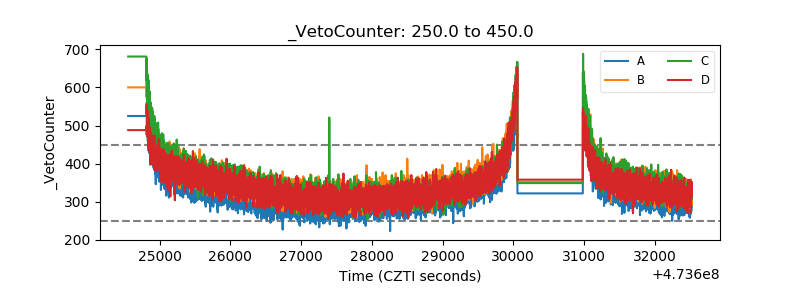 |