| Param | Original file | Final file |
|---|---|---|
| Filename | modeM0/AS1C09_003T01_9000006442_50133cztM0_level2.fits | modeM0/AS1C09_003T01_9000006442_50133cztM0_level2_quad_clean.evt |
| Size (bytes) | 1,402,891,200 | 54,529,920 |
| Size | 1.3 GB | 52.0 MB |
| Events in quadrant A | 15,436,980 | 169,058 |
| Events in quadrant B | 8,829,418 | 563,084 |
| Events in quadrant C | 15,208,695 | 87,697 |
| Events in quadrant D | 11,922,161 | 346,777 |
| Mode M9 | |||
|---|---|---|---|
| Quadrant | BADHDUFLAG | Total packets | Discarded packets |
| A | 0 | 6 | 0 |
| B | 0 | 6 | 0 |
| C | 0 | 6 | 0 |
| D | 0 | 6 | 0 |
| Mode M0 | |||
|---|---|---|---|
| Quadrant | BADHDUFLAG | Total packets | Discarded packets |
| A | 0 | 50603 | 1 |
| B | 0 | 31038 | 1 |
| C | 0 | 49882 | 1 |
| D | 0 | 40216 | 3 |
| Mode SS | |||
|---|---|---|---|
| Quadrant | BADHDUFLAG | Total packets | Discarded packets |
| A | 0 | 142 | 0 |
| B | 0 | 142 | 0 |
| C | 0 | 142 | 0 |
| D | 0 | 142 | 0 |
| Quadrant | Total seconds | Saturated seconds | Saturation percentage |
|---|---|---|---|
| A | 6946 | 5361 | 77.181111% |
| B | 6946 | 1724 | 24.820040% |
| C | 6946 | 6078 | 87.503599% |
| D | 6945 | 3108 | 44.751620% |
Noise dominated data is calculated using 1-second bins in cleaned event files. If a bin has >2000 counts, and if more than 50% of those come from <1% of pixels, then it is considered to be noise-dominated and hence unusable.
| Quadrant | # 1 sec bins | Bins with >0 counts | Bins with >2000 counts | High rate bins dominated by noise | Noise dominated (total time) | Noise dominated (detector-on time) | Marked lightcurve |
|---|---|---|---|---|---|---|---|
| A | 7516 | 6948 | 4937 | 4937 | 65.69% | 71.06% | 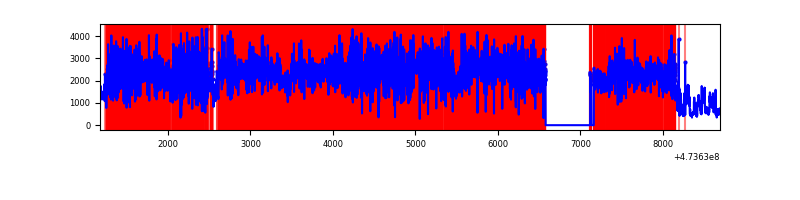 |
| B | 7516 | 6948 | 1399 | 1399 | 18.61% | 20.14% | 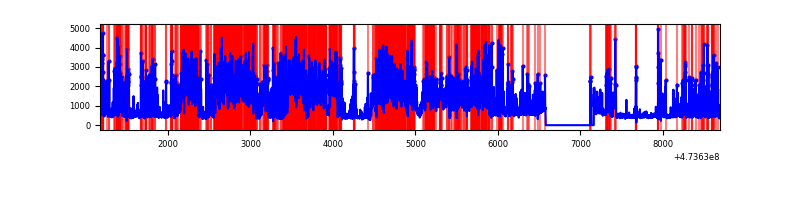 |
| C | 7516 | 6947 | 4753 | 4753 | 63.24% | 68.42% | 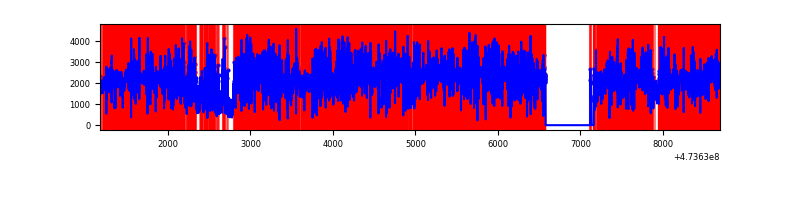 |
| D | 7515 | 6947 | 2896 | 2896 | 38.54% | 41.69% | 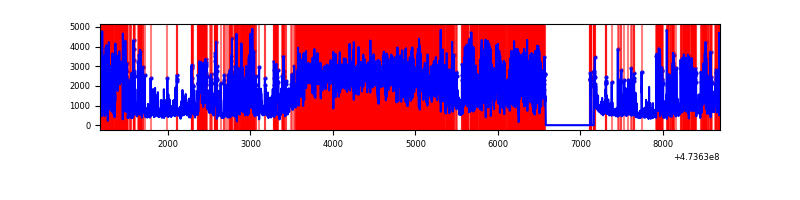 |
Top three noisy pixels from each quadrant. If the there are fewer than three noisy pixels in the level2.evt file, extra rows are filled as -1
| Pixel properties | Quadrant properties | ||||||
|---|---|---|---|---|---|---|---|
| Quadrant | DetID | PixID | Counts | Sigma | Mean | Median | Sigma |
| A | 6 | 250 | 6504957 | 52336.05 | 481 | 467 | 124.3 |
| A | 0 | 98 | 2020474 | 16253.26 | 481 | 467 | 124.3 |
| A | 4 | 13 | 2000403 | 16091.77 | 481 | 467 | 124.3 |
| B | 4 | 170 | 4725887 | 33795.58 | 658 | 636 | 139.8 |
| B | 4 | 206 | 633245 | 4524.5 | 658 | 636 | 139.8 |
| B | 2 | 176 | 263311 | 1878.68 | 658 | 636 | 139.8 |
| C | 4 | 111 | 6594457 | 81963.09 | 271 | 269 | 80.5 |
| C | 15 | 230 | 2265852 | 28160.28 | 271 | 269 | 80.5 |
| C | 15 | 213 | 2109771 | 26220.26 | 271 | 269 | 80.5 |
| D | 15 | 106 | 3045953 | 18472.76 | 570 | 550 | 164.9 |
| D | 15 | 168 | 2121631 | 12866.02 | 570 | 550 | 164.9 |
| D | 2 | 249 | 655758 | 3974.35 | 570 | 550 | 164.9 |
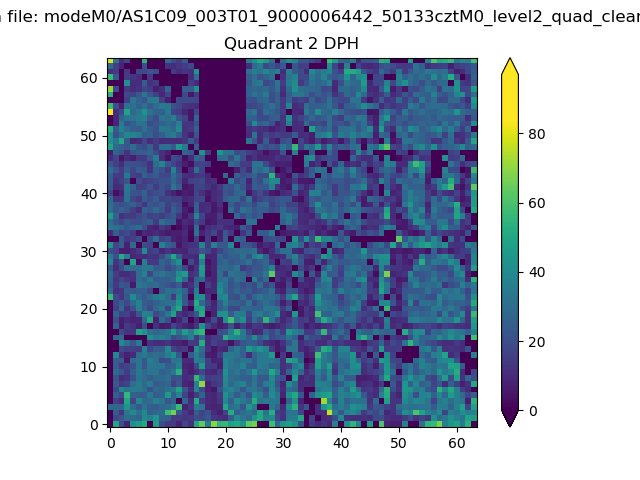
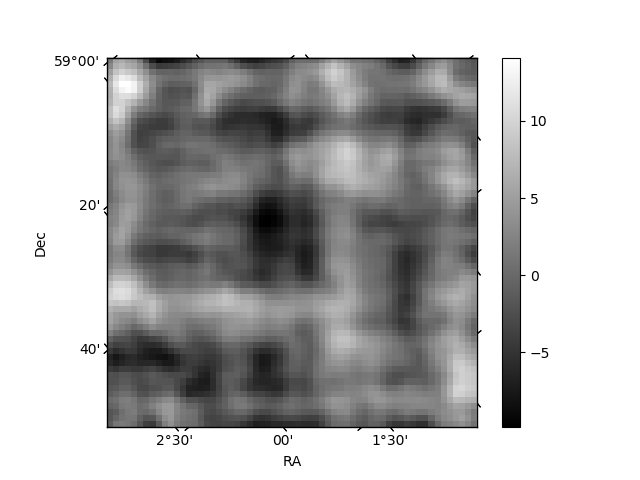
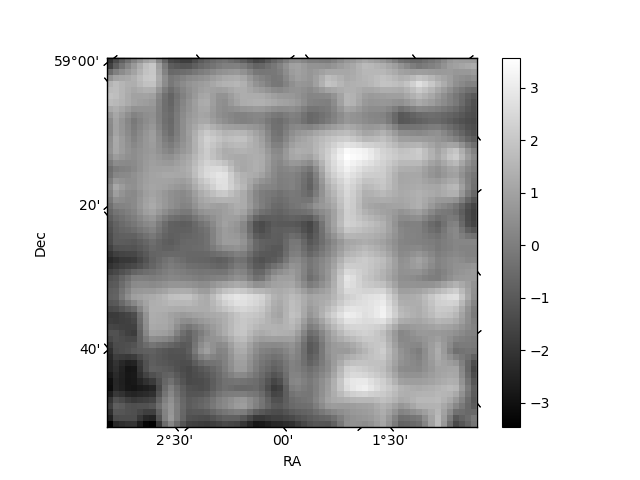
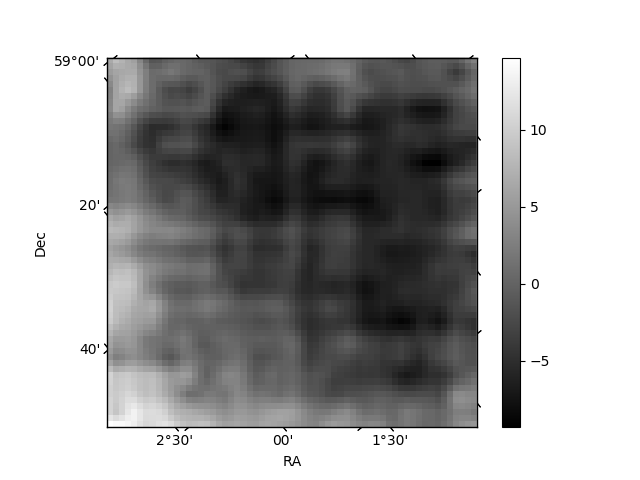
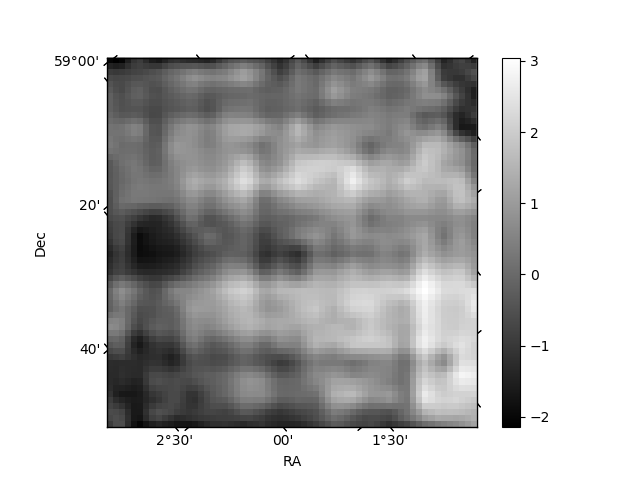
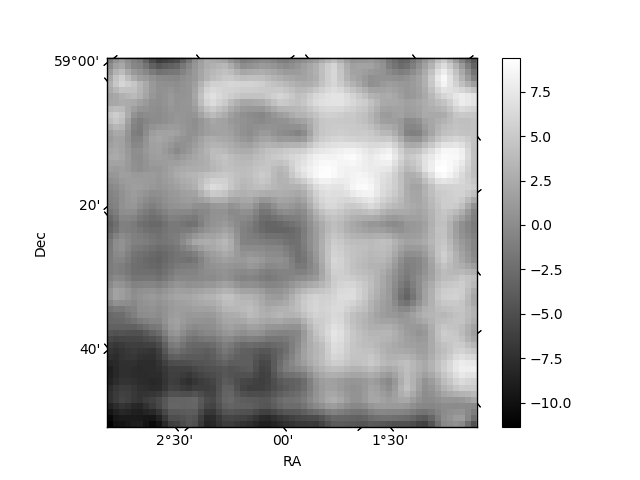
Histogram calculated using DETX and DETY for each event in the final _common_clean file
| Quadrant A | 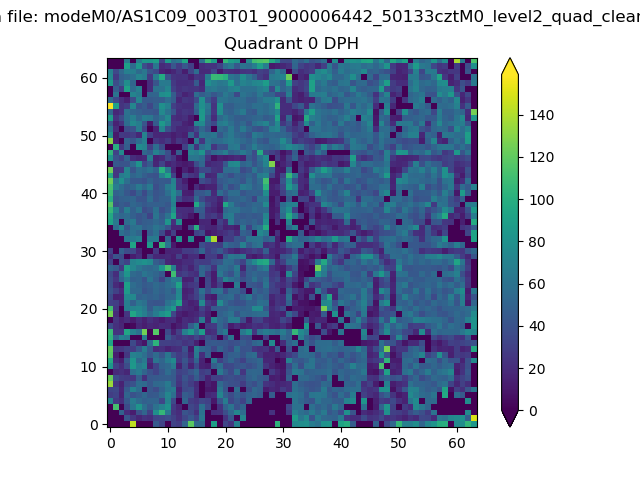 |
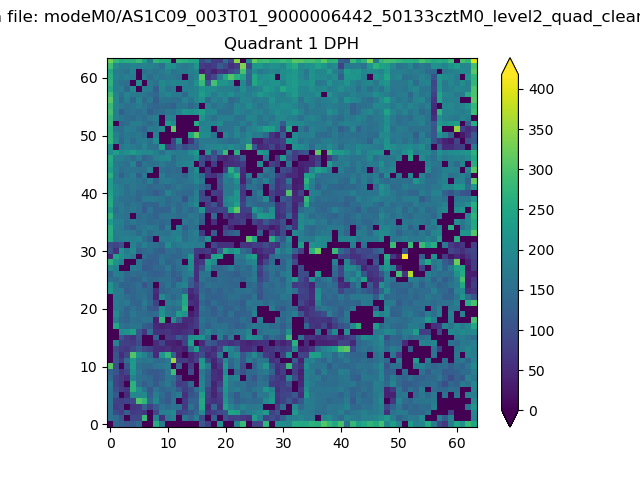 |
Quadrant B |
|---|---|---|---|
| Quadrant D | 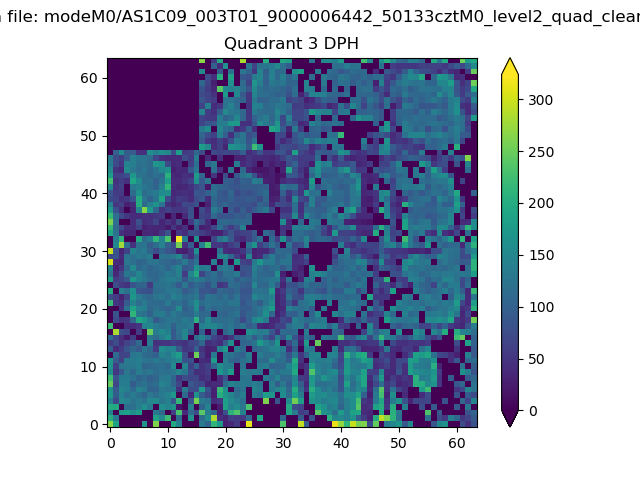 |
 |
Quadrant C |
| Plot type | Count rate plots | Images |
|---|---|---|
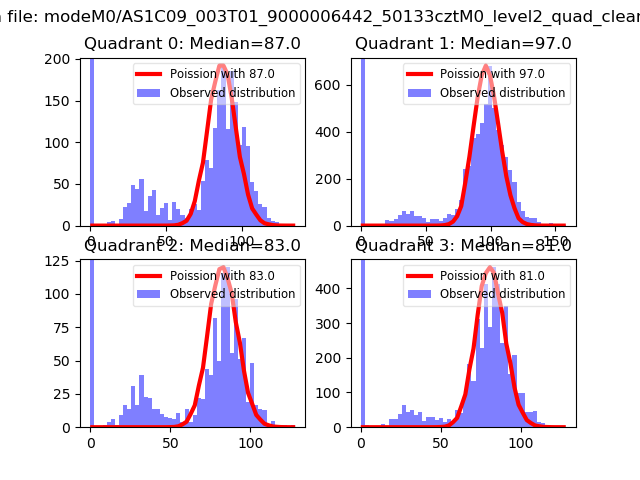
| Comparison with Poisson distribution Blue bars denote a histogram of data divided into 1 sec bins. Red curve is a Poisson curve with rate = median count rate of data. |
 |
 |
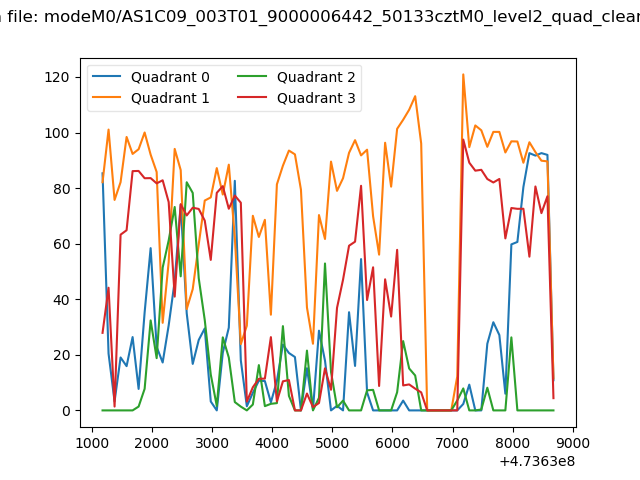
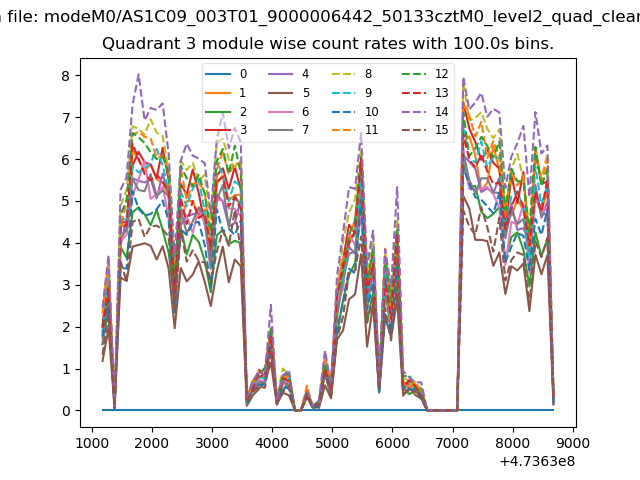
| Quadrant-wise count rates Data is divided into 100 sec bins |
 |
|
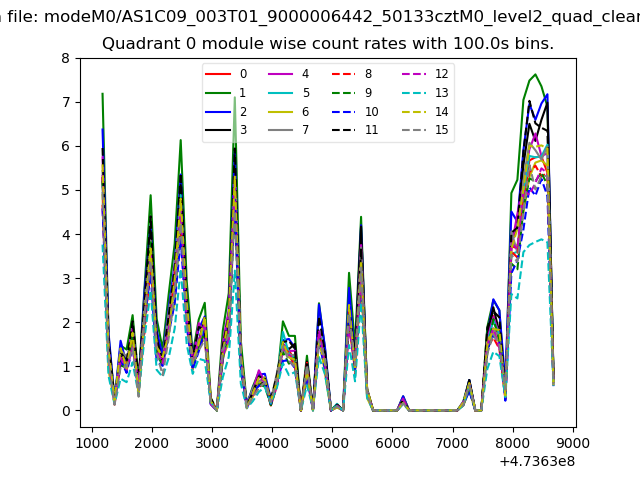
| Module-wise count rates for Quadrant A Data is divided into 100 sec bins |
 |
 |
| Module-wise count rates for Quadrant B Data is divided into 100 sec bins |
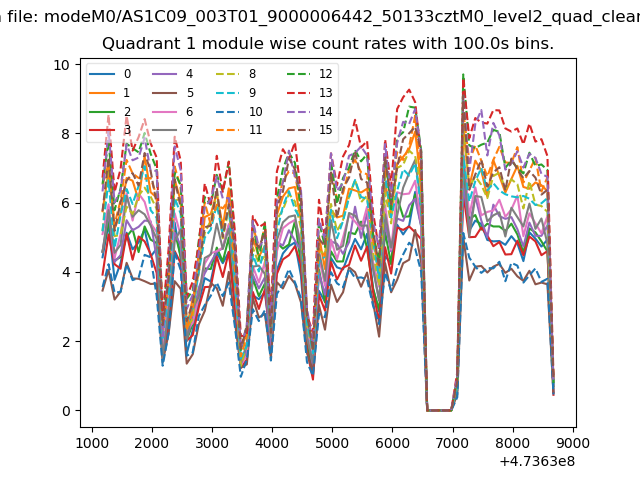 |
 |
| Module-wise count rates for Quadrant C Data is divided into 100 sec bins |
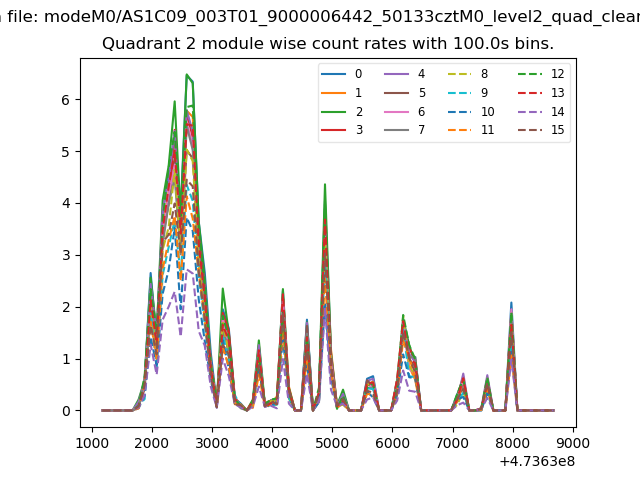 |
 |
| Module-wise count rates for Quadrant D Data is divided into 100 sec bins |
 |
 |
| Parameter | Plot |
|---|---|
| CZT HV Monitor | 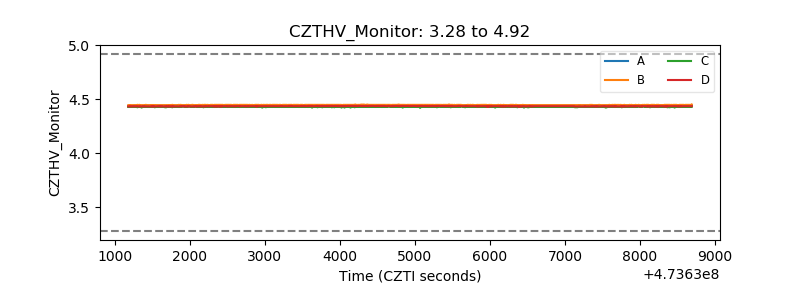 |
| D_VDD | 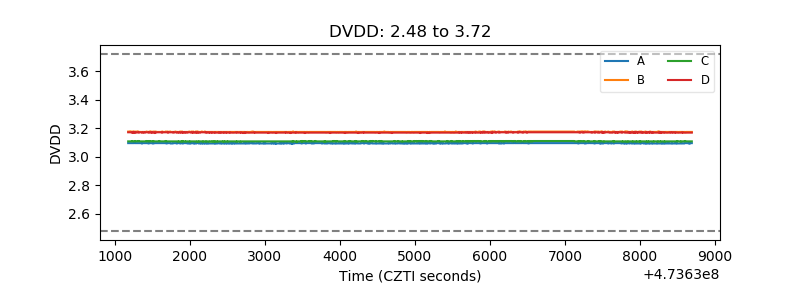 |
| Temperature 1 | 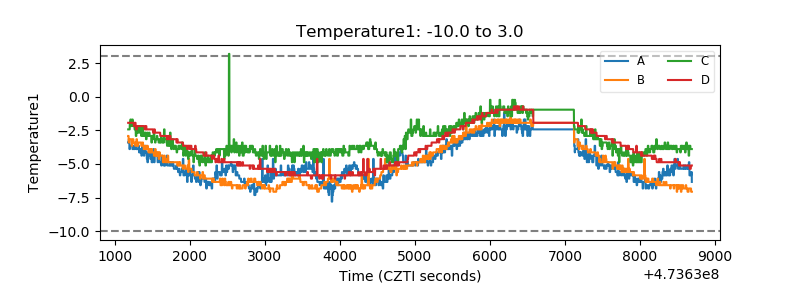 |
| Veto HV Monitor | 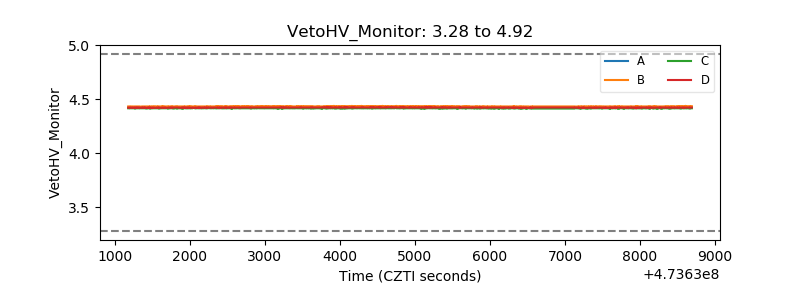 |
| Veto LLD | 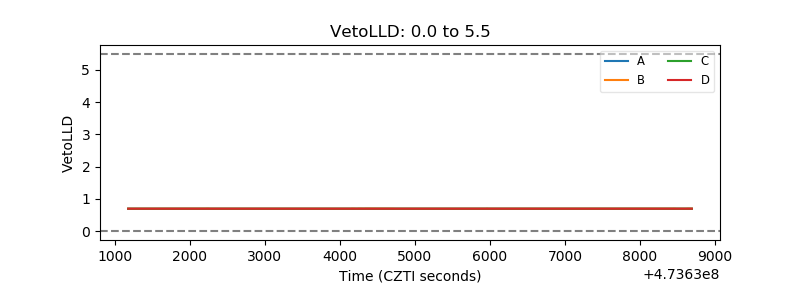 |
| Alpha Counter | 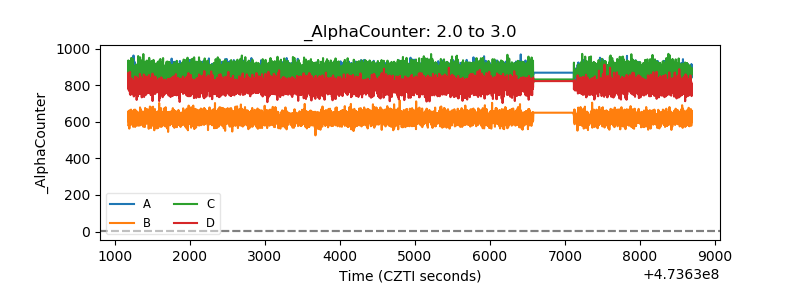 |
| _CPM_Rate | 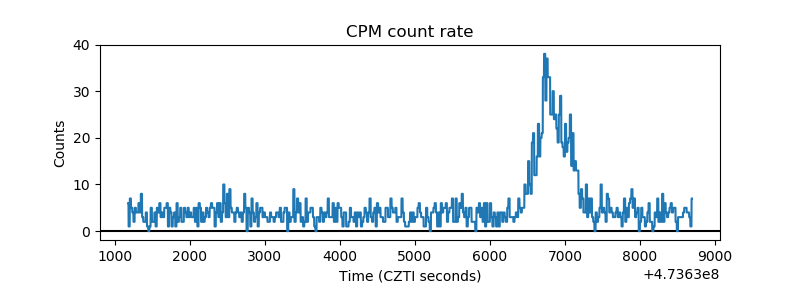 |
| CZT Counter | 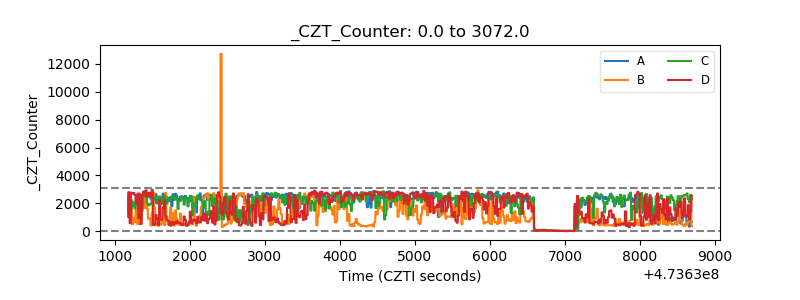 |
| +2.5 Volts monitor |  |
| +5 Volts monitor | 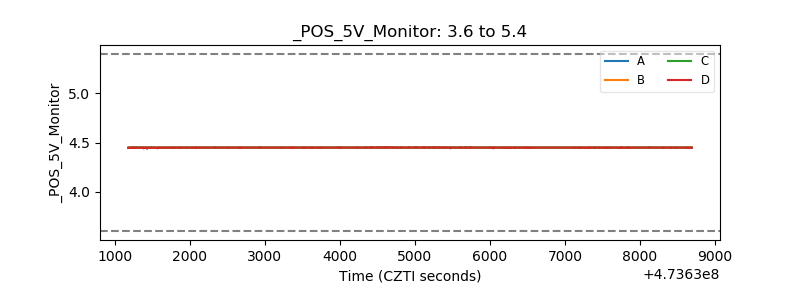 |
| _ROLL_ROT | 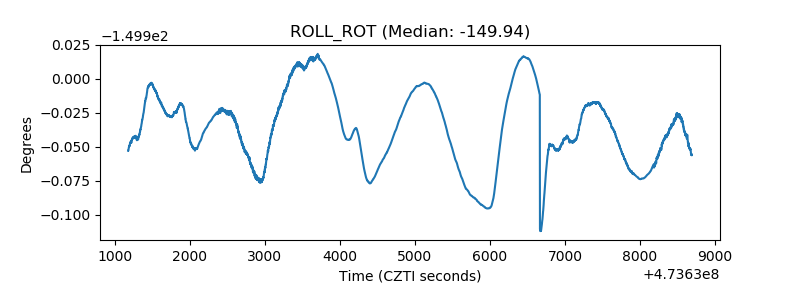 |
| _Roll_DEC | 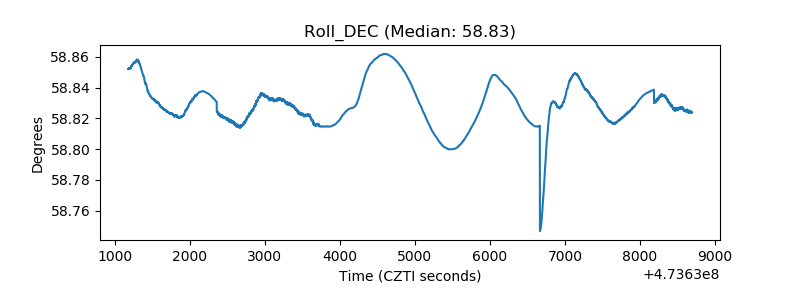 |
| _Roll_RA | 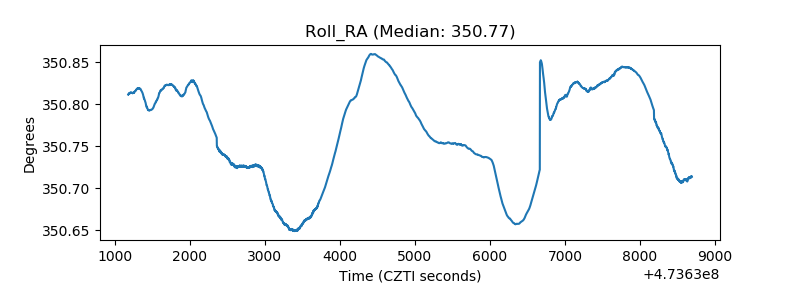 |
| Veto Counter | 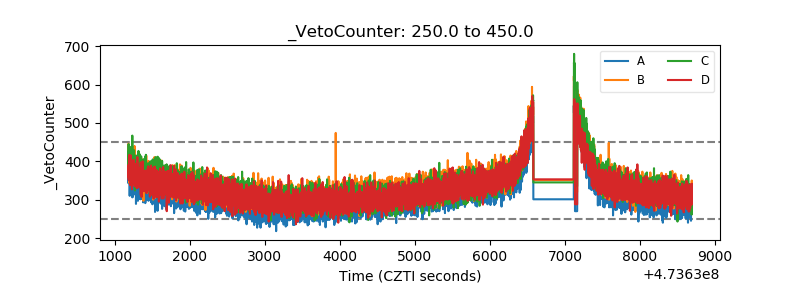 |