| Param | Original file | Final file |
|---|---|---|
| Filename | modeM0/AS1C09_003T01_9000006442_50134cztM0_level2.fits | modeM0/AS1C09_003T01_9000006442_50134cztM0_level2_quad_clean.evt |
| Size (bytes) | 1,427,417,280 | 76,118,400 |
| Size | 1.3 GB | 72.6 MB |
| Events in quadrant A | 12,753,473 | 532,977 |
| Events in quadrant B | 6,283,729 | 760,578 |
| Events in quadrant C | 17,537,177 | 124,546 |
| Events in quadrant D | 15,638,933 | 321,297 |
| Mode M9 | |||
|---|---|---|---|
| Quadrant | BADHDUFLAG | Total packets | Discarded packets |
| A | 0 | 2 | 0 |
| B | 0 | 3 | 0 |
| C | 0 | 3 | 0 |
| D | 0 | 3 | 0 |
| Mode M0 | |||
|---|---|---|---|
| Quadrant | BADHDUFLAG | Total packets | Discarded packets |
| A | 0 | 43590 | 1 |
| B | 0 | 24475 | 1 |
| C | 0 | 57645 | 1 |
| D | 0 | 52045 | 6 |
| Mode SS | |||
|---|---|---|---|
| Quadrant | BADHDUFLAG | Total packets | Discarded packets |
| A | 0 | 164 | 0 |
| B | 0 | 164 | 0 |
| C | 0 | 164 | 0 |
| D | 0 | 164 | 0 |
| Quadrant | Total seconds | Saturated seconds | Saturation percentage |
|---|---|---|---|
| A | 8125 | 2627 | 32.332308% |
| B | 8125 | 749 | 9.218462% |
| C | 8125 | 6861 | 84.443077% |
| D | 8124 | 4671 | 57.496307% |
Noise dominated data is calculated using 1-second bins in cleaned event files. If a bin has >2000 counts, and if more than 50% of those come from <1% of pixels, then it is considered to be noise-dominated and hence unusable.
| Quadrant | # 1 sec bins | Bins with >0 counts | Bins with >2000 counts | High rate bins dominated by noise | Noise dominated (total time) | Noise dominated (detector-on time) | Marked lightcurve |
|---|---|---|---|---|---|---|---|
| A | 8155 | 8126 | 2318 | 2318 | 28.42% | 28.53% | 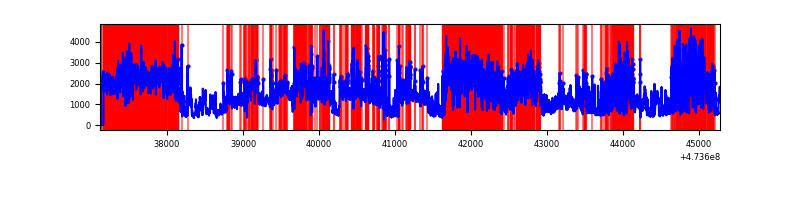 |
| B | 8155 | 8126 | 467 | 467 | 5.73% | 5.75% | 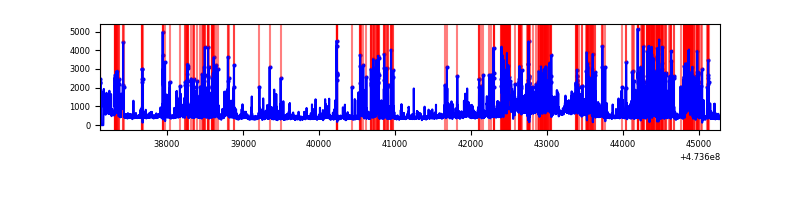 |
| C | 8154 | 8125 | 5265 | 5265 | 64.57% | 64.80% | 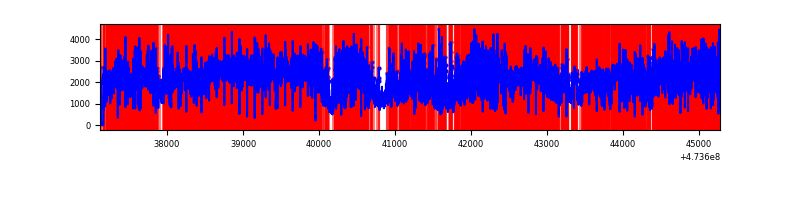 |
| D | 8154 | 8125 | 4169 | 4169 | 51.13% | 51.31% | 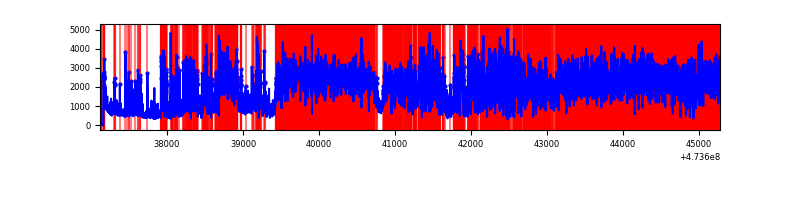 |
Top three noisy pixels from each quadrant. If the there are fewer than three noisy pixels in the level2.evt file, extra rows are filled as -1
| Pixel properties | Quadrant properties | ||||||
|---|---|---|---|---|---|---|---|
| Quadrant | DetID | PixID | Counts | Sigma | Mean | Median | Sigma |
| A | 0 | 98 | 2992399 | 15867.78 | 747 | 727 | 188.5 |
| A | 8 | 8 | 2360161 | 12514.4 | 747 | 727 | 188.5 |
| A | 6 | 250 | 2055205 | 10896.92 | 747 | 727 | 188.5 |
| B | 2 | 176 | 1026265 | 5960.23 | 813 | 785 | 172.1 |
| B | 4 | 170 | 785454 | 4560.61 | 813 | 785 | 172.1 |
| B | 4 | 206 | 372047 | 2157.83 | 813 | 785 | 172.1 |
| C | 4 | 111 | 6257692 | 60963.07 | 357 | 354 | 102.6 |
| C | 15 | 197 | 2835866 | 27625.41 | 357 | 354 | 102.6 |
| C | 15 | 213 | 2546311 | 24804.37 | 357 | 354 | 102.6 |
| D | 15 | 106 | 2975745 | 16707.2 | 619 | 596 | 178.1 |
| D | 15 | 168 | 1977426 | 11101.06 | 619 | 596 | 178.1 |
| D | 7 | 61 | 1618370 | 9084.75 | 619 | 596 | 178.1 |
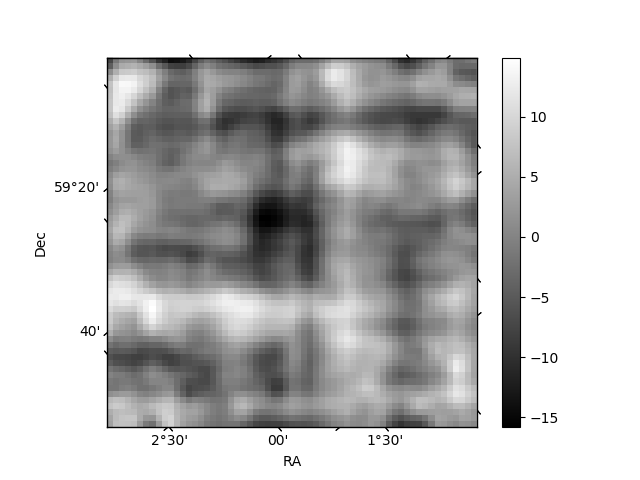
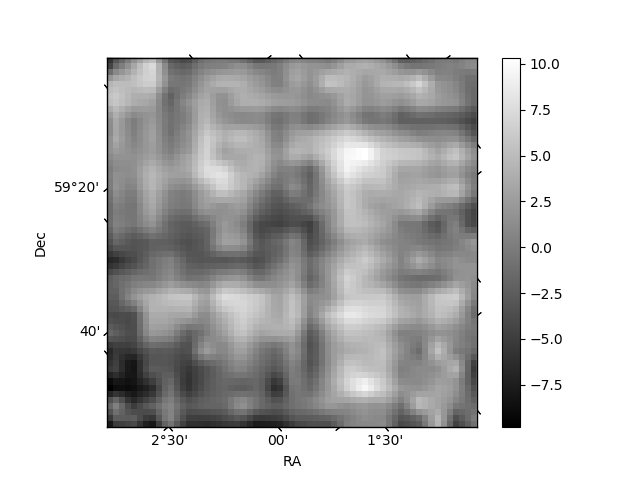
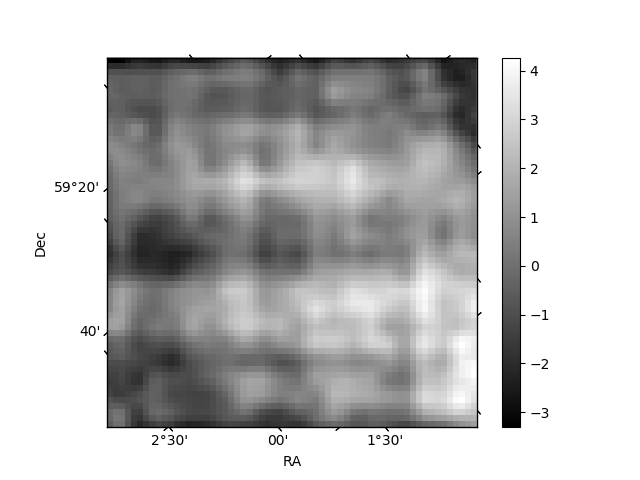
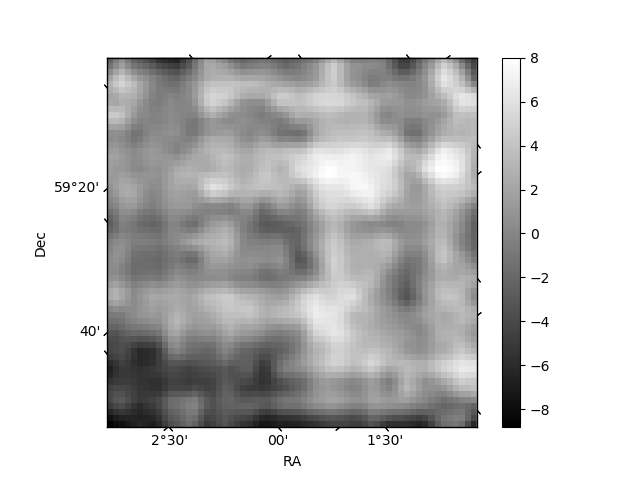
Histogram calculated using DETX and DETY for each event in the final _common_clean file
| Quadrant A | 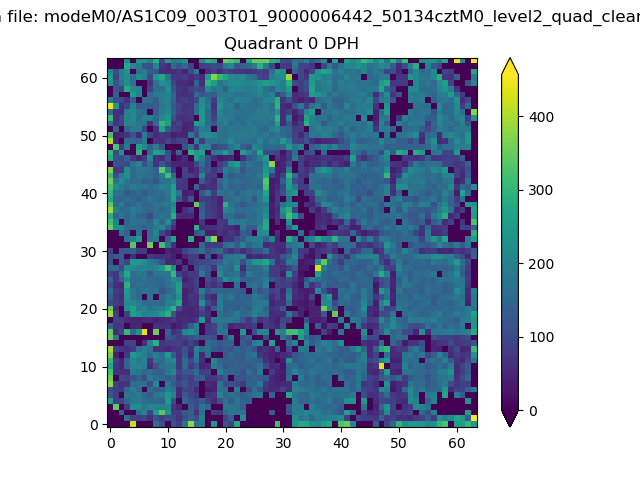 |
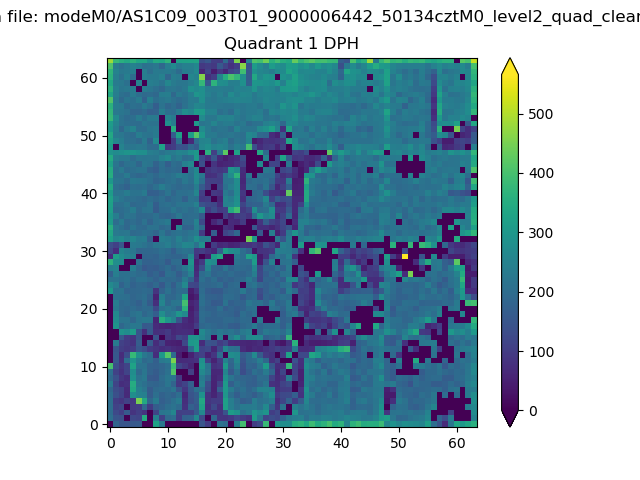 |
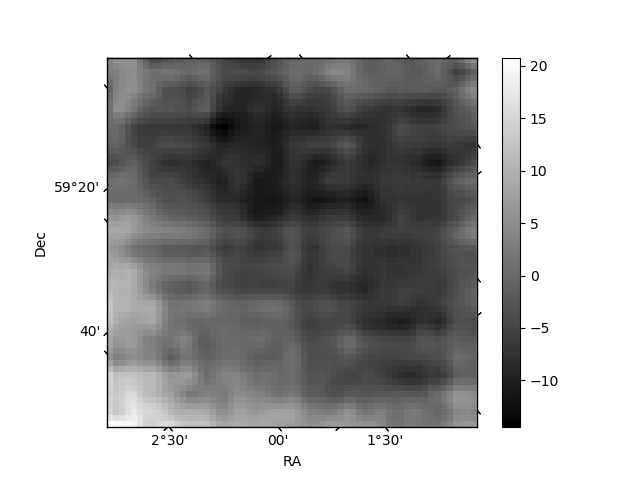
Quadrant B |
|---|---|---|---|
| Quadrant D | 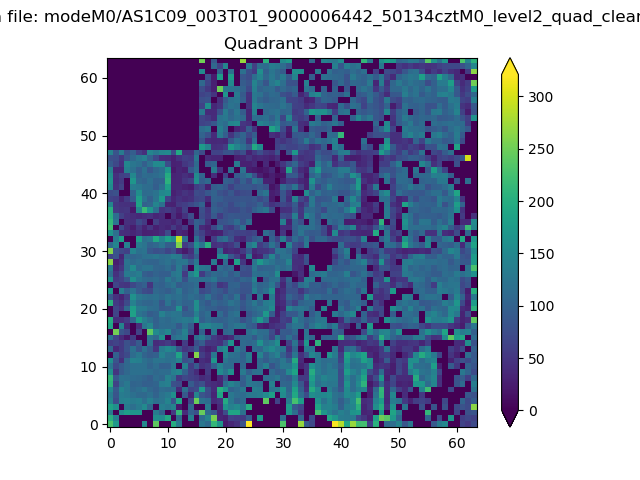 |
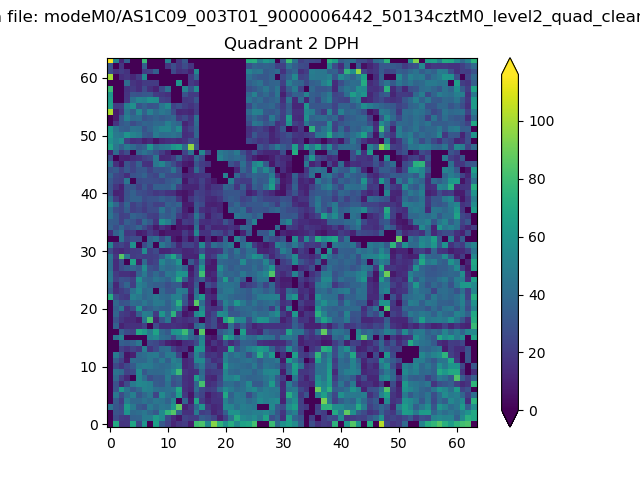 |
Quadrant C |
| Plot type | Count rate plots | Images |
|---|---|---|
| Comparison with Poisson distribution Blue bars denote a histogram of data divided into 1 sec bins. Red curve is a Poisson curve with rate = median count rate of data. |
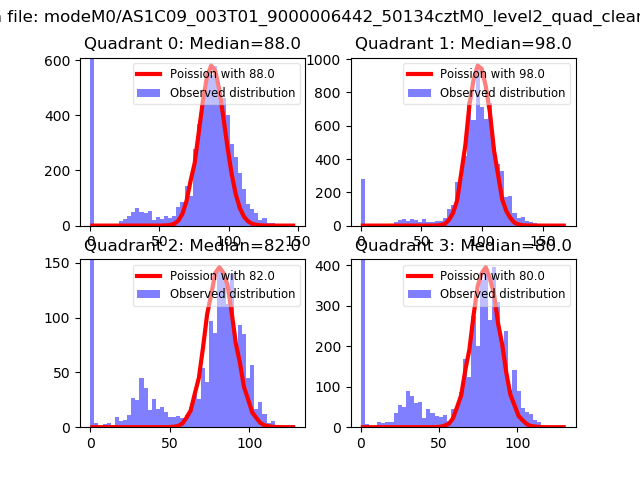 |
 |
| Quadrant-wise count rates Data is divided into 100 sec bins |
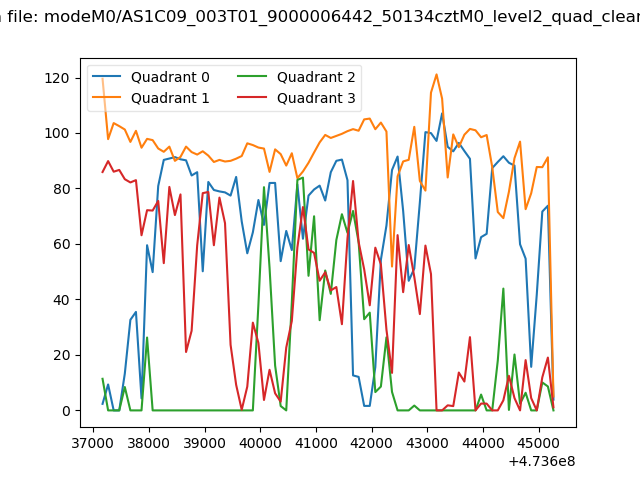 |
|
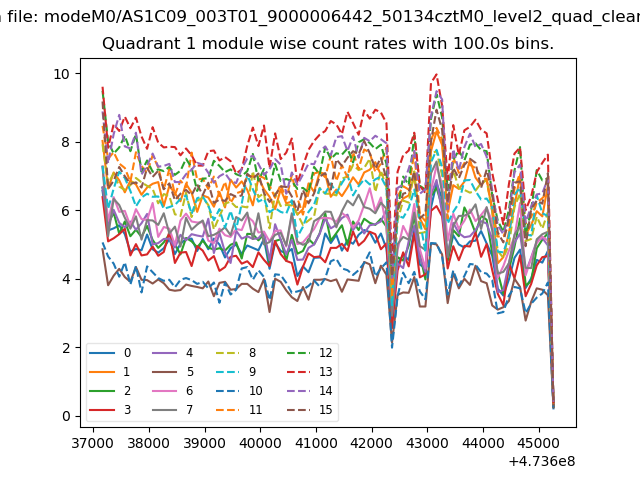
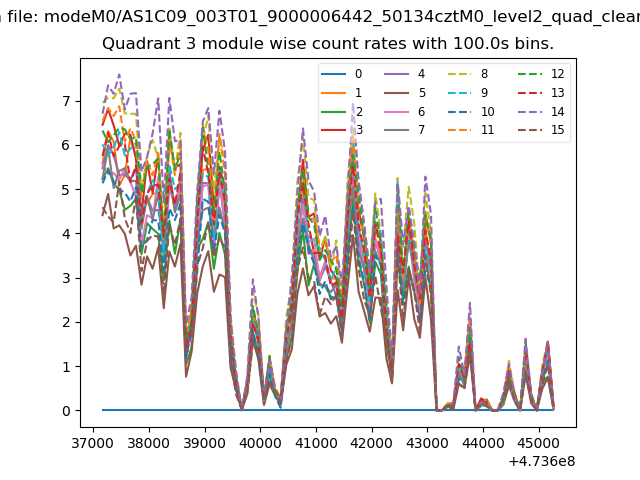
| Module-wise count rates for Quadrant A Data is divided into 100 sec bins |
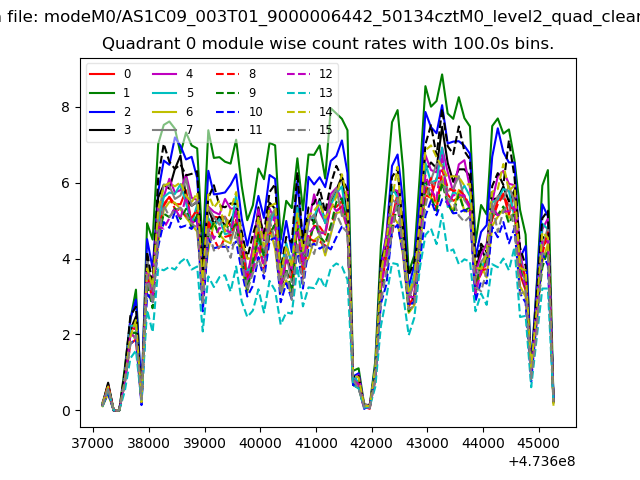 |
 |
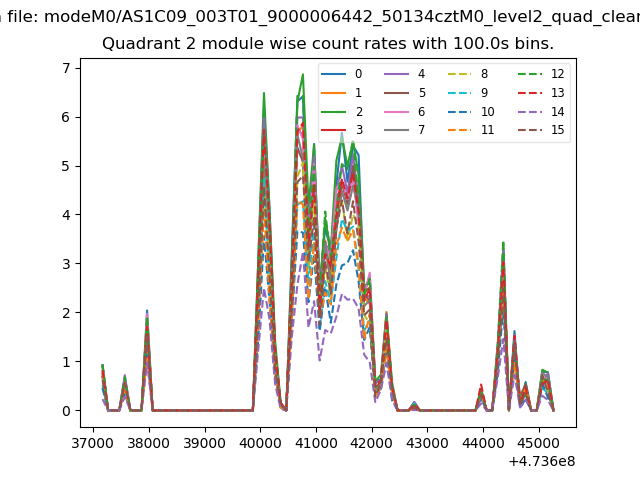
| Module-wise count rates for Quadrant B Data is divided into 100 sec bins |
 |
 |
| Module-wise count rates for Quadrant C Data is divided into 100 sec bins |
 |
 |
| Module-wise count rates for Quadrant D Data is divided into 100 sec bins |
 |
 |
| Parameter | Plot |
|---|---|
| CZT HV Monitor | 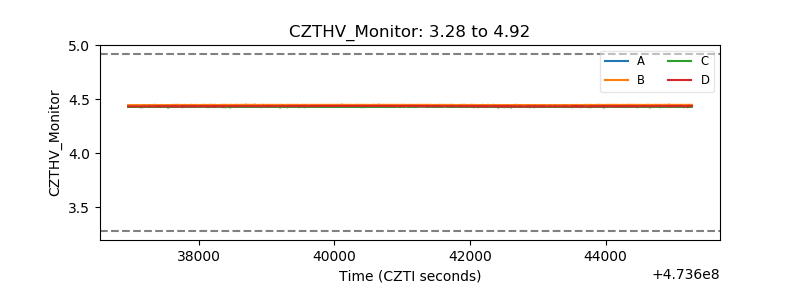 |
| D_VDD | 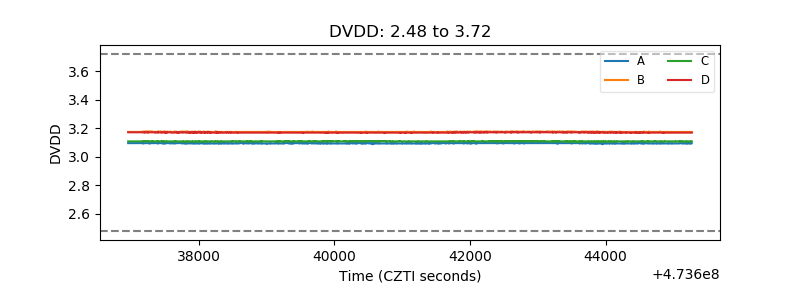 |
| Temperature 1 | 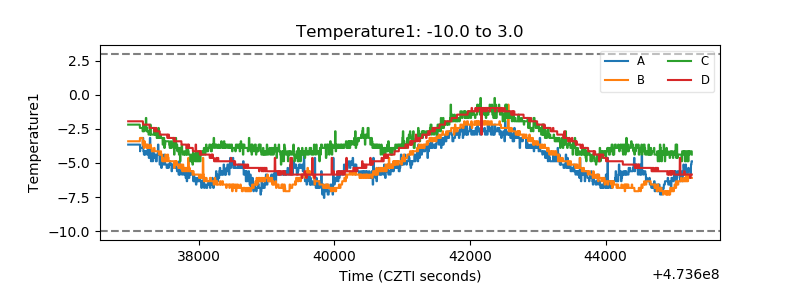 |
| Veto HV Monitor | 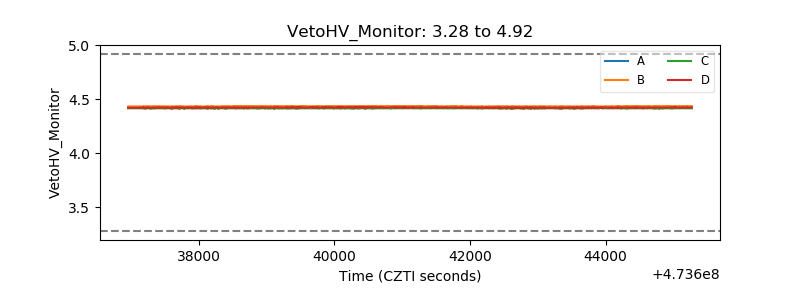 |
| Veto LLD | 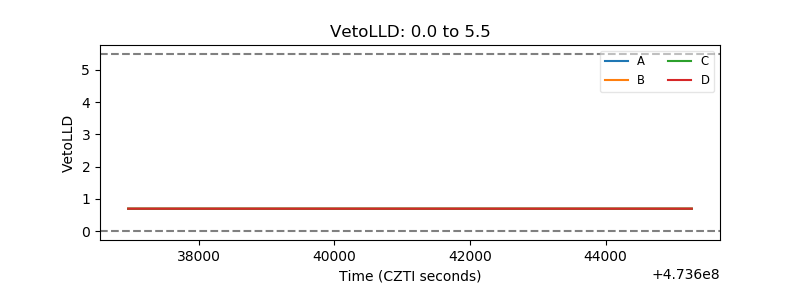 |
| Alpha Counter | 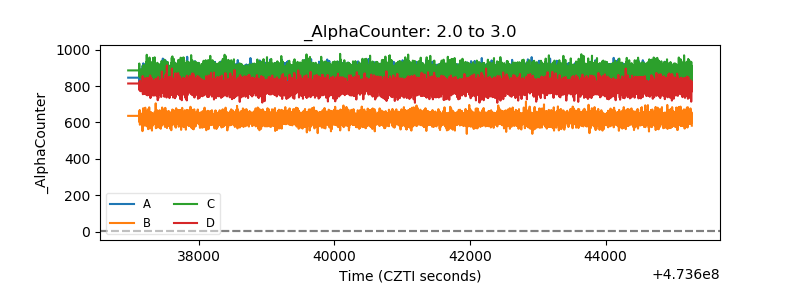 |
| _CPM_Rate | 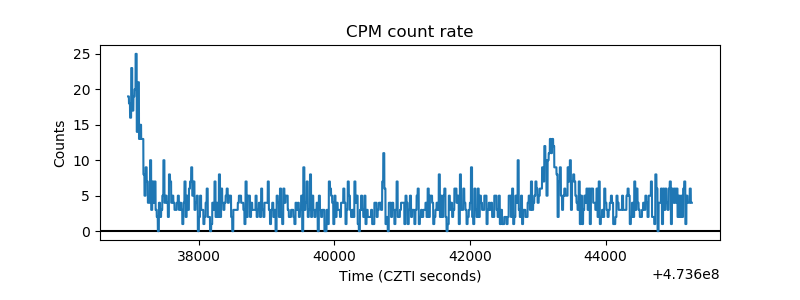 |
| CZT Counter | 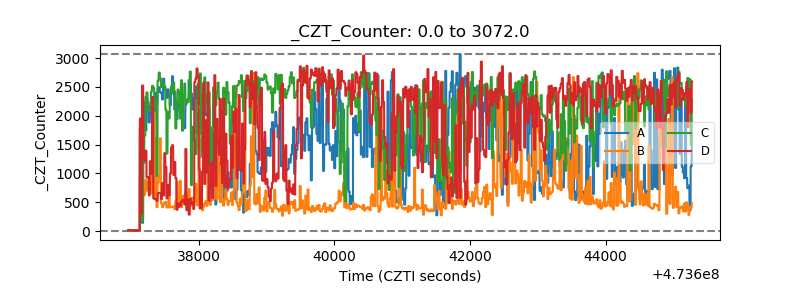 |
| +2.5 Volts monitor |  |
| +5 Volts monitor |  |
| _ROLL_ROT | 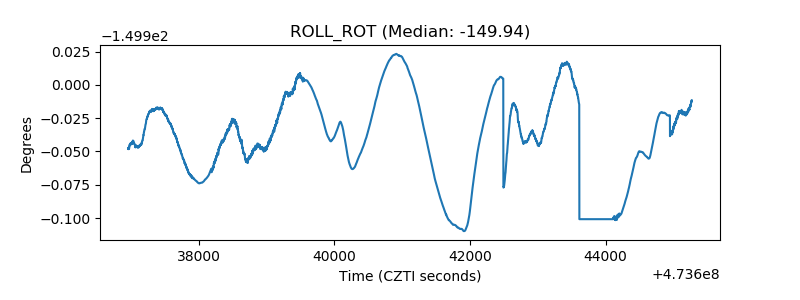 |
| _Roll_DEC | 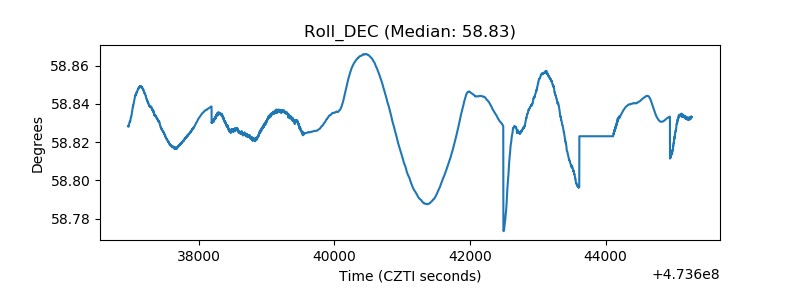 |
| _Roll_RA | 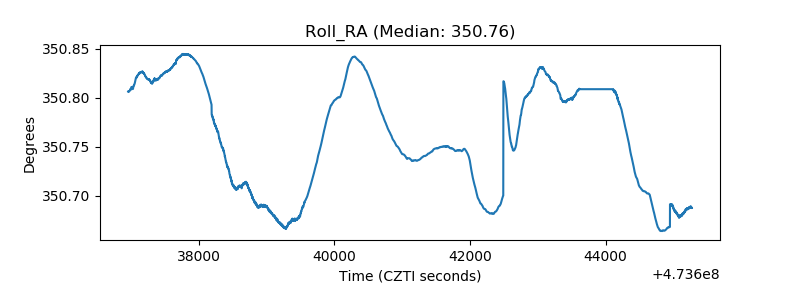 |
| Veto Counter | 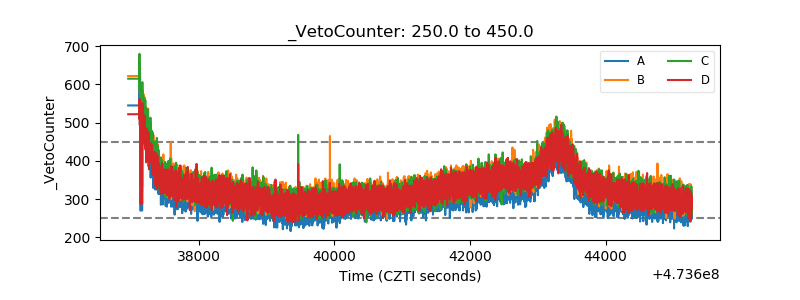 |