| Param | Original file | Final file |
|---|---|---|
| Filename | modeM0/AS1C09_003T01_9000006442_50136cztM0_level2.fits | modeM0/AS1C09_003T01_9000006442_50136cztM0_level2_quad_clean.evt |
| Size (bytes) | 1,521,855,360 | 42,773,760 |
| Size | 1.4 GB | 40.8 MB |
| Events in quadrant A | 16,191,502 | 144,597 |
| Events in quadrant B | 5,526,767 | 645,118 |
| Events in quadrant C | 16,700,672 | 2,243 |
| Events in quadrant D | 17,365,999 | 5,565 |
| Mode M0 | |||
|---|---|---|---|
| Quadrant | BADHDUFLAG | Total packets | Discarded packets |
| A | 0 | 52989 | 0 |
| B | 0 | 21342 | 0 |
| C | 0 | 54462 | 0 |
| D | 0 | 56399 | 7 |
| Mode SS | |||
|---|---|---|---|
| Quadrant | BADHDUFLAG | Total packets | Discarded packets |
| A | 0 | 142 | 0 |
| B | 0 | 142 | 0 |
| C | 0 | 142 | 0 |
| D | 0 | 142 | 0 |
| Quadrant | Total seconds | Saturated seconds | Saturation percentage |
|---|---|---|---|
| A | 7142 | 5827 | 81.587791% |
| B | 7142 | 746 | 10.445253% |
| C | 7142 | 7126 | 99.775973% |
| D | 7141 | 7093 | 99.327825% |
Noise dominated data is calculated using 1-second bins in cleaned event files. If a bin has >2000 counts, and if more than 50% of those come from <1% of pixels, then it is considered to be noise-dominated and hence unusable.
| Quadrant | # 1 sec bins | Bins with >0 counts | Bins with >2000 counts | High rate bins dominated by noise | Noise dominated (total time) | Noise dominated (detector-on time) | Marked lightcurve |
|---|---|---|---|---|---|---|---|
| A | 7141 | 7141 | 4934 | 4934 | 69.09% | 69.09% | 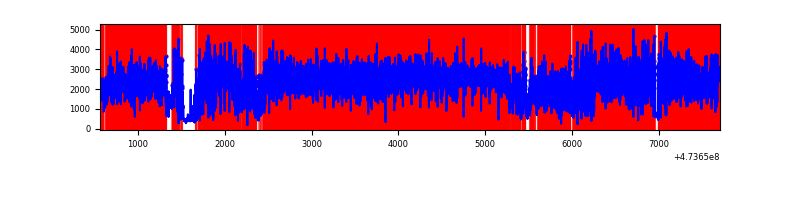 |
| B | 7142 | 7142 | 493 | 493 | 6.90% | 6.90% | 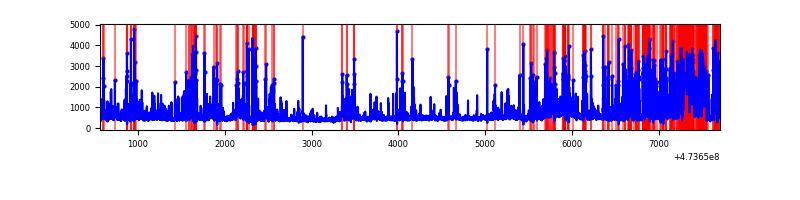 |
| C | 7141 | 7141 | 6334 | 6334 | 88.70% | 88.70% | 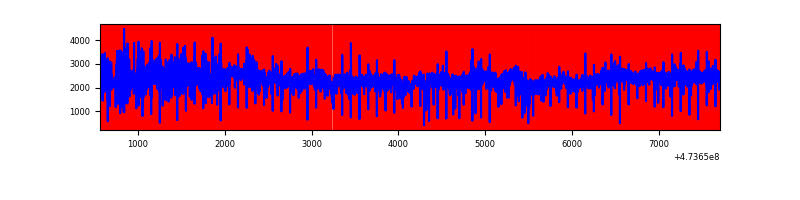 |
| D | 7140 | 7140 | 6244 | 6244 | 87.45% | 87.45% | 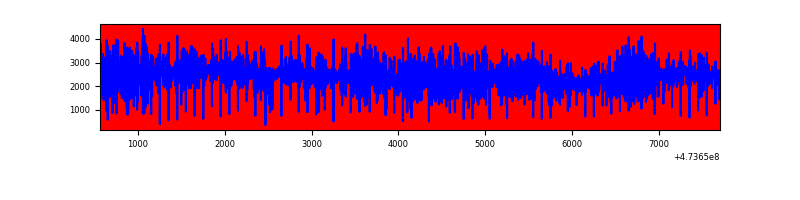 |
Top three noisy pixels from each quadrant. If the there are fewer than three noisy pixels in the level2.evt file, extra rows are filled as -1
| Pixel properties | Quadrant properties | ||||||
|---|---|---|---|---|---|---|---|
| Quadrant | DetID | PixID | Counts | Sigma | Mean | Median | Sigma |
| A | 0 | 98 | 12080928 | 96223.1 | 483 | 470 | 125.5 |
| A | 10 | 253 | 565632 | 4501.62 | 483 | 470 | 125.5 |
| A | 12 | 250 | 473567 | 3768.31 | 483 | 470 | 125.5 |
| B | 1 | 255 | 873869 | 5933.28 | 693 | 670 | 147.2 |
| B | 2 | 176 | 706931 | 4798.96 | 693 | 670 | 147.2 |
| B | 0 | 213 | 164240 | 1111.44 | 693 | 670 | 147.2 |
| C | 15 | 197 | 5972228 | 99324.19 | 180 | 177 | 60.1 |
| C | 4 | 111 | 2540897 | 42255.99 | 180 | 177 | 60.1 |
| C | 15 | 164 | 1388231 | 23085.43 | 180 | 177 | 60.1 |
| D | 7 | 61 | 5374335 | 61716.96 | 255 | 242 | 87.1 |
| D | 15 | 106 | 2328894 | 26742.62 | 255 | 242 | 87.1 |
| D | 15 | 58 | 1901858 | 21838.47 | 255 | 242 | 87.1 |
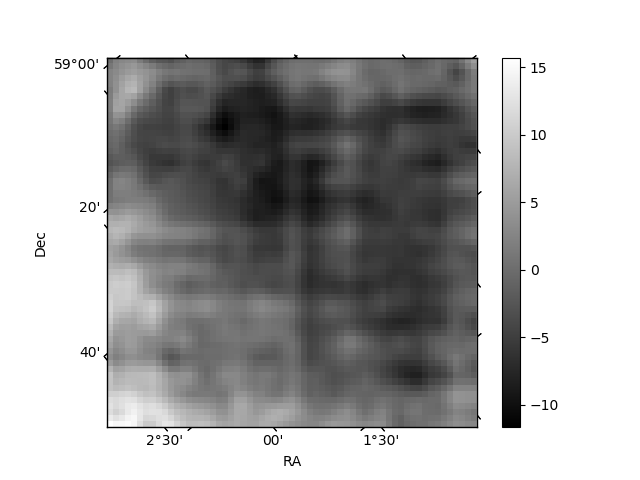
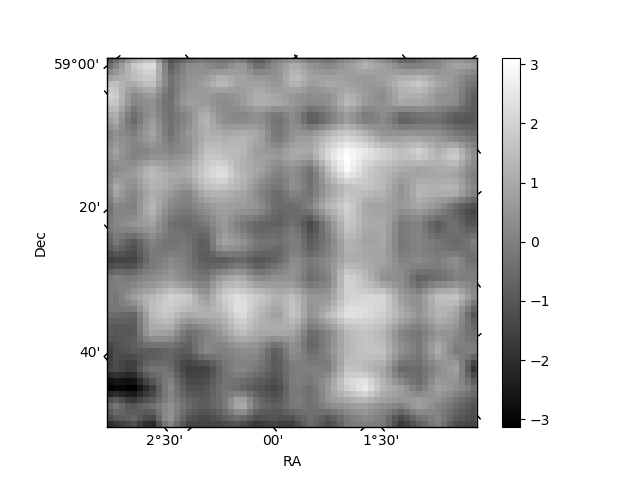
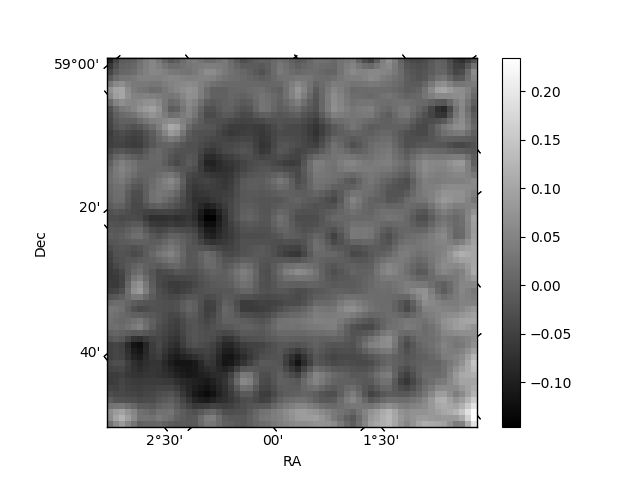
Histogram calculated using DETX and DETY for each event in the final _common_clean file
| Quadrant A | 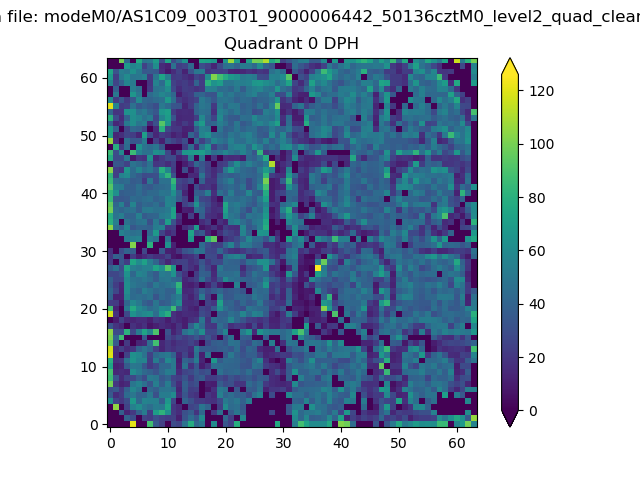 |
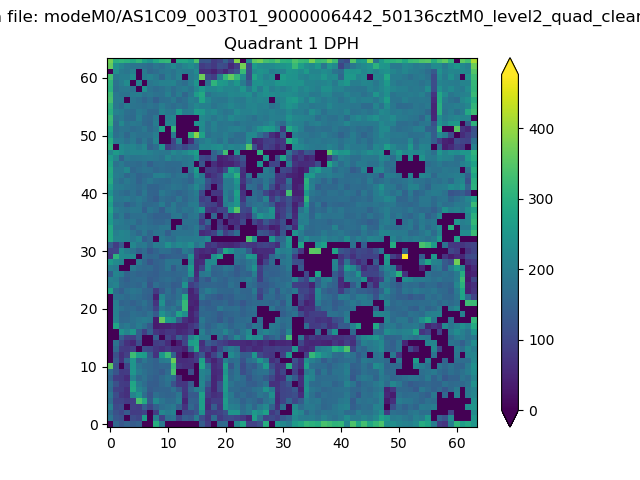 |
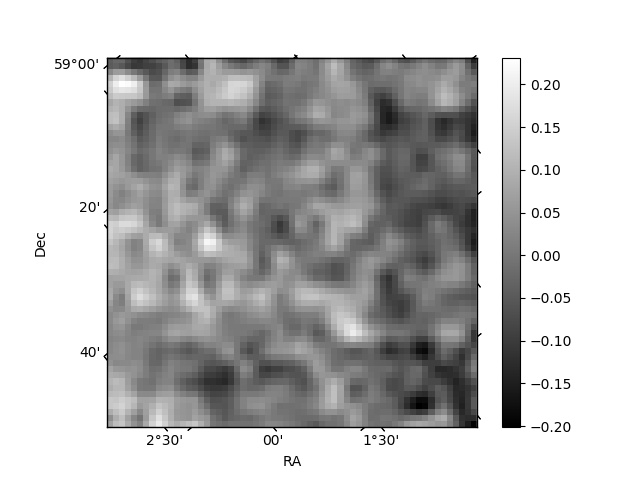
Quadrant B |
|---|---|---|---|
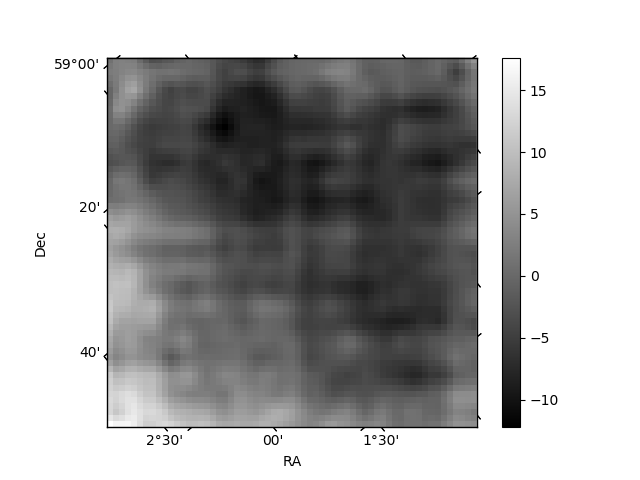
| Quadrant D | 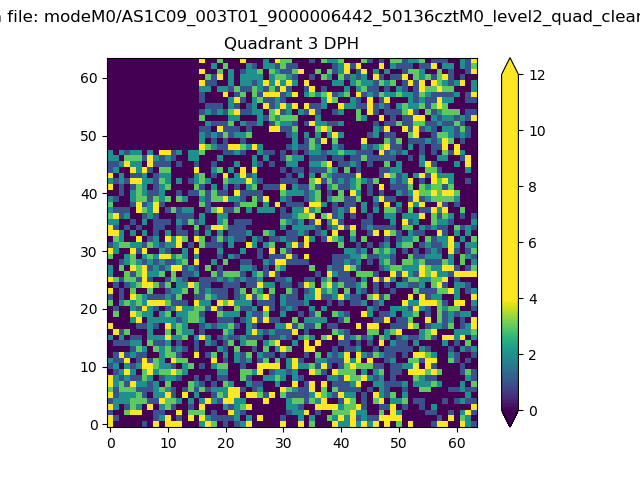 |
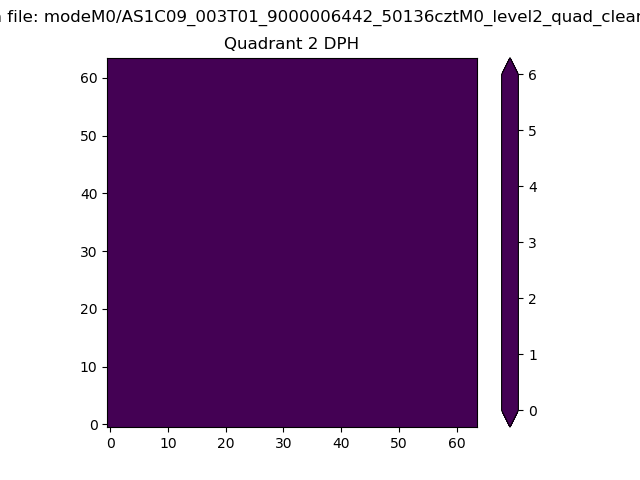 |
Quadrant C |
| Plot type | Count rate plots | Images |
|---|---|---|
| Comparison with Poisson distribution Blue bars denote a histogram of data divided into 1 sec bins. Red curve is a Poisson curve with rate = median count rate of data. |
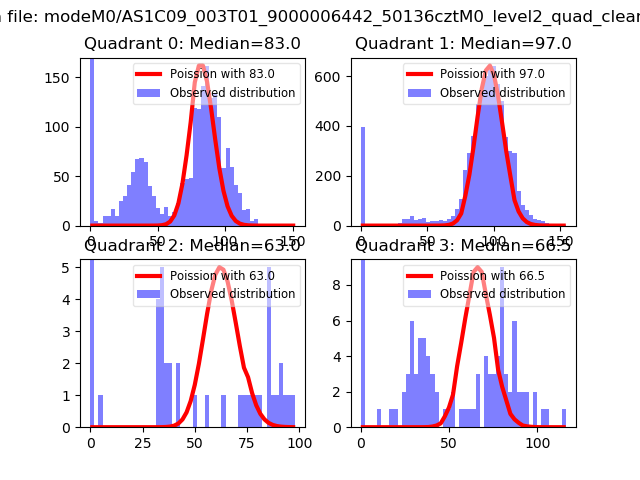 |
 |
| Quadrant-wise count rates Data is divided into 100 sec bins |
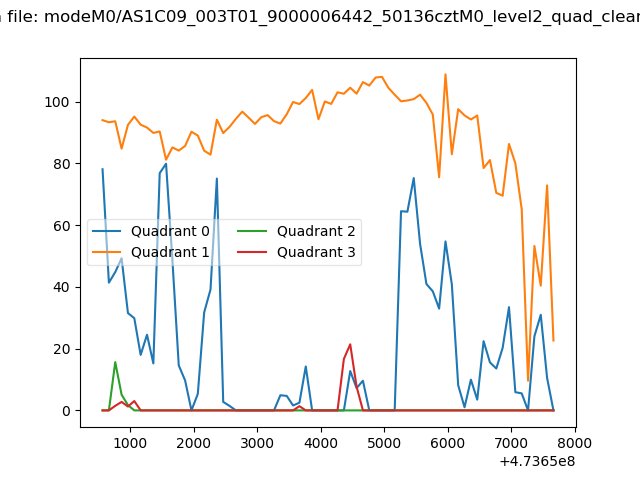 |
|
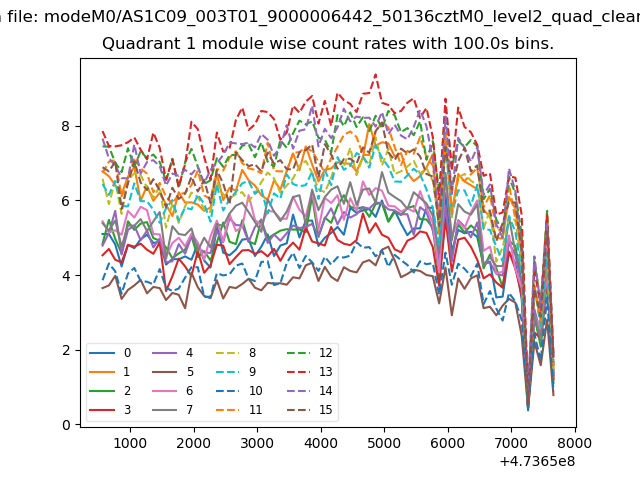
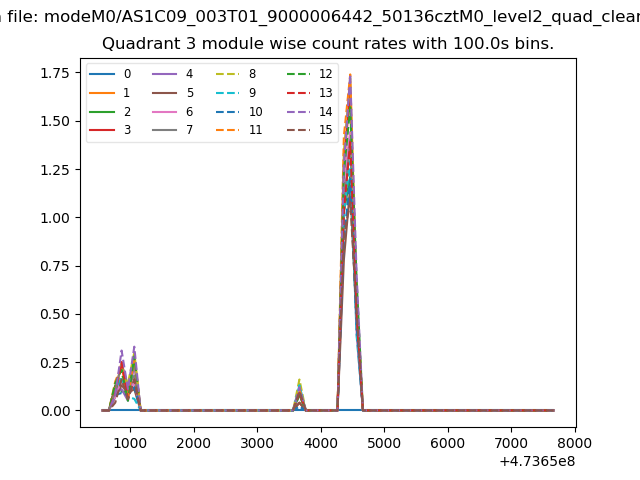
| Module-wise count rates for Quadrant A Data is divided into 100 sec bins |
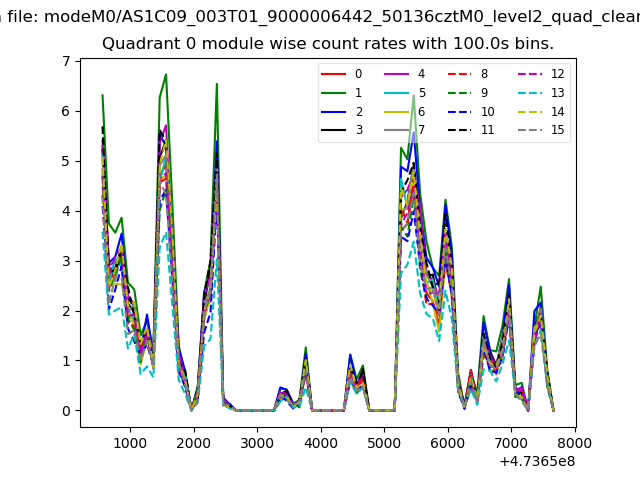 |
 |
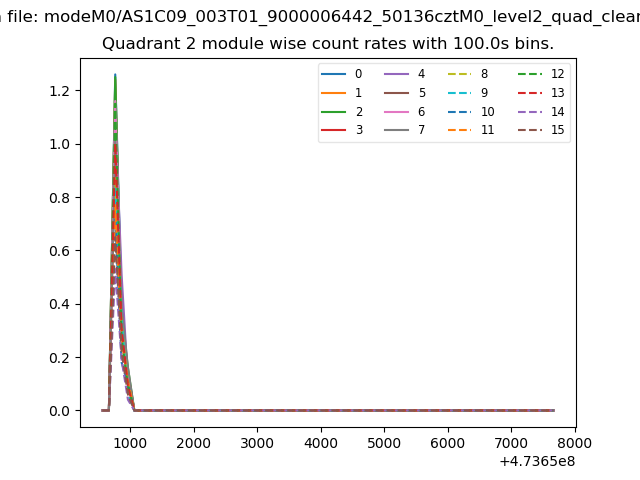
| Module-wise count rates for Quadrant B Data is divided into 100 sec bins |
 |
 |
| Module-wise count rates for Quadrant C Data is divided into 100 sec bins |
 |
 |
| Module-wise count rates for Quadrant D Data is divided into 100 sec bins |
 |
 |
| Parameter | Plot |
|---|---|
| CZT HV Monitor | 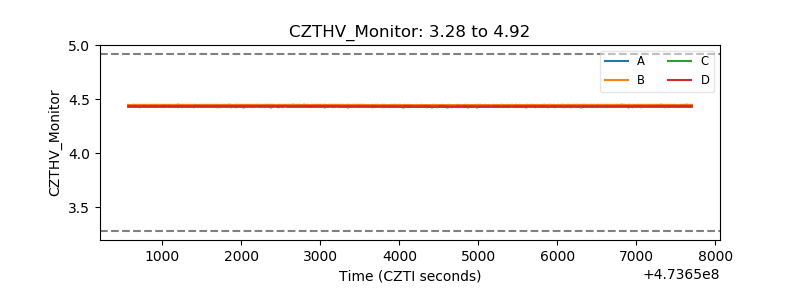 |
| D_VDD | 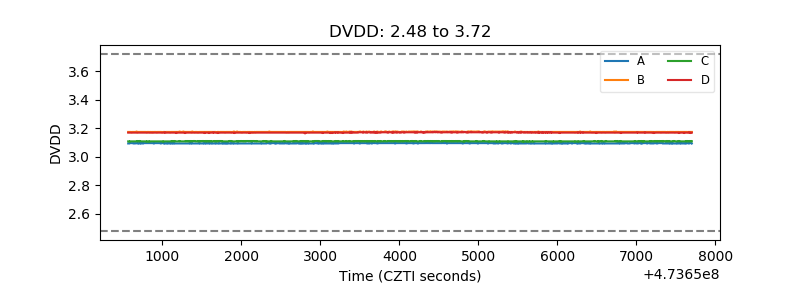 |
| Temperature 1 | 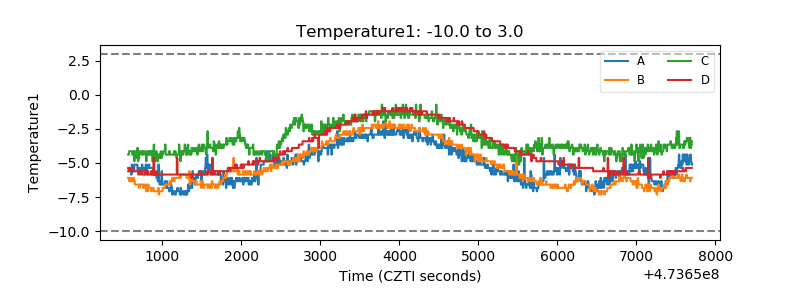 |
| Veto HV Monitor | 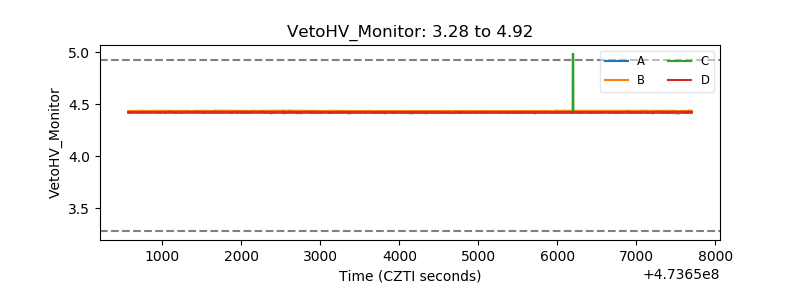 |
| Veto LLD | 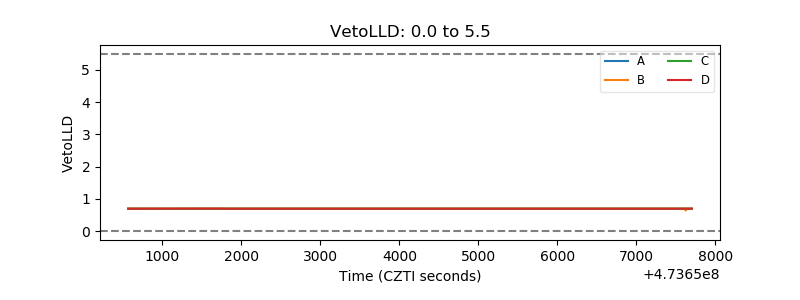 |
| Alpha Counter | 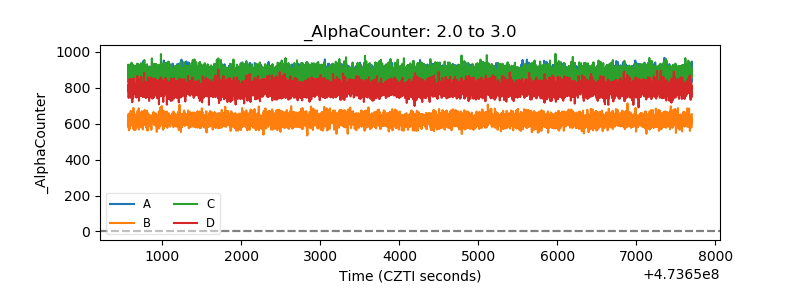 |
| _CPM_Rate | 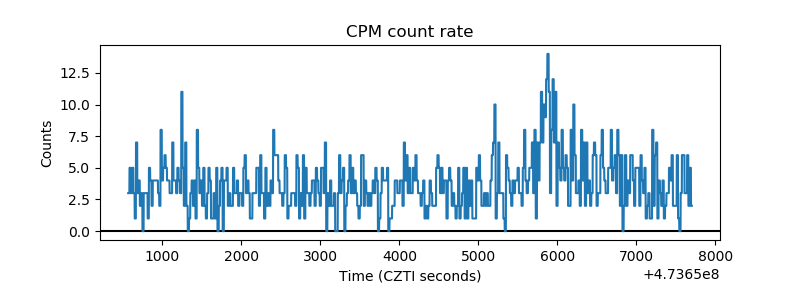 |
| CZT Counter | 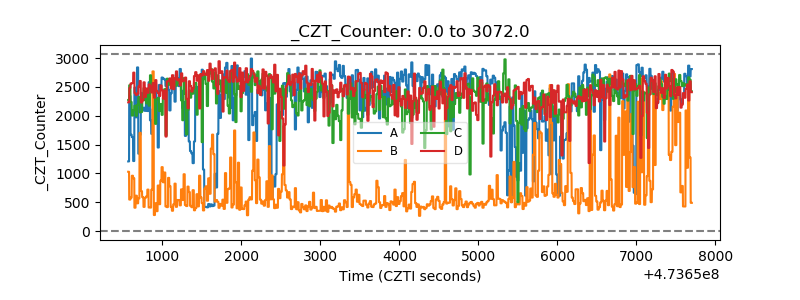 |
| +2.5 Volts monitor |  |
| +5 Volts monitor | 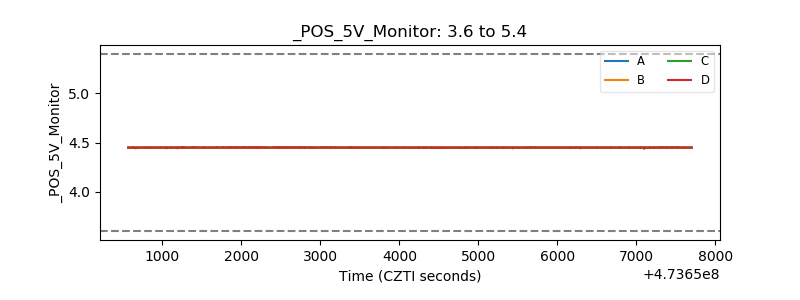 |
| _ROLL_ROT | 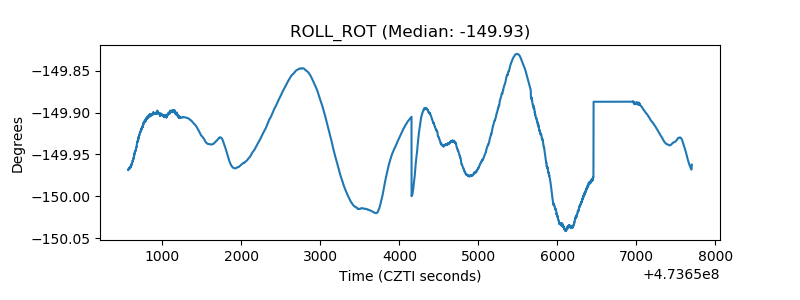 |
| _Roll_DEC | 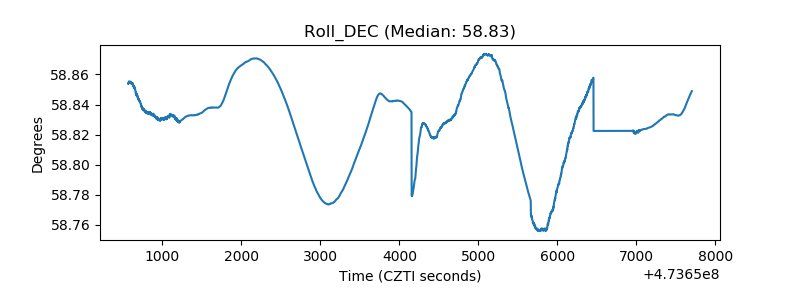 |
| _Roll_RA | 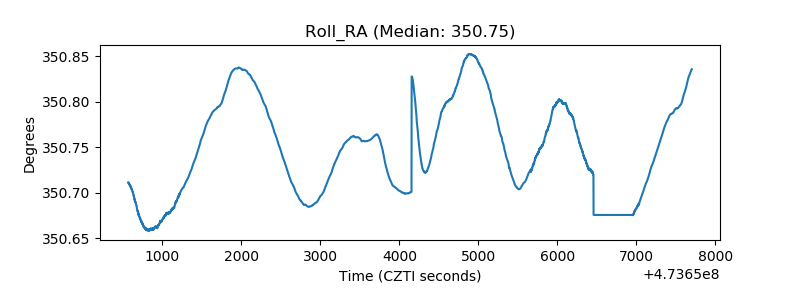 |
| Veto Counter | 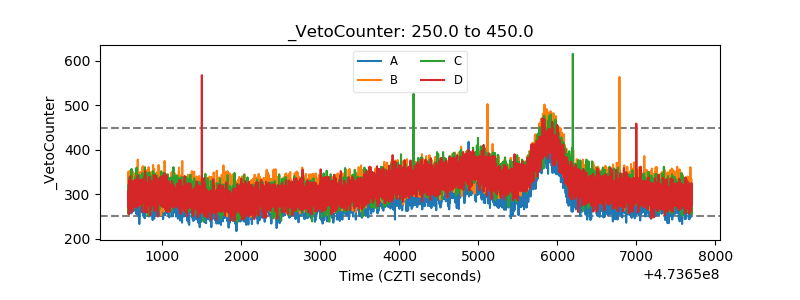 |