| Param | Original file | Final file |
|---|---|---|
| Filename | modeM0/AS1C09_003T01_9000006442_50139cztM0_level2.fits | modeM0/AS1C09_003T01_9000006442_50139cztM0_level2_quad_clean.evt |
| Size (bytes) | 3,317,137,920 | 154,831,680 |
| Size | 3.1 GB | 147.7 MB |
| Events in quadrant A | 30,341,042 | 918,822 |
| Events in quadrant B | 13,340,580 | 1,658,794 |
| Events in quadrant C | 40,947,414 | 261,084 |
| Events in quadrant D | 36,759,281 | 587,904 |
| Mode M9 | |||
|---|---|---|---|
| Quadrant | BADHDUFLAG | Total packets | Discarded packets |
| A | 0 | 11 | 0 |
| B | 0 | 11 | 0 |
| C | 0 | 11 | 0 |
| D | 0 | 11 | 0 |
| Mode M0 | |||
|---|---|---|---|
| Quadrant | BADHDUFLAG | Total packets | Discarded packets |
| A | 0 | 102722 | 4 |
| B | 0 | 52384 | 5 |
| C | 0 | 134087 | 4 |
| D | 0 | 121614 | 4 |
| Mode SS | |||
|---|---|---|---|
| Quadrant | BADHDUFLAG | Total packets | Discarded packets |
| A | 0 | 372 | 0 |
| B | 0 | 372 | 0 |
| C | 0 | 372 | 0 |
| D | 0 | 372 | 0 |
| Quadrant | Total seconds | Saturated seconds | Saturation percentage |
|---|---|---|---|
| A | 18274 | 8496 | 46.492284% |
| B | 18274 | 1620 | 8.865054% |
| C | 18274 | 15738 | 86.122360% |
| D | 18274 | 11598 | 63.467221% |
Noise dominated data is calculated using 1-second bins in cleaned event files. If a bin has >2000 counts, and if more than 50% of those come from <1% of pixels, then it is considered to be noise-dominated and hence unusable.
| Quadrant | # 1 sec bins | Bins with >0 counts | Bins with >2000 counts | High rate bins dominated by noise | Noise dominated (total time) | Noise dominated (detector-on time) | Marked lightcurve |
|---|---|---|---|---|---|---|---|
| A | 19479 | 18277 | 6568 | 6568 | 33.72% | 35.94% | 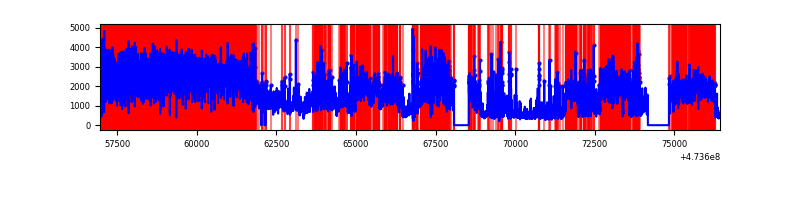 |
| B | 19479 | 18278 | 1002 | 1002 | 5.14% | 5.48% | 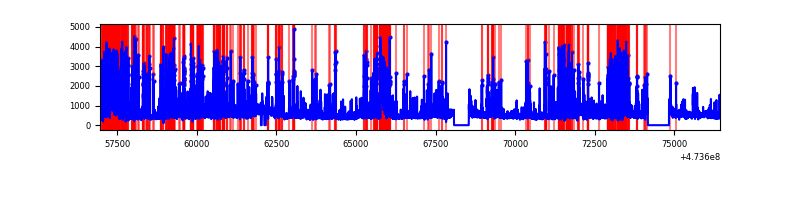 |
| C | 19478 | 18274 | 13599 | 13599 | 69.82% | 74.42% | 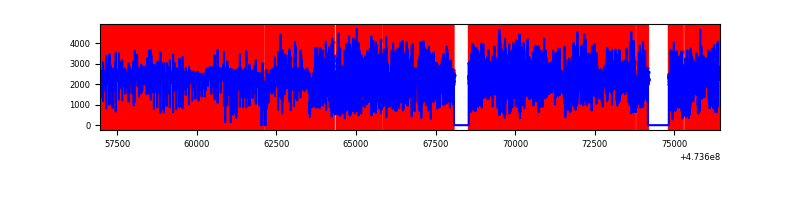 |
| D | 19479 | 18276 | 10315 | 10315 | 52.95% | 56.44% | 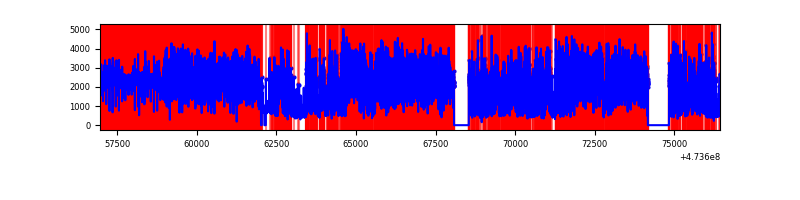 |
Top three noisy pixels from each quadrant. If the there are fewer than three noisy pixels in the level2.evt file, extra rows are filled as -1
| Pixel properties | Quadrant properties | ||||||
|---|---|---|---|---|---|---|---|
| Quadrant | DetID | PixID | Counts | Sigma | Mean | Median | Sigma |
| A | 0 | 98 | 9175445 | 22967.46 | 1583 | 1539 | 399.4 |
| A | 8 | 8 | 6498432 | 16265.39 | 1583 | 1539 | 399.4 |
| A | 6 | 250 | 4955818 | 12403.36 | 1583 | 1539 | 399.4 |
| B | 1 | 255 | 2228490 | 5759.18 | 1831 | 1767 | 386.6 |
| B | 2 | 176 | 610785 | 1575.16 | 1831 | 1767 | 386.6 |
| B | 10 | 246 | 459693 | 1184.38 | 1831 | 1767 | 386.6 |
| C | 4 | 111 | 14511866 | 62826.26 | 780 | 773 | 231.0 |
| C | 15 | 197 | 4559569 | 19737.46 | 780 | 773 | 231.0 |
| C | 15 | 230 | 3394889 | 14694.94 | 780 | 773 | 231.0 |
| D | 15 | 168 | 9151888 | 24639.84 | 1276 | 1234 | 371.4 |
| D | 7 | 61 | 4550018 | 12248.45 | 1276 | 1234 | 371.4 |
| D | 15 | 106 | 2732662 | 7354.88 | 1276 | 1234 | 371.4 |
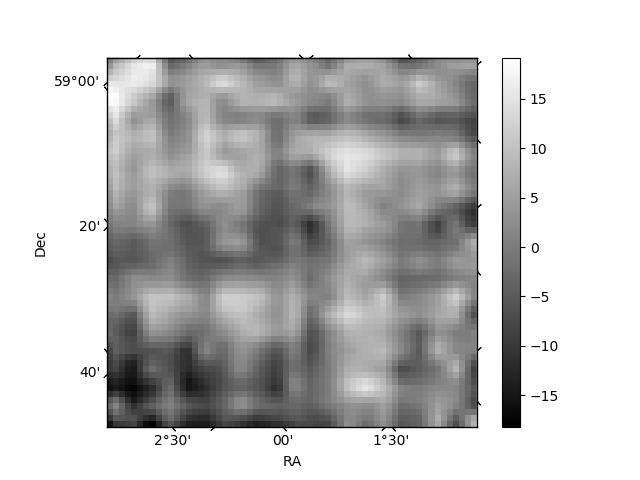
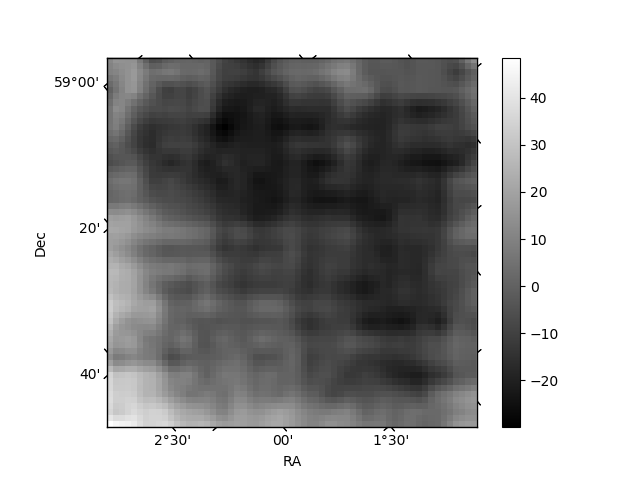
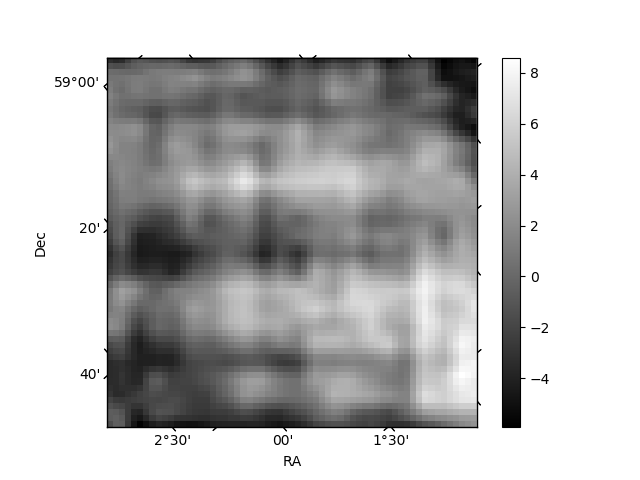
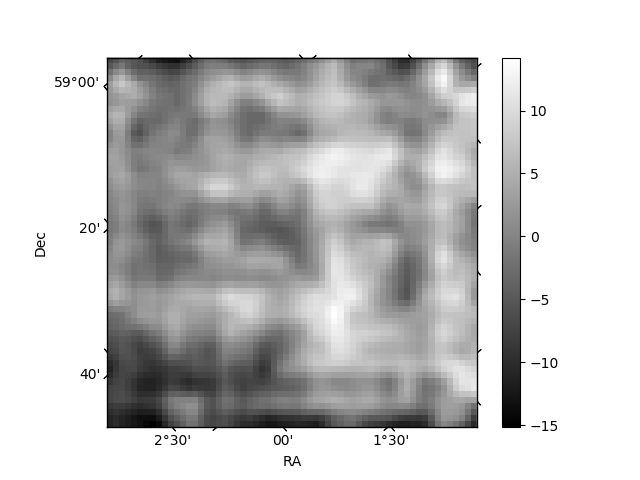
Histogram calculated using DETX and DETY for each event in the final _common_clean file
| Quadrant A | 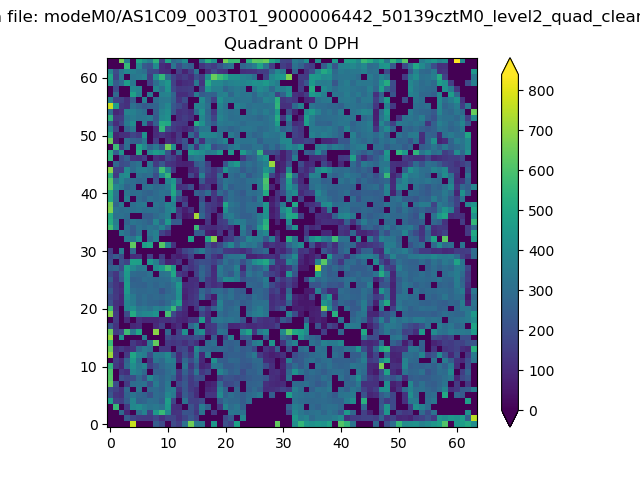 |
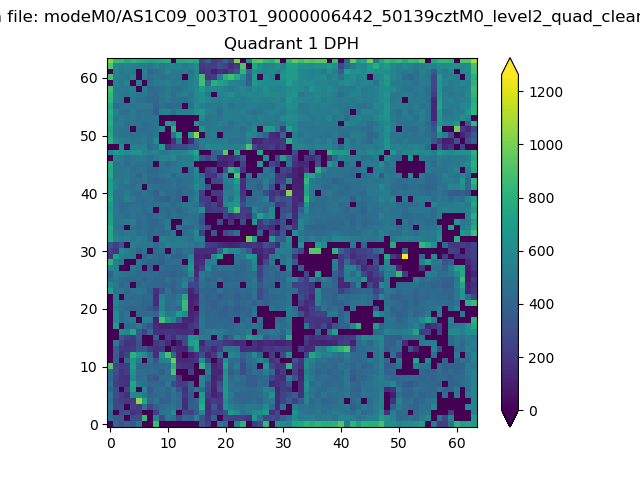 |
Quadrant B |
|---|---|---|---|
| Quadrant D | 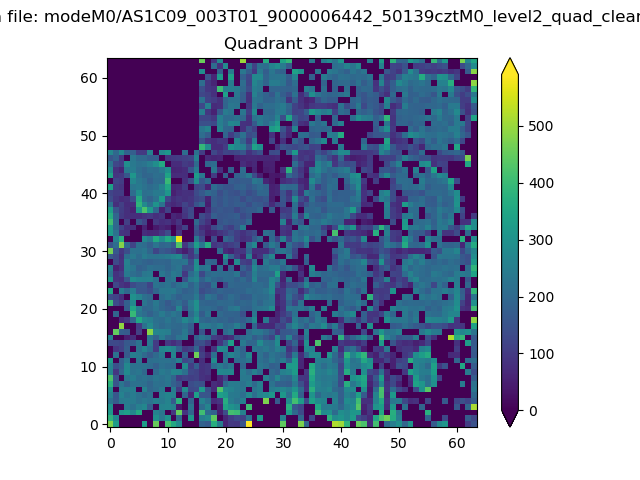 |
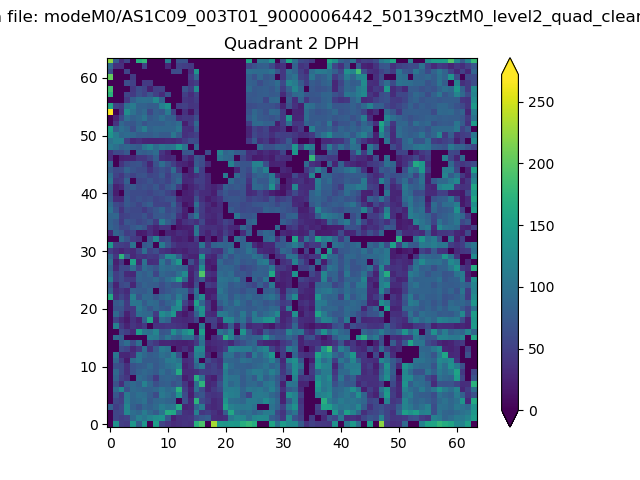 |
Quadrant C |
| Plot type | Count rate plots | Images |
|---|---|---|
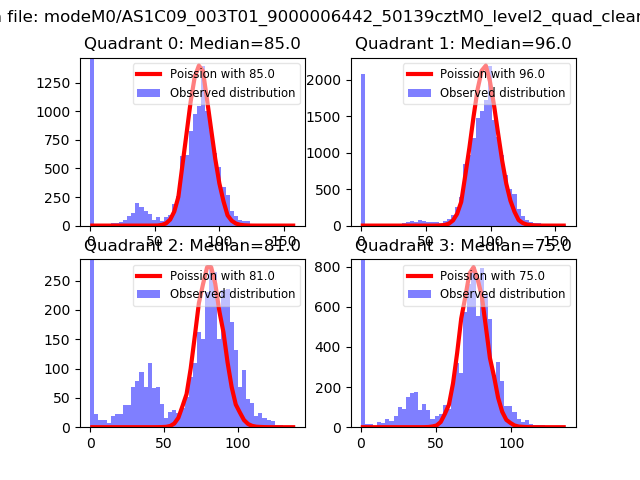
| Comparison with Poisson distribution Blue bars denote a histogram of data divided into 1 sec bins. Red curve is a Poisson curve with rate = median count rate of data. |
 |
 |
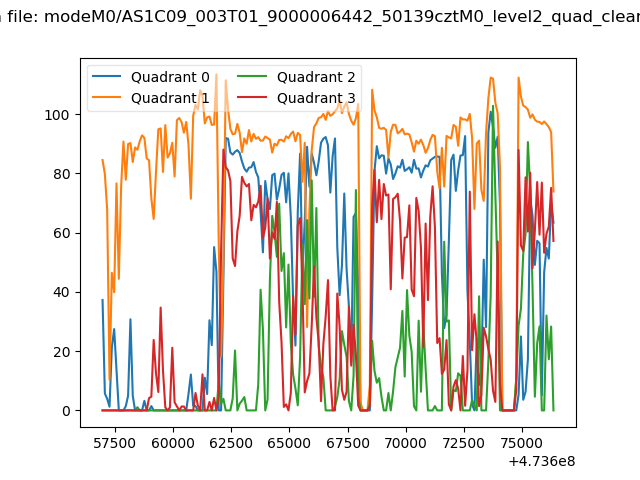
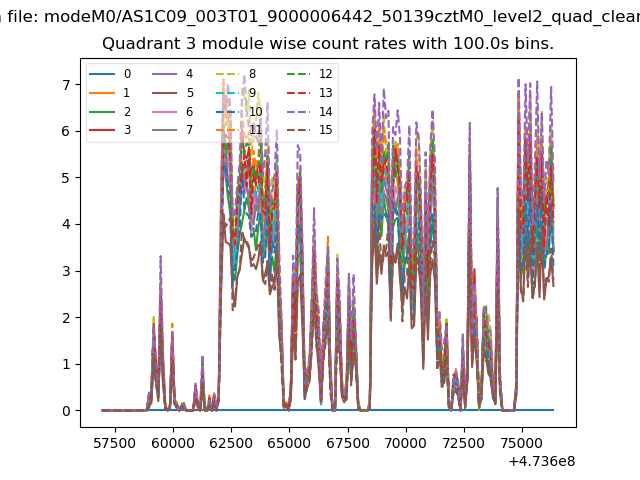
| Quadrant-wise count rates Data is divided into 100 sec bins |
 |
|
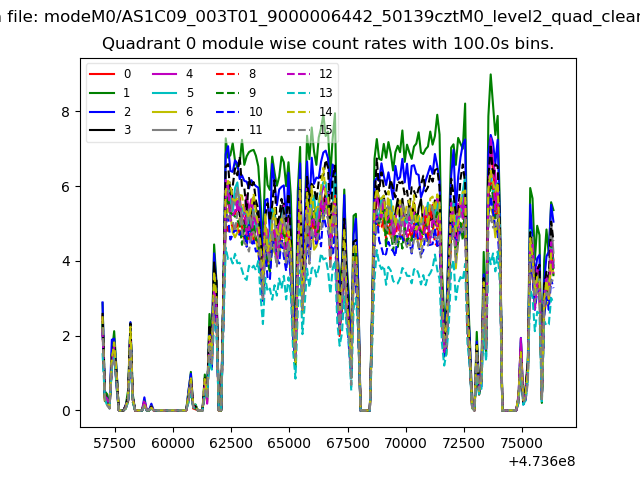
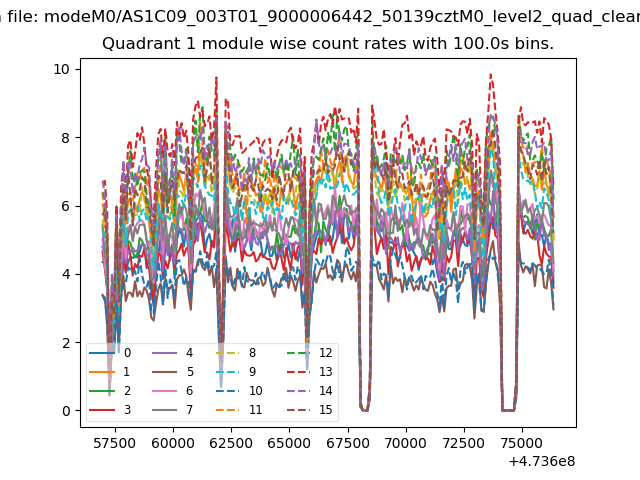
| Module-wise count rates for Quadrant A Data is divided into 100 sec bins |
 |
 |
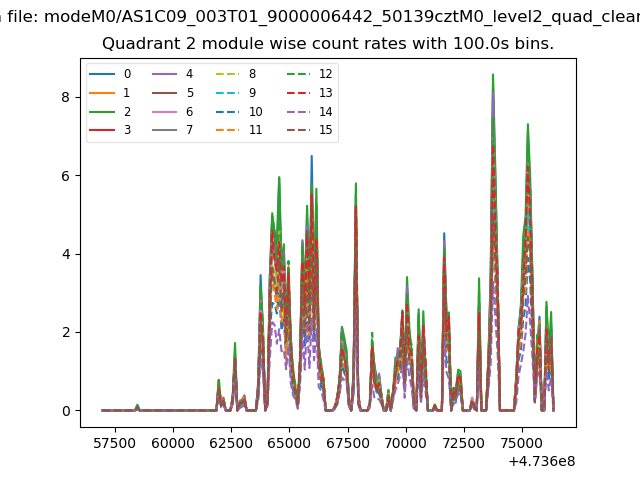
| Module-wise count rates for Quadrant B Data is divided into 100 sec bins |
 |
 |
| Module-wise count rates for Quadrant C Data is divided into 100 sec bins |
 |
 |
| Module-wise count rates for Quadrant D Data is divided into 100 sec bins |
 |
 |
| Parameter | Plot |
|---|---|
| CZT HV Monitor |  |
| D_VDD | 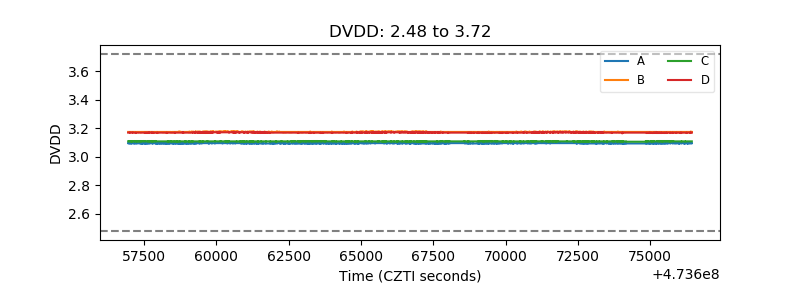 |
| Temperature 1 | 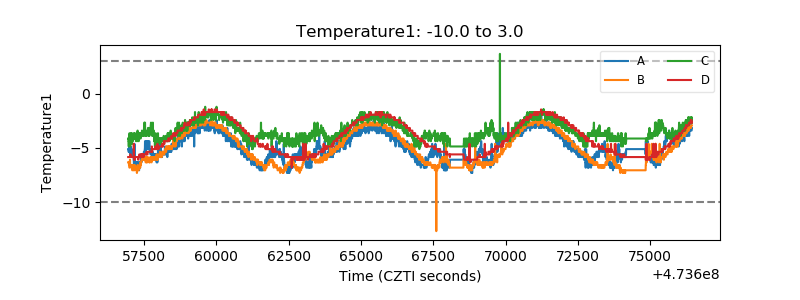 |
| Veto HV Monitor | 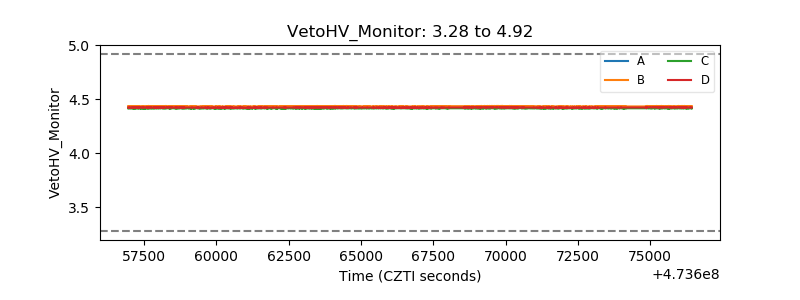 |
| Veto LLD | 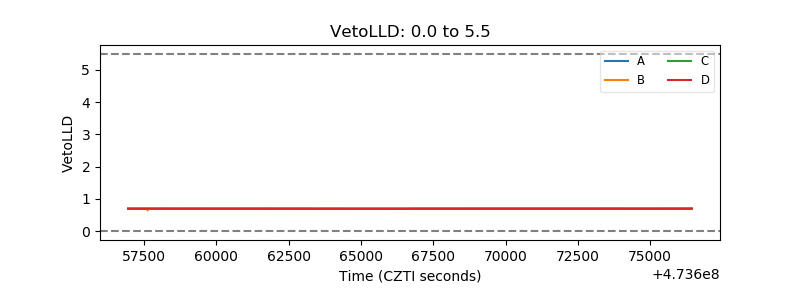 |
| Alpha Counter | 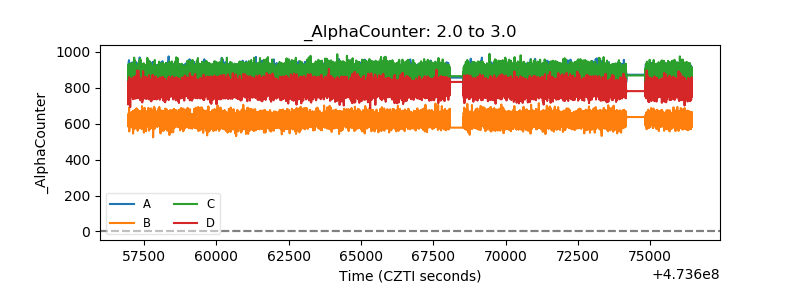 |
| _CPM_Rate | 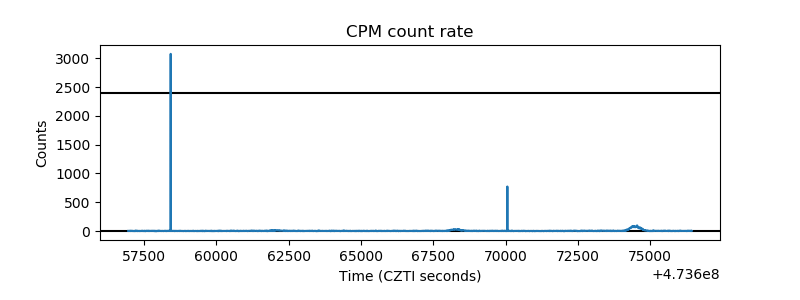 |
| CZT Counter | 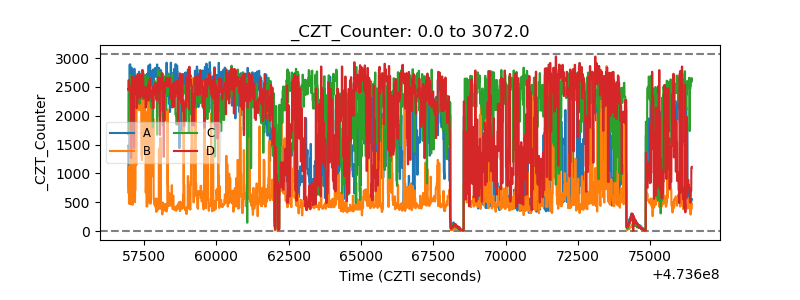 |
| +2.5 Volts monitor |  |
| +5 Volts monitor | 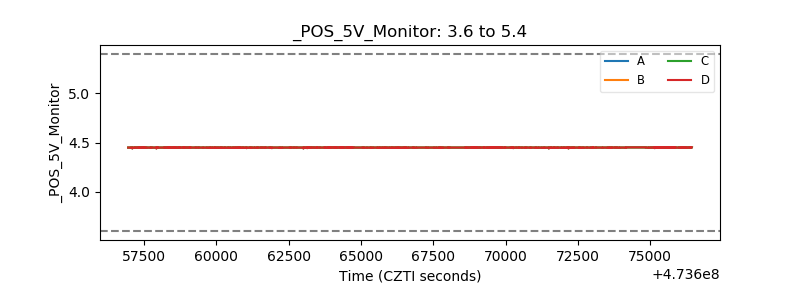 |
| _ROLL_ROT | 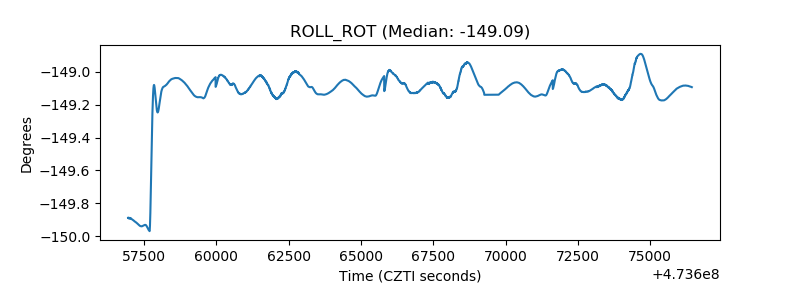 |
| _Roll_DEC | 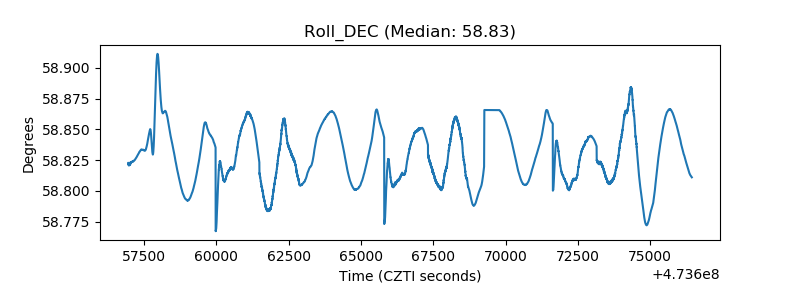 |
| _Roll_RA | 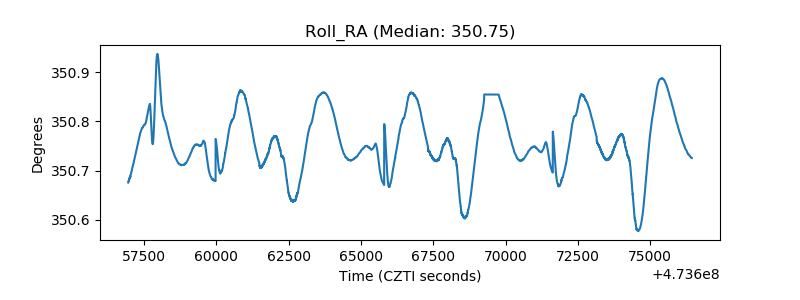 |
| Veto Counter | 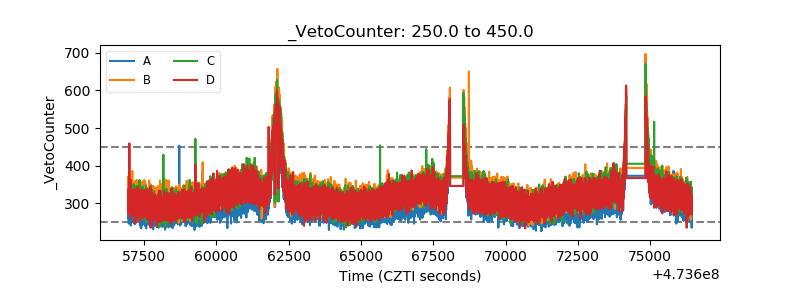 |