| Param | Original file | Final file |
|---|---|---|
| Filename | modeM0/AS1C09_003T01_9000006442_50140cztM0_level2.fits | modeM0/AS1C09_003T01_9000006442_50140cztM0_level2_quad_clean.evt |
| Size (bytes) | 907,030,080 | 67,829,760 |
| Size | 865.0 MB | 64.7 MB |
| Events in quadrant A | 6,754,077 | 535,150 |
| Events in quadrant B | 3,554,416 | 649,431 |
| Events in quadrant C | 13,266,314 | 34,135 |
| Events in quadrant D | 9,502,093 | 385,815 |
| Mode M9 | |||
|---|---|---|---|
| Quadrant | BADHDUFLAG | Total packets | Discarded packets |
| A | 0 | 8 | 0 |
| B | 0 | 8 | 0 |
| C | 0 | 8 | 0 |
| D | 0 | 8 | 0 |
| Mode M0 | |||
|---|---|---|---|
| Quadrant | BADHDUFLAG | Total packets | Discarded packets |
| A | 0 | 24455 | 1 |
| B | 0 | 14896 | 1 |
| C | 0 | 43800 | 1 |
| D | 0 | 32738 | 1 |
| Mode SS | |||
|---|---|---|---|
| Quadrant | BADHDUFLAG | Total packets | Discarded packets |
| A | 0 | 132 | 0 |
| B | 0 | 132 | 0 |
| C | 0 | 132 | 0 |
| D | 0 | 132 | 0 |
| Quadrant | Total seconds | Saturated seconds | Saturation percentage |
|---|---|---|---|
| A | 6430 | 1022 | 15.894246% |
| B | 6430 | 99 | 1.539658% |
| C | 6430 | 6102 | 94.898911% |
| D | 6431 | 2046 | 31.814648% |
Noise dominated data is calculated using 1-second bins in cleaned event files. If a bin has >2000 counts, and if more than 50% of those come from <1% of pixels, then it is considered to be noise-dominated and hence unusable.
| Quadrant | # 1 sec bins | Bins with >0 counts | Bins with >2000 counts | High rate bins dominated by noise | Noise dominated (total time) | Noise dominated (detector-on time) | Marked lightcurve |
|---|---|---|---|---|---|---|---|
| A | 7245 | 6430 | 626 | 626 | 8.64% | 9.74% | 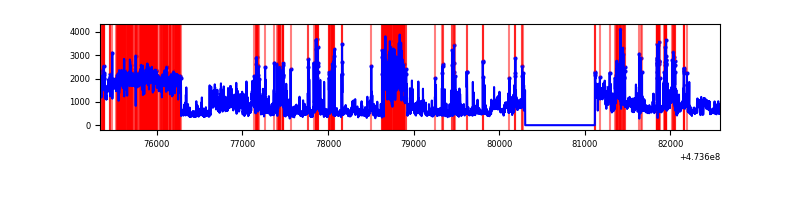 |
| B | 7245 | 6431 | 23 | 23 | 0.32% | 0.36% | 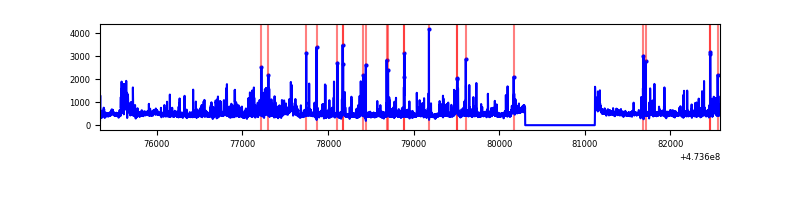 |
| C | 7244 | 6429 | 3650 | 3650 | 50.39% | 56.77% | 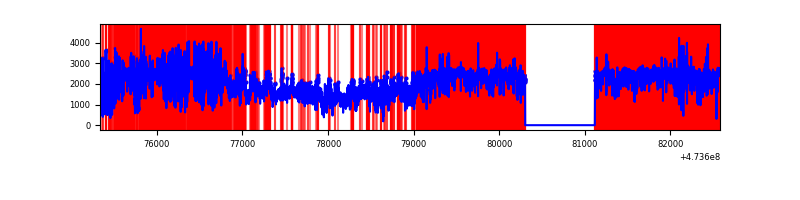 |
| D | 7246 | 6431 | 1844 | 1844 | 25.45% | 28.67% | 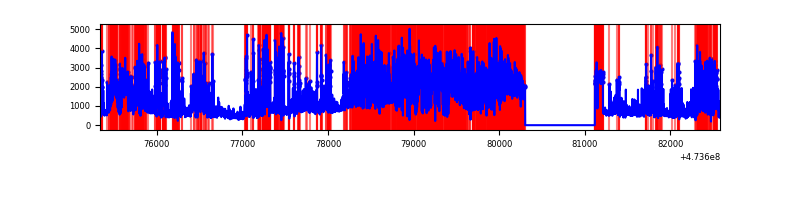 |
Top three noisy pixels from each quadrant. If the there are fewer than three noisy pixels in the level2.evt file, extra rows are filled as -1
| Pixel properties | Quadrant properties | ||||||
|---|---|---|---|---|---|---|---|
| Quadrant | DetID | PixID | Counts | Sigma | Mean | Median | Sigma |
| A | 8 | 8 | 1363024 | 8294.07 | 648 | 630 | 164.3 |
| A | 10 | 253 | 778754 | 4737.12 | 648 | 630 | 164.3 |
| A | 6 | 250 | 759251 | 4618.38 | 648 | 630 | 164.3 |
| B | 0 | 229 | 108569 | 760.33 | 663 | 642 | 141.9 |
| B | 4 | 206 | 107299 | 751.38 | 663 | 642 | 141.9 |
| B | 10 | 16 | 88801 | 621.07 | 663 | 642 | 141.9 |
| C | 4 | 111 | 5690806 | 125628.48 | 149 | 148 | 45.3 |
| C | 15 | 214 | 4313073 | 95213.28 | 149 | 148 | 45.3 |
| C | 15 | 230 | 792396 | 17489.88 | 149 | 148 | 45.3 |
| D | 15 | 168 | 1759633 | 10827.54 | 562 | 543 | 162.5 |
| D | 15 | 106 | 862905 | 5308.01 | 562 | 543 | 162.5 |
| D | 14 | 66 | 633993 | 3899.01 | 562 | 543 | 162.5 |
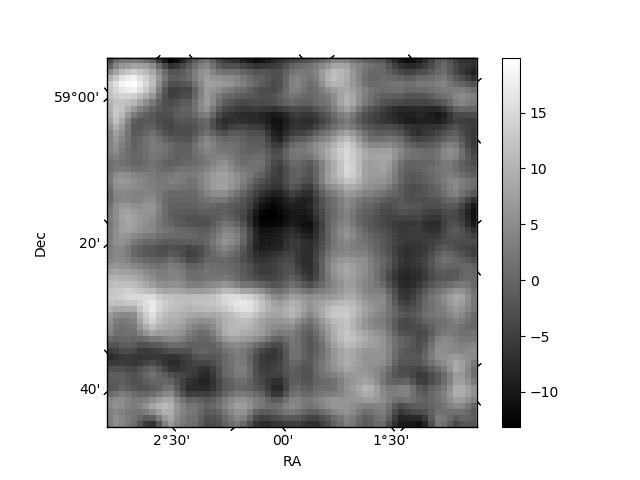
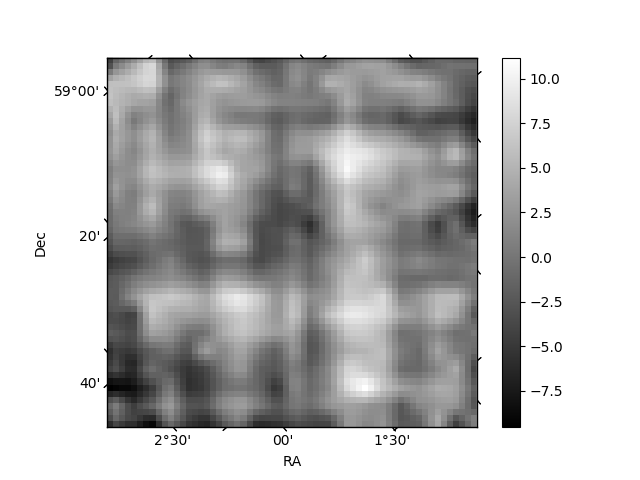
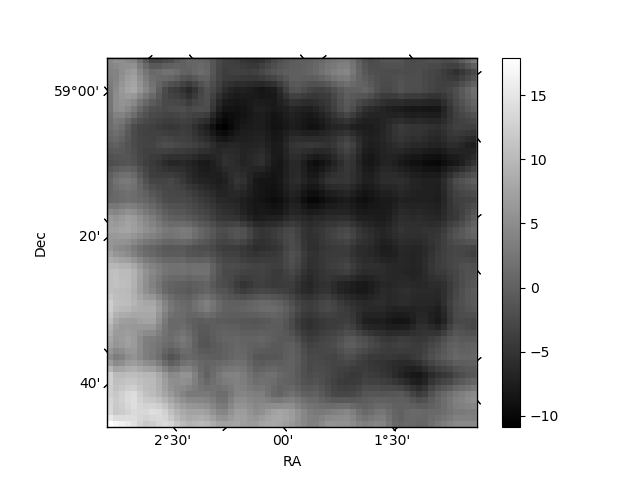
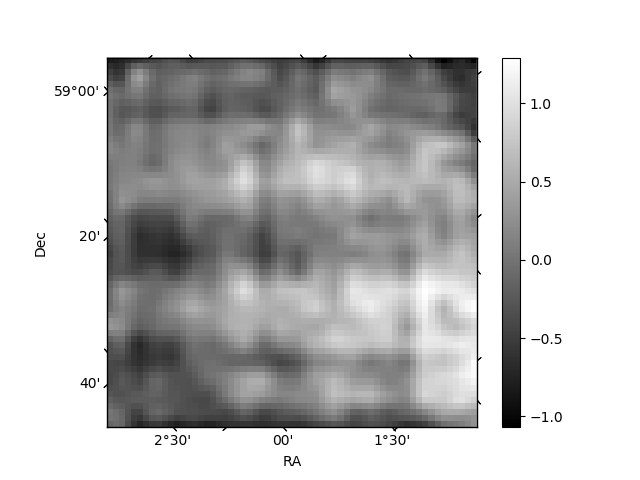
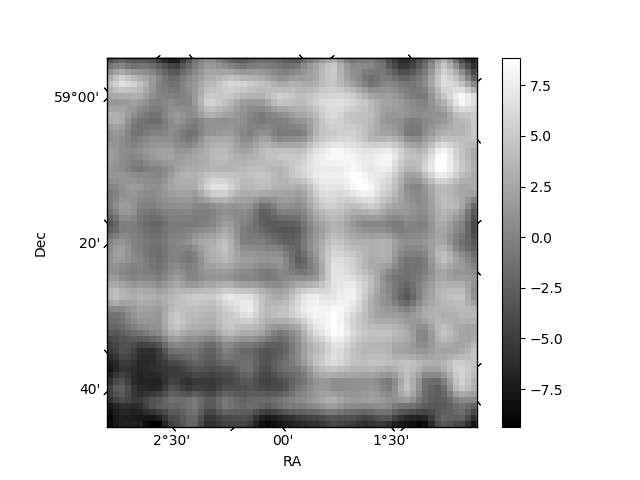
Histogram calculated using DETX and DETY for each event in the final _common_clean file
| Quadrant A | 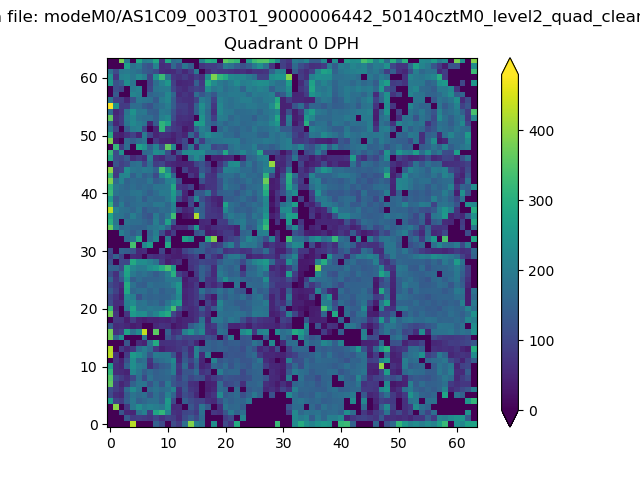 |
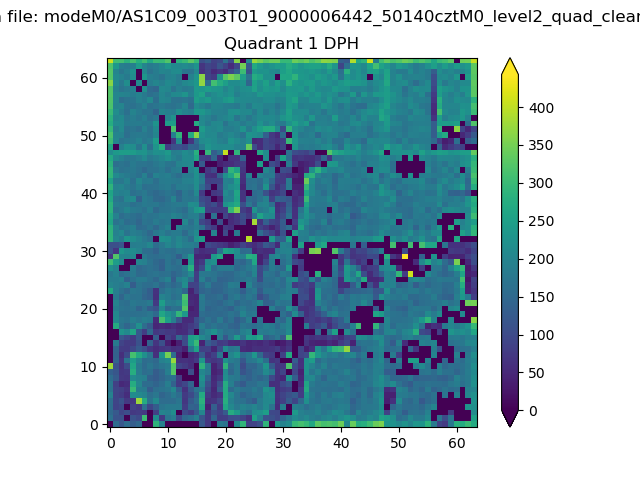 |
Quadrant B |
|---|---|---|---|
| Quadrant D | 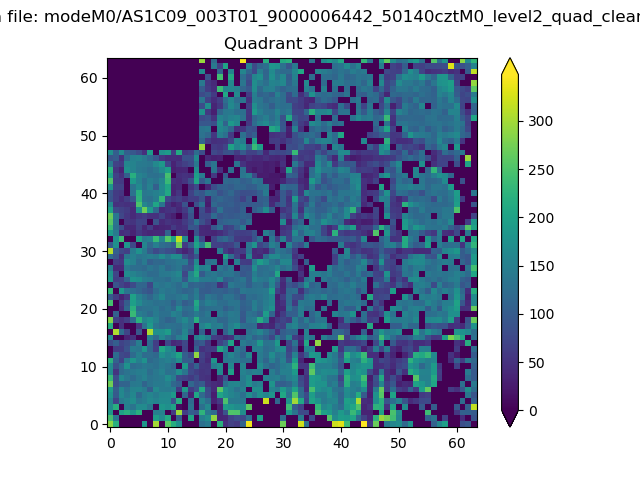 |
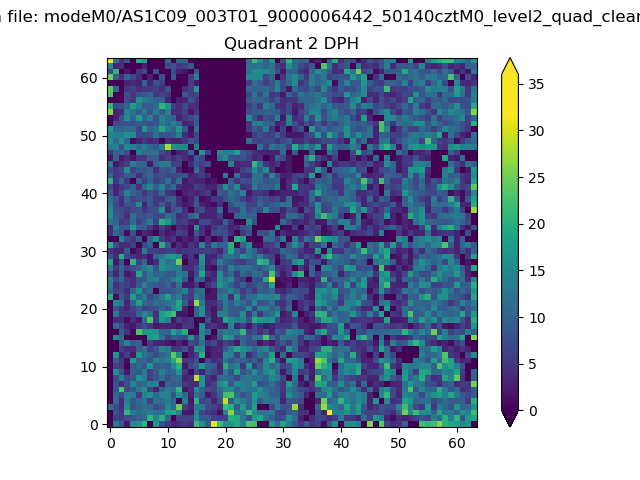 |
Quadrant C |
| Plot type | Count rate plots | Images |
|---|---|---|
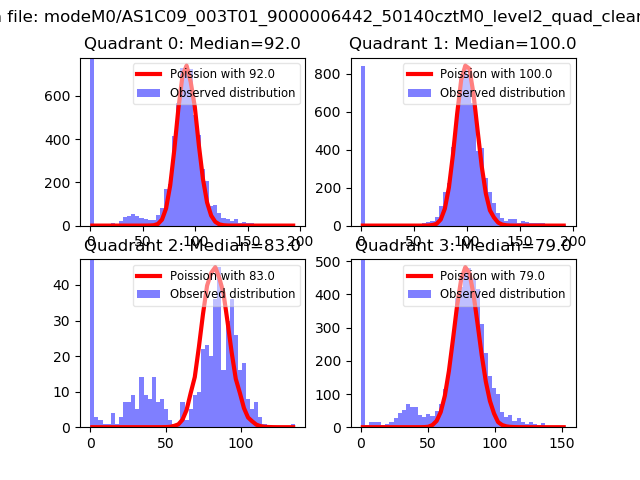
| Comparison with Poisson distribution Blue bars denote a histogram of data divided into 1 sec bins. Red curve is a Poisson curve with rate = median count rate of data. |
 |
 |
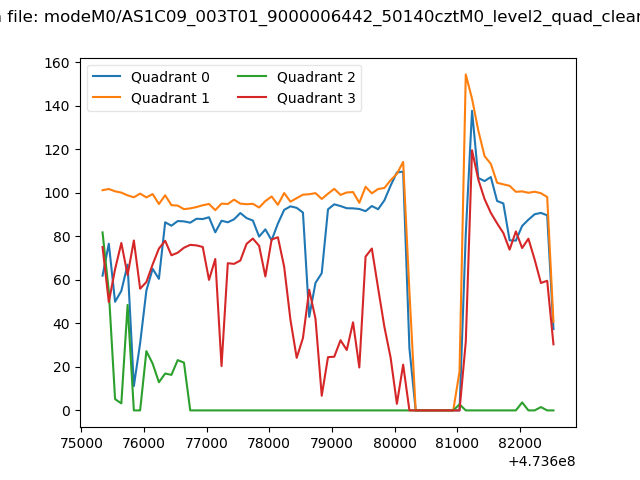
| Quadrant-wise count rates Data is divided into 100 sec bins |
 |
|
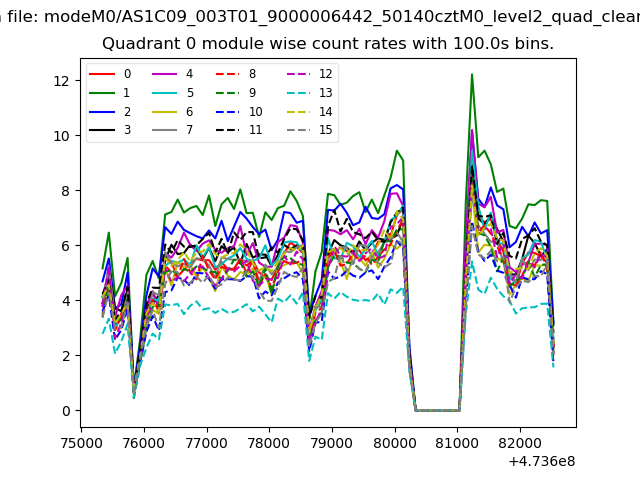
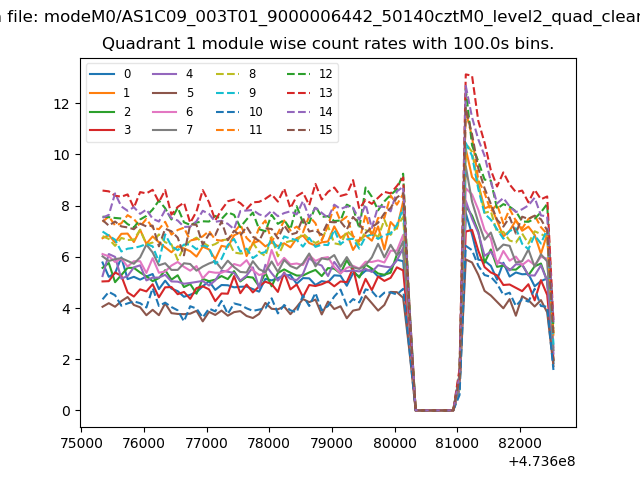
| Module-wise count rates for Quadrant A Data is divided into 100 sec bins |
 |
 |
| Module-wise count rates for Quadrant B Data is divided into 100 sec bins |
 |
 |
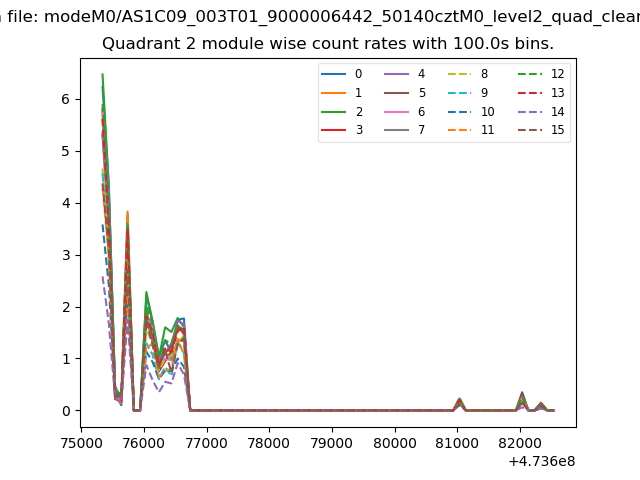
| Module-wise count rates for Quadrant C Data is divided into 100 sec bins |
 |
 |
| Module-wise count rates for Quadrant D Data is divided into 100 sec bins |
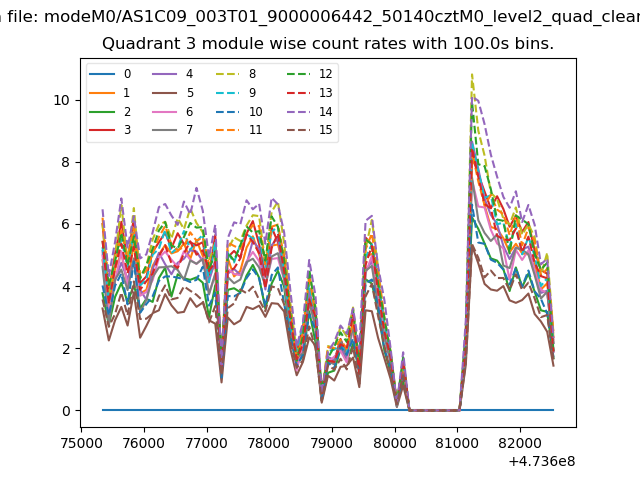 |
 |
| Parameter | Plot |
|---|---|
| CZT HV Monitor | 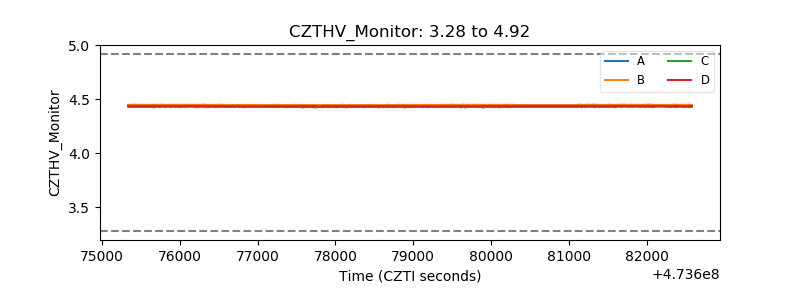 |
| D_VDD | 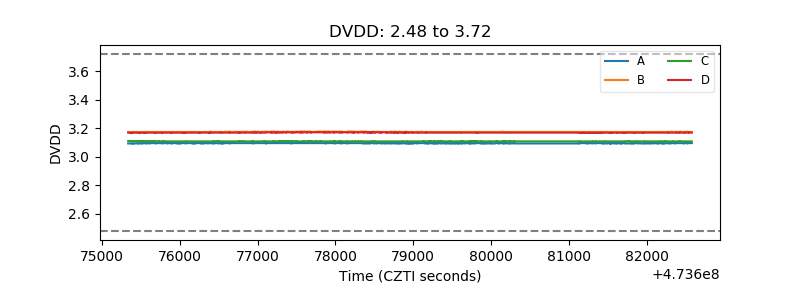 |
| Temperature 1 | 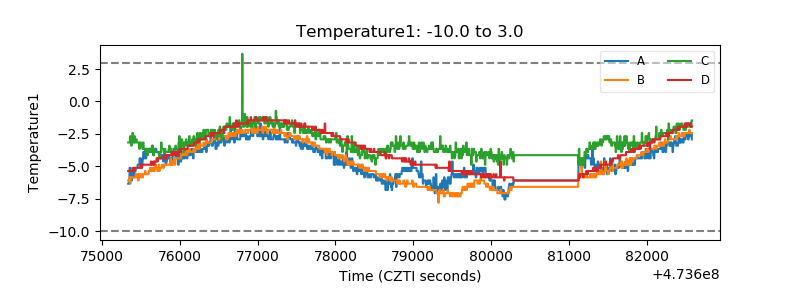 |
| Veto HV Monitor | 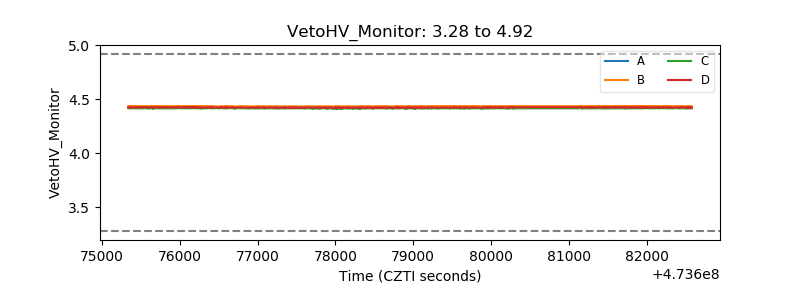 |
| Veto LLD | 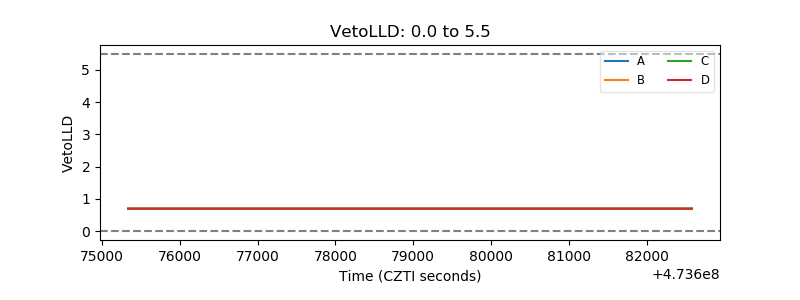 |
| Alpha Counter | 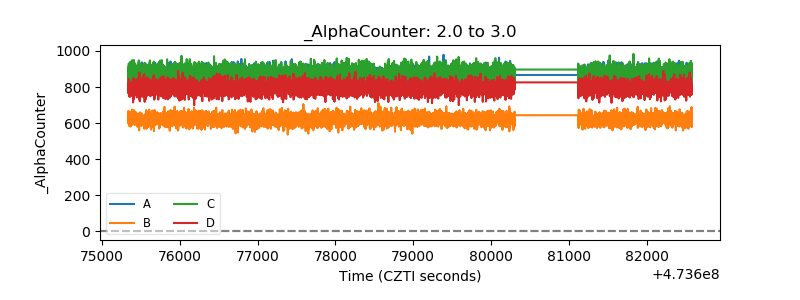 |
| _CPM_Rate | 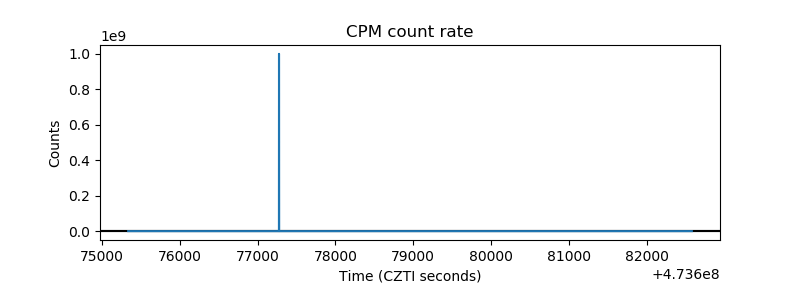 |
| CZT Counter | 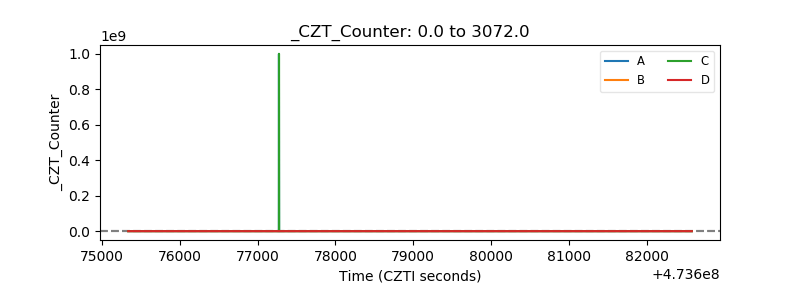 |
| +2.5 Volts monitor |  |
| +5 Volts monitor |  |
| _ROLL_ROT | 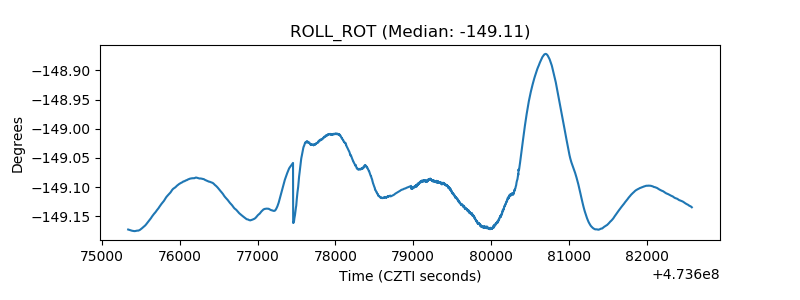 |
| _Roll_DEC | 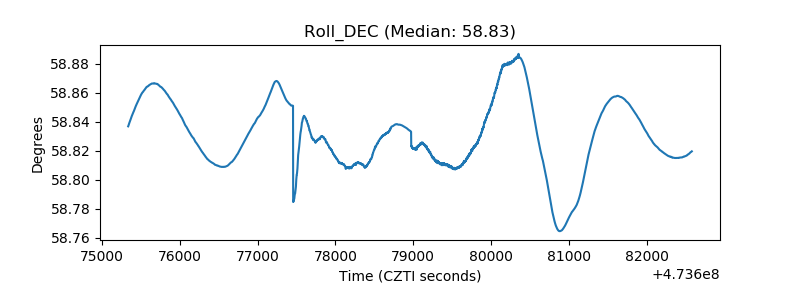 |
| _Roll_RA | 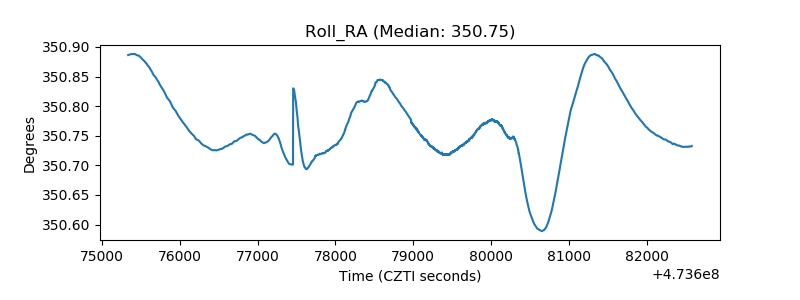 |
| Veto Counter | 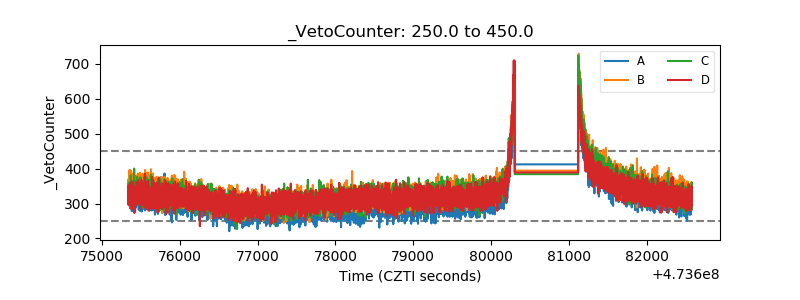 |