| Param | Original file | Final file |
|---|---|---|
| Filename | modeM0/AS1C09_003T01_9000006442_50142cztM0_level2.fits | modeM0/AS1C09_003T01_9000006442_50142cztM0_level2_quad_clean.evt |
| Size (bytes) | 962,421,120 | 68,279,040 |
| Size | 917.8 MB | 65.1 MB |
| Events in quadrant A | 6,043,387 | 562,695 |
| Events in quadrant B | 3,989,053 | 646,917 |
| Events in quadrant C | 14,707,926 | 50,030 |
| Events in quadrant D | 10,391,208 | 362,021 |
| Mode M9 | |||
|---|---|---|---|
| Quadrant | BADHDUFLAG | Total packets | Discarded packets |
| A | 0 | 10 | 0 |
| B | 0 | 10 | 0 |
| C | 0 | 10 | 0 |
| D | 0 | 10 | 0 |
| Mode M0 | |||
|---|---|---|---|
| Quadrant | BADHDUFLAG | Total packets | Discarded packets |
| A | 0 | 22498 | 1 |
| B | 0 | 16222 | 1 |
| C | 0 | 48053 | 1 |
| D | 0 | 35257 | 1 |
| Mode SS | |||
|---|---|---|---|
| Quadrant | BADHDUFLAG | Total packets | Discarded packets |
| A | 0 | 128 | 0 |
| B | 0 | 128 | 0 |
| C | 0 | 128 | 0 |
| D | 0 | 128 | 0 |
| Quadrant | Total seconds | Saturated seconds | Saturation percentage |
|---|---|---|---|
| A | 6390 | 668 | 10.453834% |
| B | 6390 | 265 | 4.147105% |
| C | 6390 | 5926 | 92.738654% |
| D | 6390 | 2466 | 38.591549% |
Noise dominated data is calculated using 1-second bins in cleaned event files. If a bin has >2000 counts, and if more than 50% of those come from <1% of pixels, then it is considered to be noise-dominated and hence unusable.
| Quadrant | # 1 sec bins | Bins with >0 counts | Bins with >2000 counts | High rate bins dominated by noise | Noise dominated (total time) | Noise dominated (detector-on time) | Marked lightcurve |
|---|---|---|---|---|---|---|---|
| A | 7350 | 6390 | 504 | 504 | 6.86% | 7.89% | 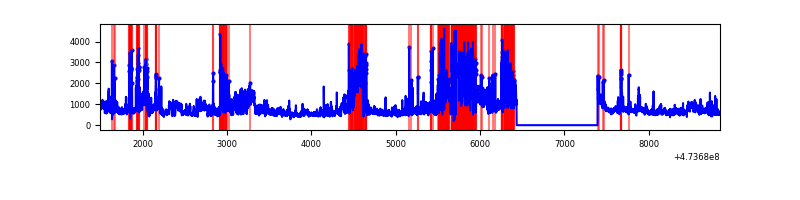 |
| B | 7350 | 6390 | 169 | 169 | 2.30% | 2.64% | 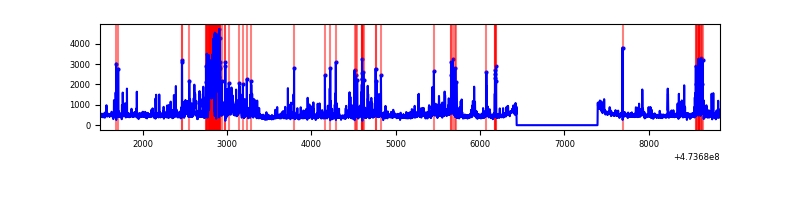 |
| C | 7349 | 6389 | 4978 | 4978 | 67.74% | 77.92% | 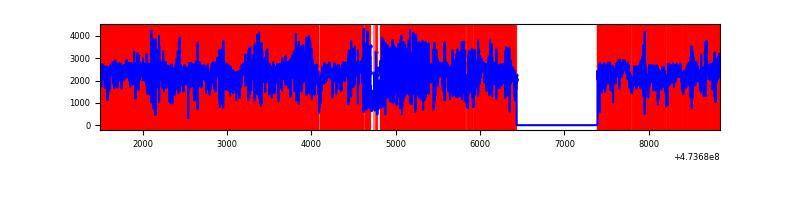 |
| D | 7350 | 6390 | 2316 | 2316 | 31.51% | 36.24% | 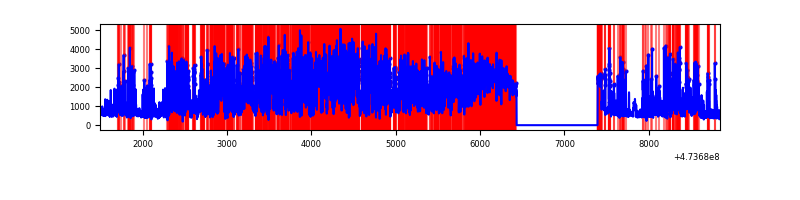 |
Top three noisy pixels from each quadrant. If the there are fewer than three noisy pixels in the level2.evt file, extra rows are filled as -1
| Pixel properties | Quadrant properties | ||||||
|---|---|---|---|---|---|---|---|
| Quadrant | DetID | PixID | Counts | Sigma | Mean | Median | Sigma |
| A | 6 | 250 | 791668 | 4842.58 | 648 | 630 | 163.4 |
| A | 0 | 98 | 726416 | 4443.12 | 648 | 630 | 163.4 |
| A | 10 | 253 | 526309 | 3218.11 | 648 | 630 | 163.4 |
| B | 10 | 16 | 534432 | 3775.6 | 658 | 638 | 141.4 |
| B | 2 | 176 | 114797 | 807.46 | 658 | 638 | 141.4 |
| B | 0 | 229 | 100629 | 707.25 | 658 | 638 | 141.4 |
| C | 4 | 111 | 6911945 | 122068.05 | 194 | 192 | 56.6 |
| C | 15 | 214 | 3255182 | 57486.18 | 194 | 192 | 56.6 |
| C | 15 | 230 | 1693582 | 29906.86 | 194 | 192 | 56.6 |
| D | 15 | 168 | 2925268 | 18639.1 | 541 | 522 | 156.9 |
| D | 15 | 106 | 941862 | 5999.06 | 541 | 522 | 156.9 |
| D | 12 | 6 | 466966 | 2972.6 | 541 | 522 | 156.9 |
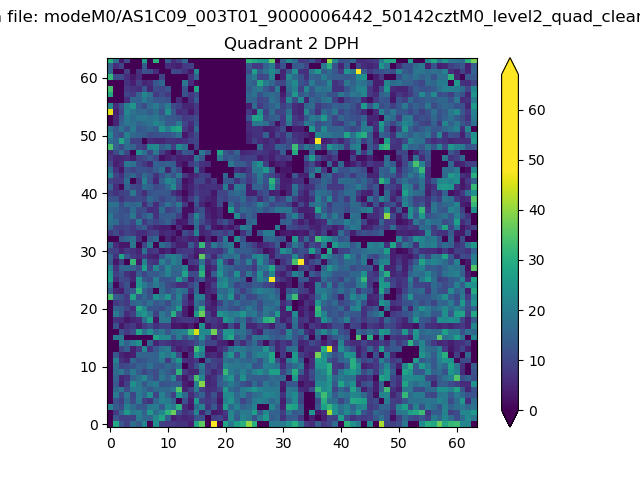
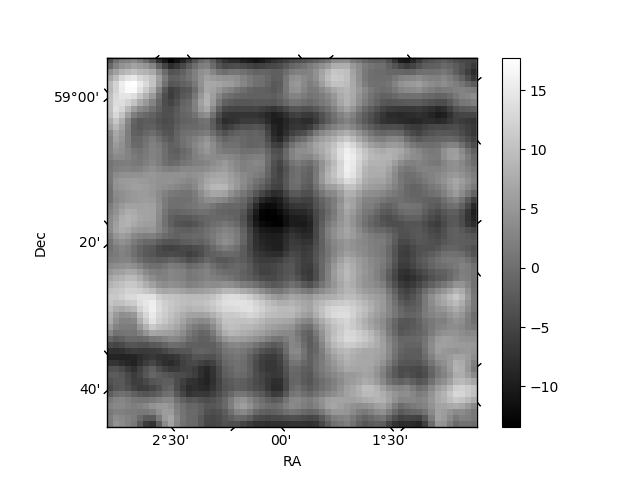
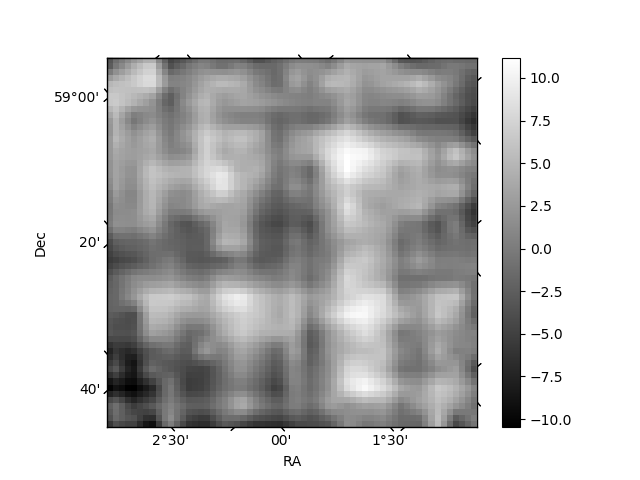
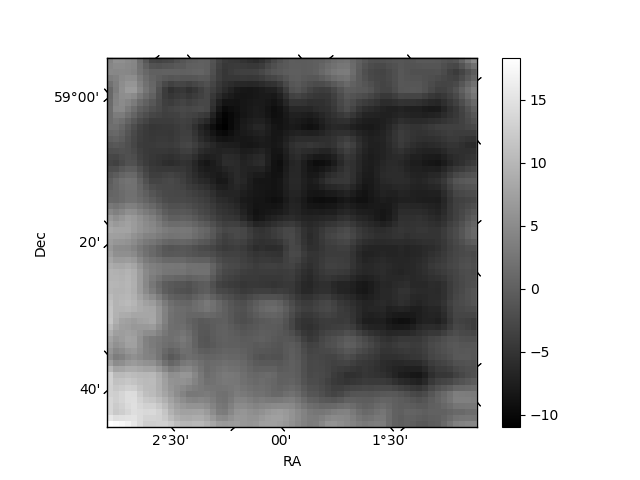
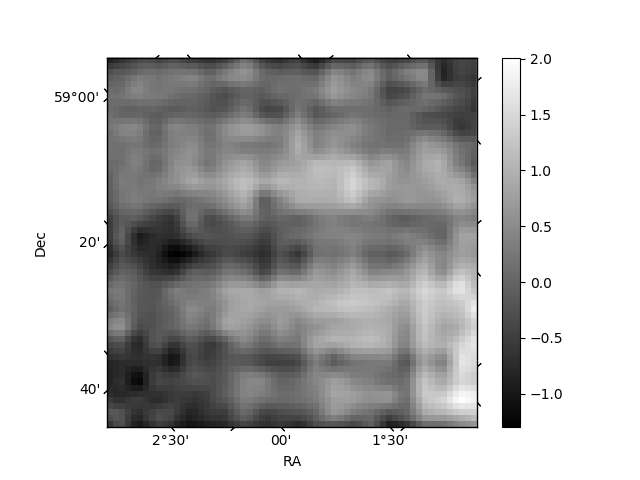
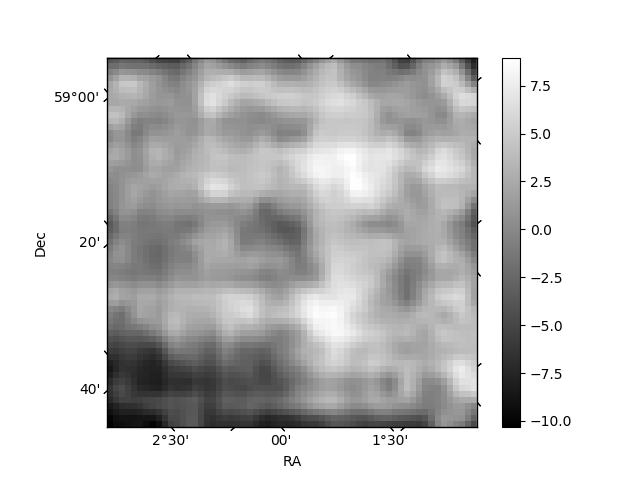
Histogram calculated using DETX and DETY for each event in the final _common_clean file
| Quadrant A | 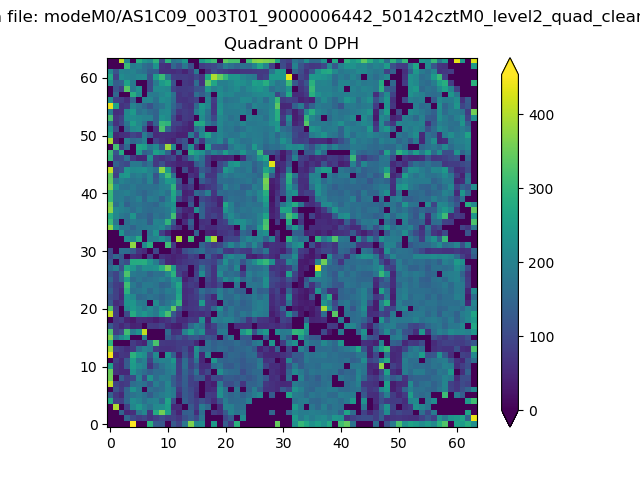 |
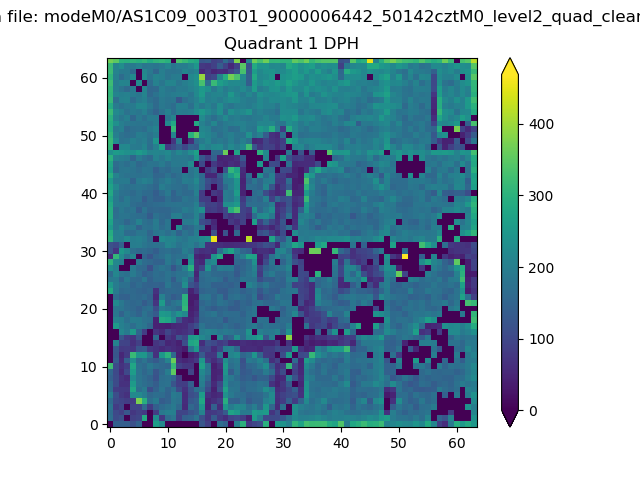 |
Quadrant B |
|---|---|---|---|
| Quadrant D | 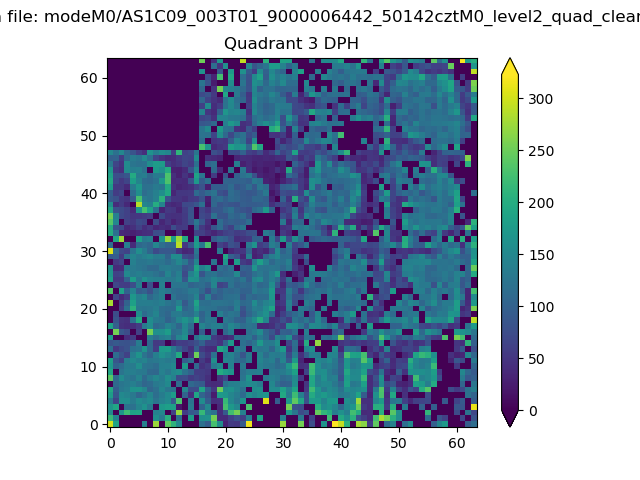 |
 |
Quadrant C |
| Plot type | Count rate plots | Images |
|---|---|---|
| Comparison with Poisson distribution Blue bars denote a histogram of data divided into 1 sec bins. Red curve is a Poisson curve with rate = median count rate of data. |
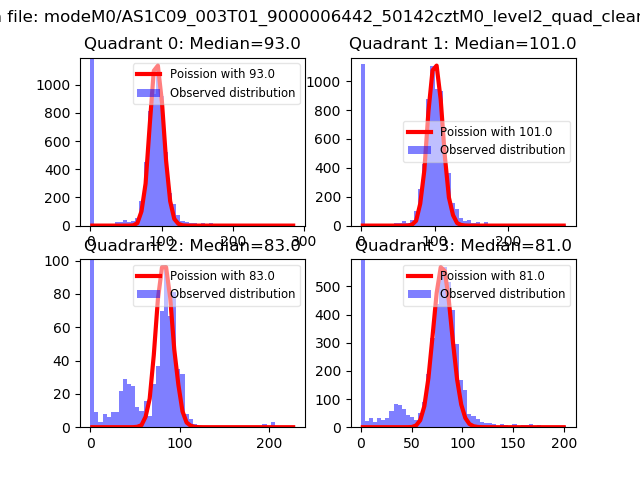 |
 |
| Quadrant-wise count rates Data is divided into 100 sec bins |
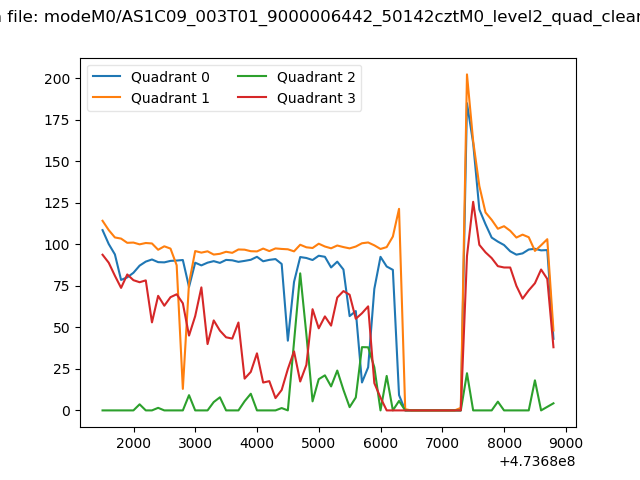 |
|
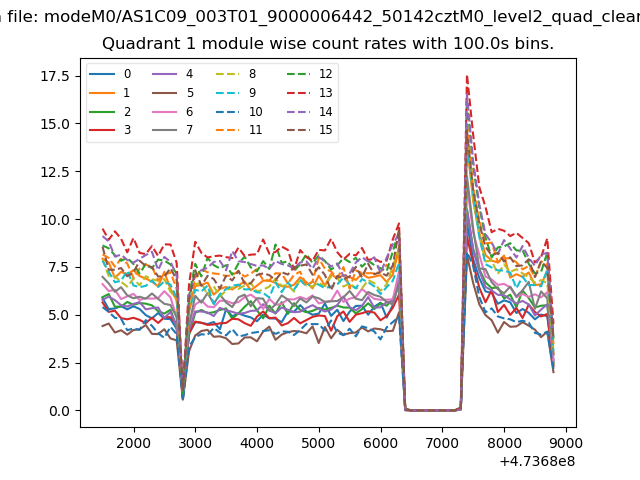
| Module-wise count rates for Quadrant A Data is divided into 100 sec bins |
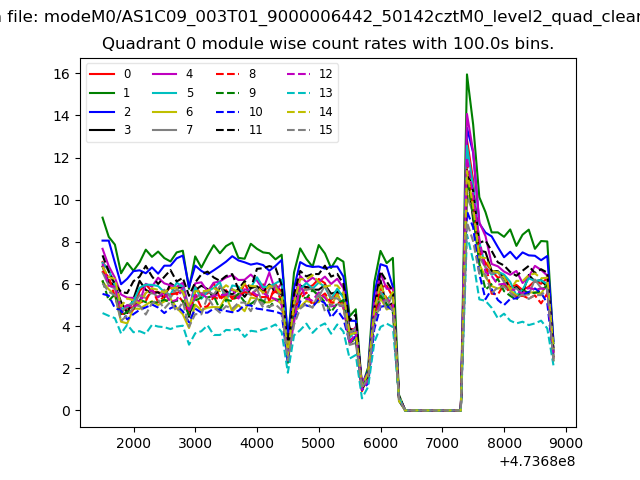 |
 |
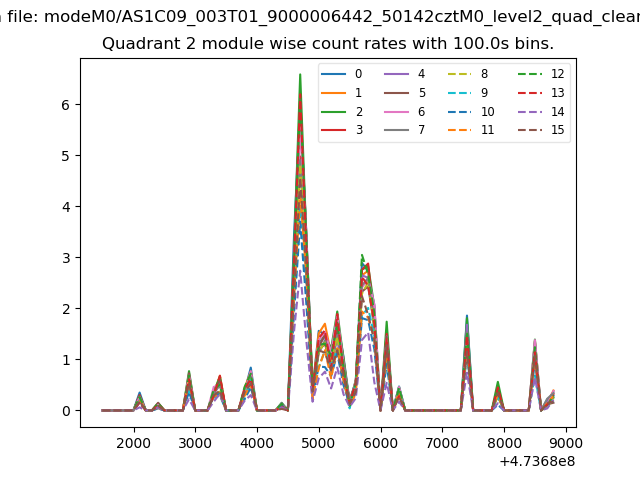
| Module-wise count rates for Quadrant B Data is divided into 100 sec bins |
 |
 |
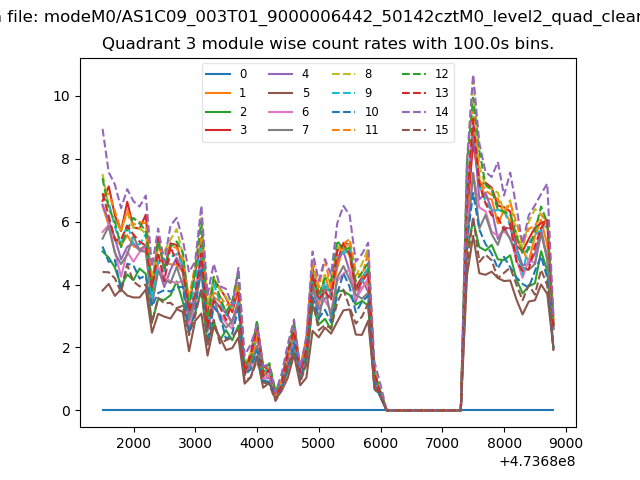
| Module-wise count rates for Quadrant C Data is divided into 100 sec bins |
 |
 |
| Module-wise count rates for Quadrant D Data is divided into 100 sec bins |
 |
 |
| Parameter | Plot |
|---|---|
| CZT HV Monitor | 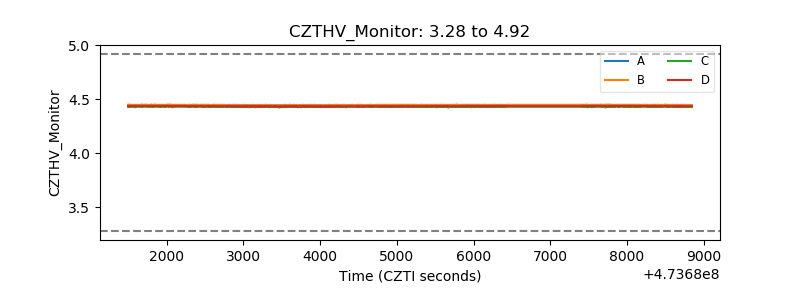 |
| D_VDD | 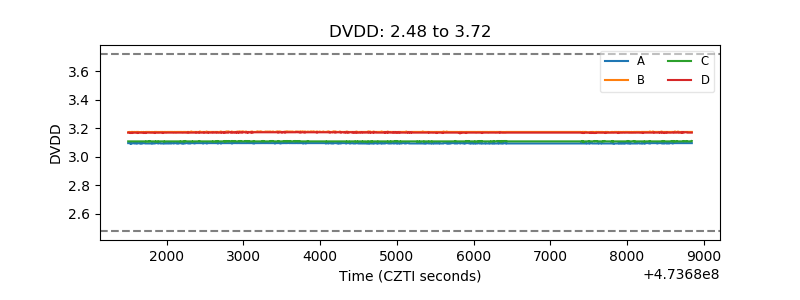 |
| Temperature 1 | 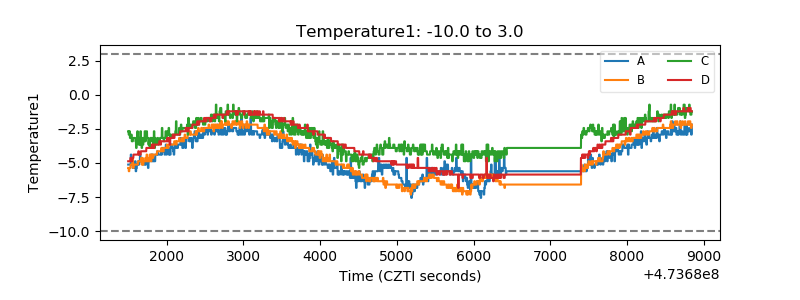 |
| Veto HV Monitor | 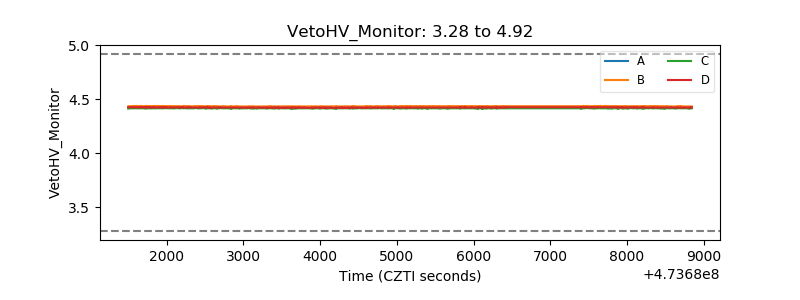 |
| Veto LLD |  |
| Alpha Counter | 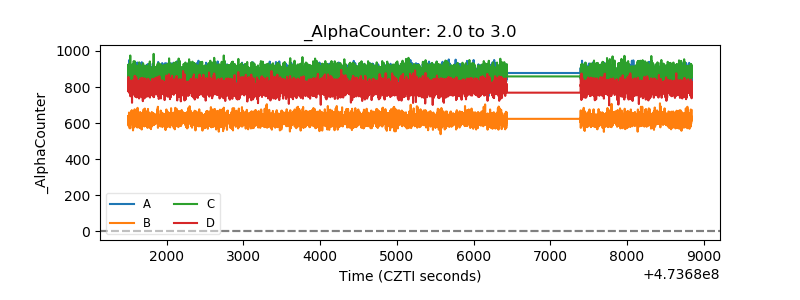 |
| _CPM_Rate | 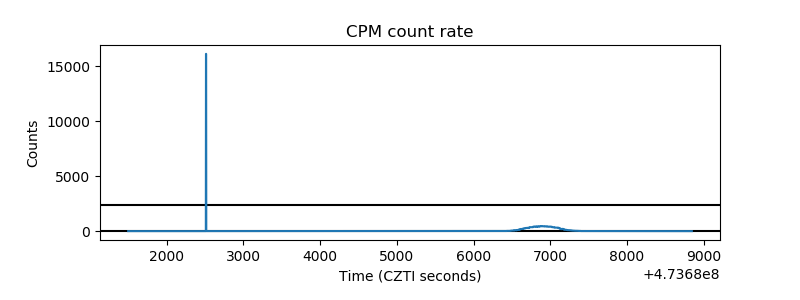 |
| CZT Counter | 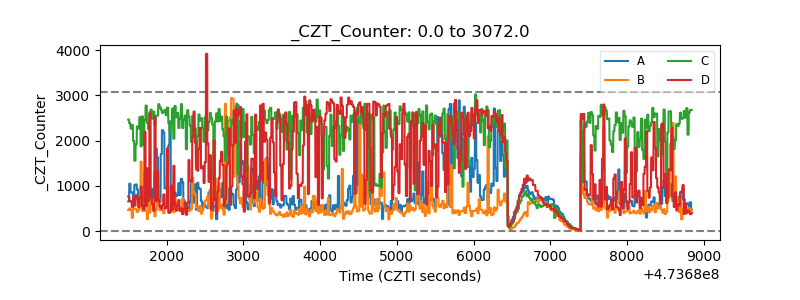 |
| +2.5 Volts monitor | 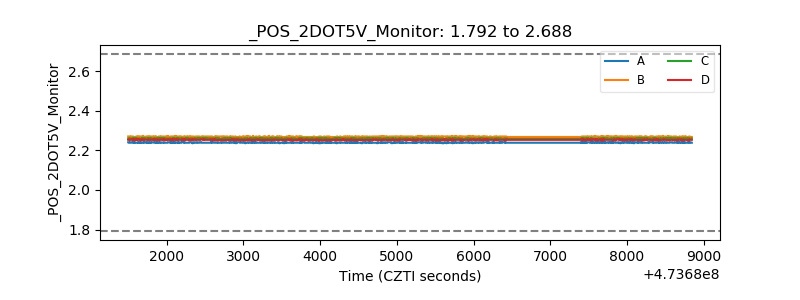 |
| +5 Volts monitor | 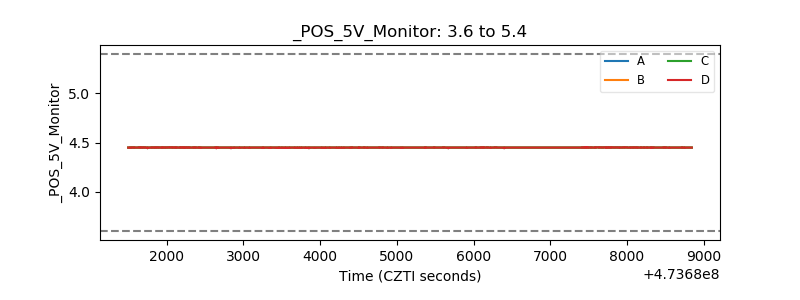 |
| _ROLL_ROT | 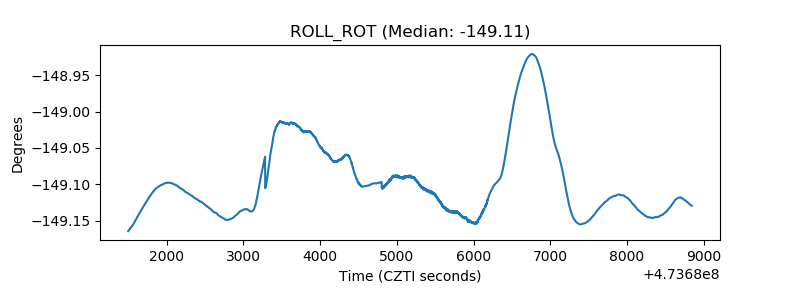 |
| _Roll_DEC | 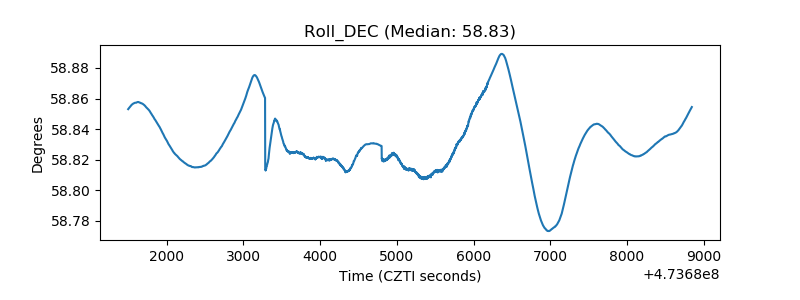 |
| _Roll_RA | 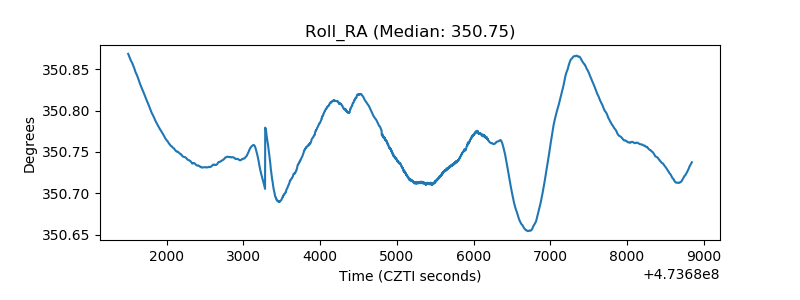 |
| Veto Counter | 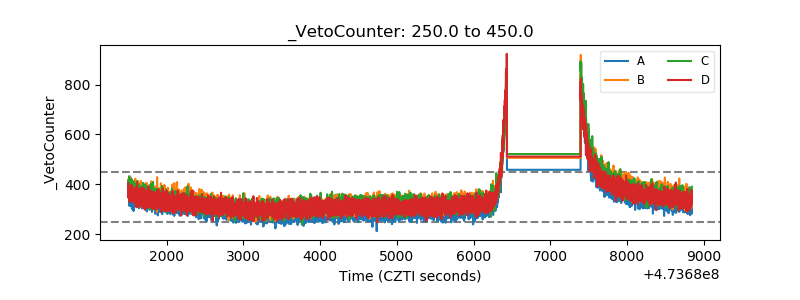 |