| Param | Original file | Final file |
|---|---|---|
| Filename | modeM0/AS1C09_003T01_9000006442_50145cztM0_level2.fits | modeM0/AS1C09_003T01_9000006442_50145cztM0_level2_quad_clean.evt |
| Size (bytes) | 890,671,680 | 59,791,680 |
| Size | 849.4 MB | 57.0 MB |
| Events in quadrant A | 5,603,807 | 490,822 |
| Events in quadrant B | 3,216,562 | 615,339 |
| Events in quadrant C | 12,289,383 | 51,687 |
| Events in quadrant D | 11,407,168 | 243,495 |
| Mode M9 | |||
|---|---|---|---|
| Quadrant | BADHDUFLAG | Total packets | Discarded packets |
| A | 0 | 11 | 0 |
| B | 0 | 11 | 0 |
| C | 0 | 11 | 0 |
| D | 0 | 11 | 0 |
| Mode M0 | |||
|---|---|---|---|
| Quadrant | BADHDUFLAG | Total packets | Discarded packets |
| A | 0 | 20447 | 3 |
| B | 0 | 13699 | 2 |
| C | 0 | 40529 | 2 |
| D | 0 | 37917 | 2 |
| Mode SS | |||
|---|---|---|---|
| Quadrant | BADHDUFLAG | Total packets | Discarded packets |
| A | 0 | 118 | 0 |
| B | 0 | 118 | 0 |
| C | 0 | 118 | 0 |
| D | 0 | 118 | 0 |
| Quadrant | Total seconds | Saturated seconds | Saturation percentage |
|---|---|---|---|
| A | 5845 | 977 | 16.715141% |
| B | 5845 | 104 | 1.779299% |
| C | 5846 | 5393 | 92.251112% |
| D | 5846 | 3335 | 57.047554% |
Noise dominated data is calculated using 1-second bins in cleaned event files. If a bin has >2000 counts, and if more than 50% of those come from <1% of pixels, then it is considered to be noise-dominated and hence unusable.
| Quadrant | # 1 sec bins | Bins with >0 counts | Bins with >2000 counts | High rate bins dominated by noise | Noise dominated (total time) | Noise dominated (detector-on time) | Marked lightcurve |
|---|---|---|---|---|---|---|---|
| A | 7010 | 5847 | 788 | 788 | 11.24% | 13.48% | 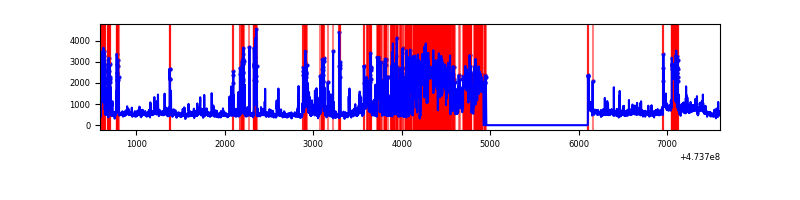 |
| B | 7010 | 5847 | 54 | 54 | 0.77% | 0.92% | 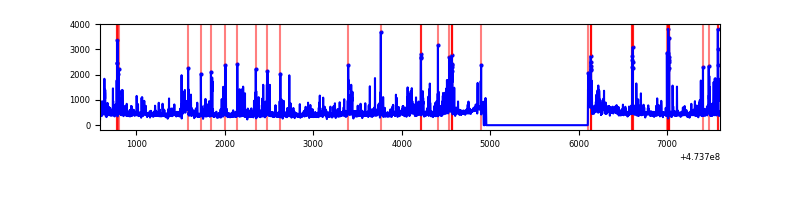 |
| C | 7010 | 5845 | 3734 | 3734 | 53.27% | 63.88% | 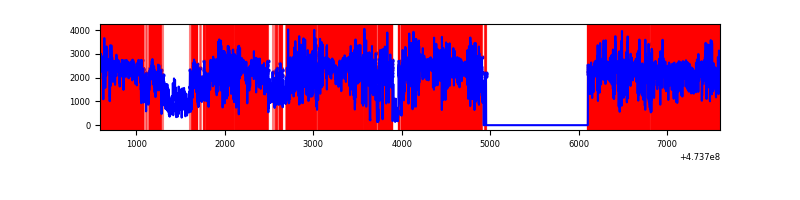 |
| D | 7011 | 5847 | 3083 | 3083 | 43.97% | 52.73% | 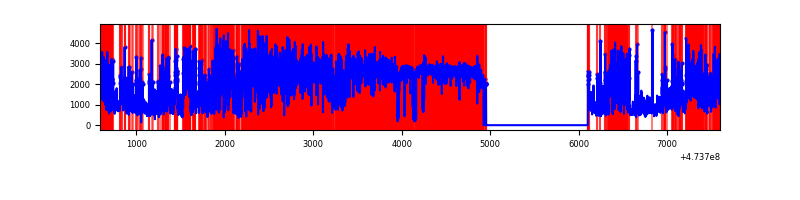 |
Top three noisy pixels from each quadrant. If the there are fewer than three noisy pixels in the level2.evt file, extra rows are filled as -1
| Pixel properties | Quadrant properties | ||||||
|---|---|---|---|---|---|---|---|
| Quadrant | DetID | PixID | Counts | Sigma | Mean | Median | Sigma |
| A | 0 | 98 | 1513031 | 10637.87 | 571 | 557 | 142.2 |
| A | 12 | 250 | 466251 | 3275.42 | 571 | 557 | 142.2 |
| A | 8 | 38 | 353369 | 2481.48 | 571 | 557 | 142.2 |
| B | 10 | 16 | 96020 | 748.09 | 608 | 590 | 127.6 |
| B | 4 | 206 | 86573 | 674.04 | 608 | 590 | 127.6 |
| B | 1 | 255 | 61910 | 480.7 | 608 | 590 | 127.6 |
| C | 4 | 111 | 7374709 | 131144.5 | 191 | 189 | 56.2 |
| C | 1 | 60 | 897717 | 15961.16 | 191 | 189 | 56.2 |
| C | 15 | 213 | 894972 | 15912.34 | 191 | 189 | 56.2 |
| D | 15 | 168 | 2966455 | 23953.27 | 421 | 405 | 123.8 |
| D | 15 | 106 | 1696993 | 13701.33 | 421 | 405 | 123.8 |
| D | 12 | 6 | 754184 | 6087.38 | 421 | 405 | 123.8 |
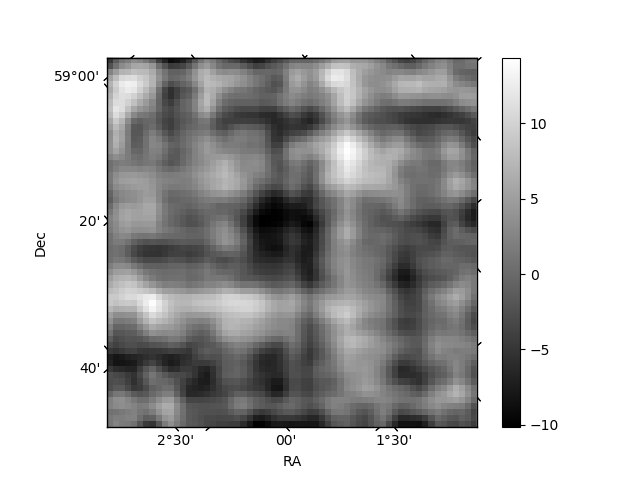
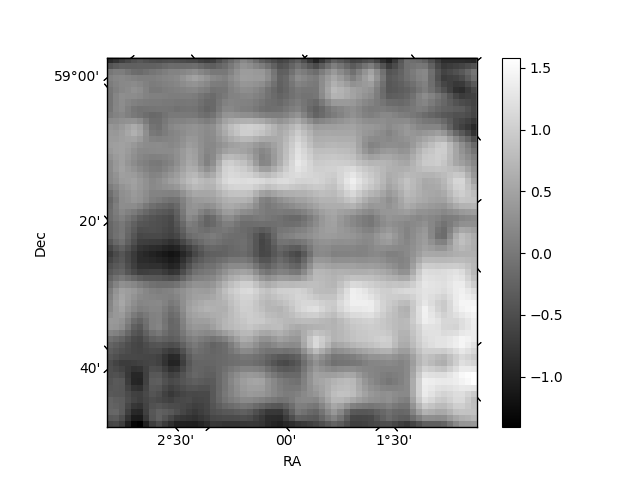
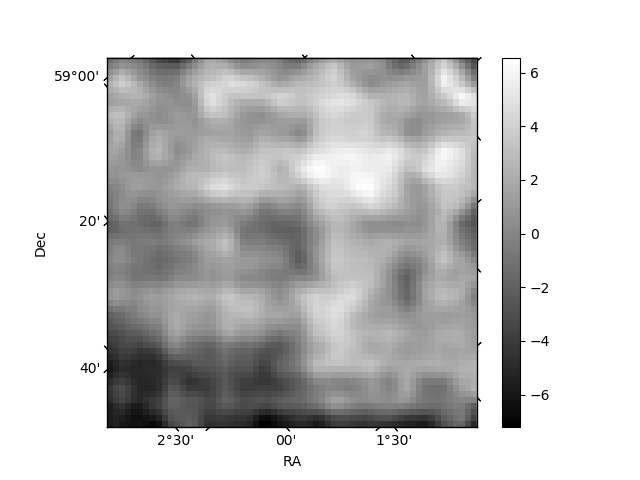
Histogram calculated using DETX and DETY for each event in the final _common_clean file
| Quadrant A | 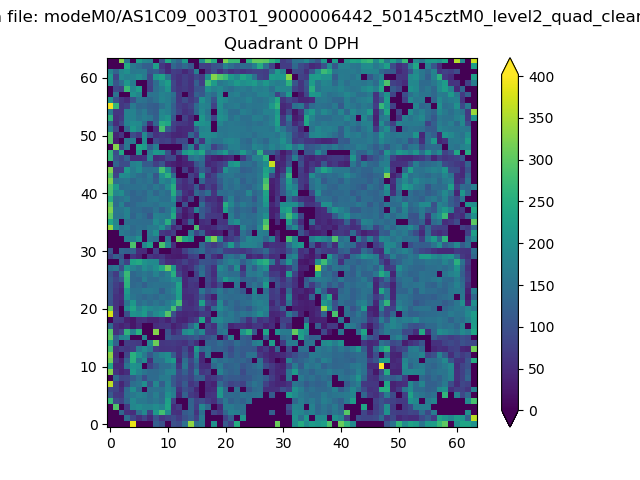 |
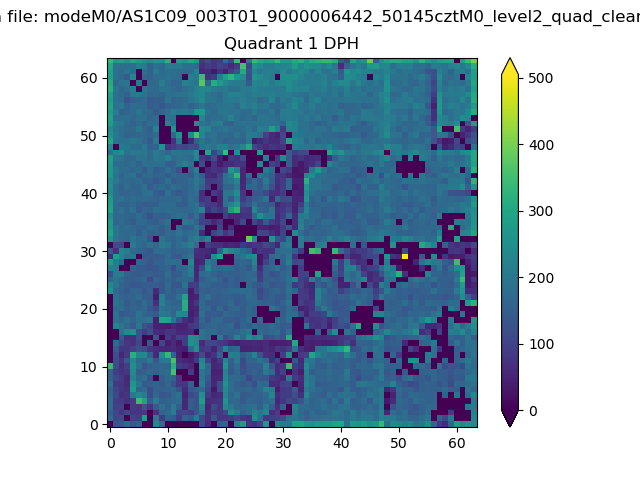 |
Quadrant B |
|---|---|---|---|
| Quadrant D | 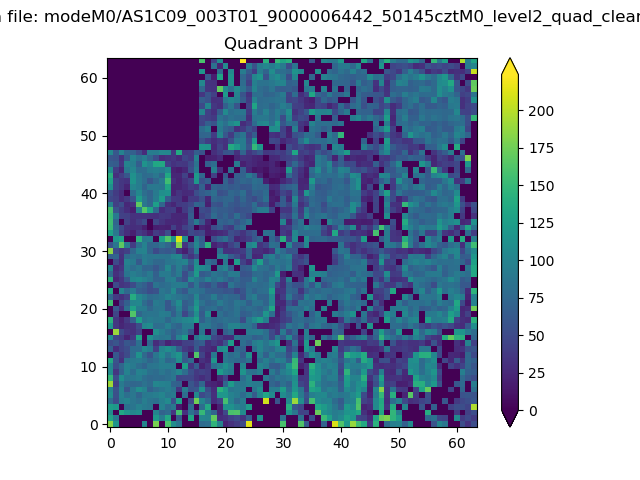 |
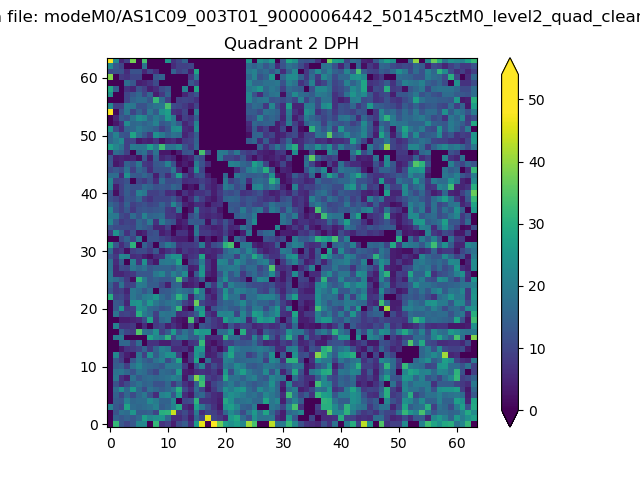 |
Quadrant C |
| Plot type | Count rate plots | Images |
|---|---|---|
| Comparison with Poisson distribution Blue bars denote a histogram of data divided into 1 sec bins. Red curve is a Poisson curve with rate = median count rate of data. |
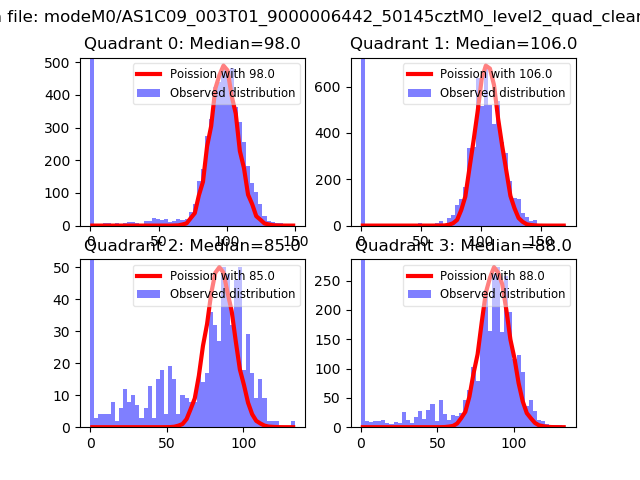 |
 |
| Quadrant-wise count rates Data is divided into 100 sec bins |
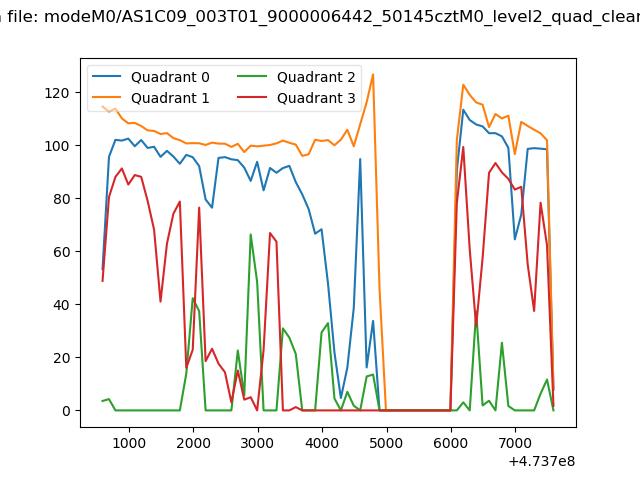 |
|
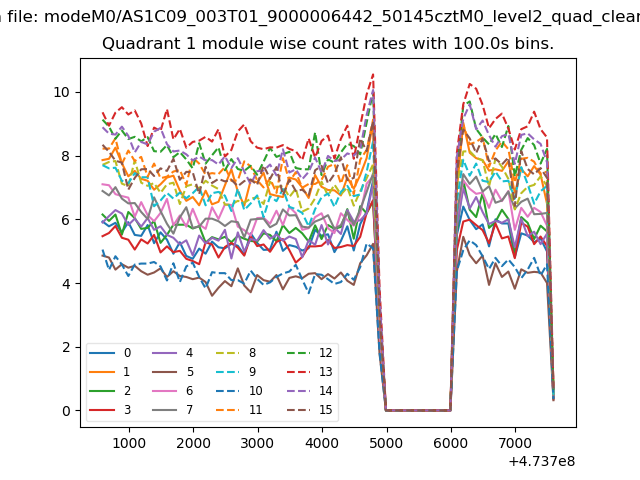
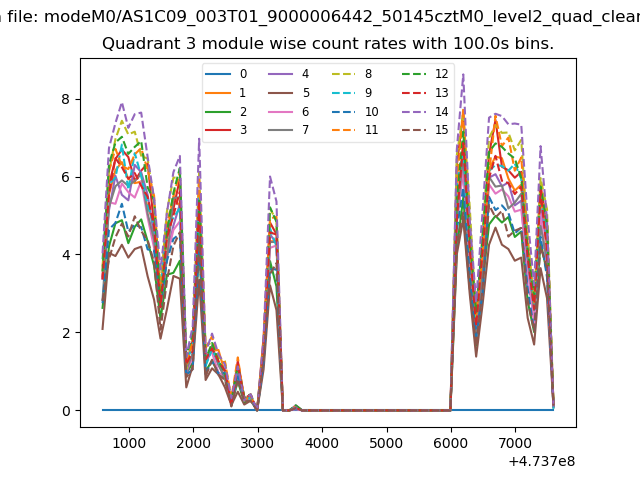
| Module-wise count rates for Quadrant A Data is divided into 100 sec bins |
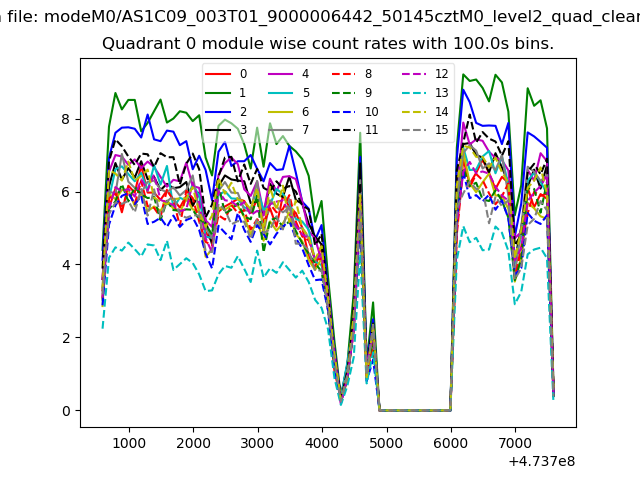 |
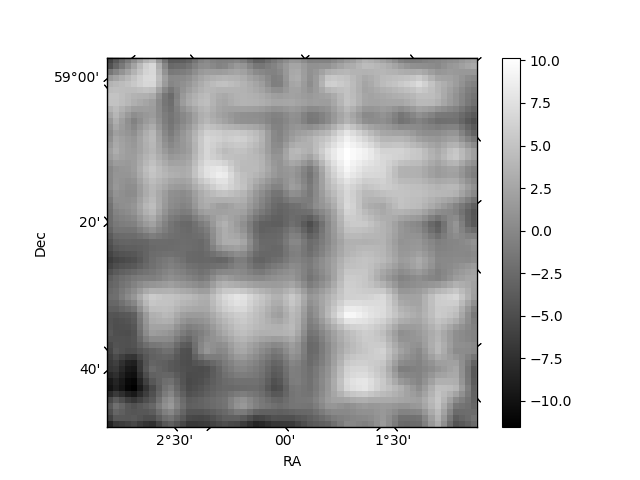 |
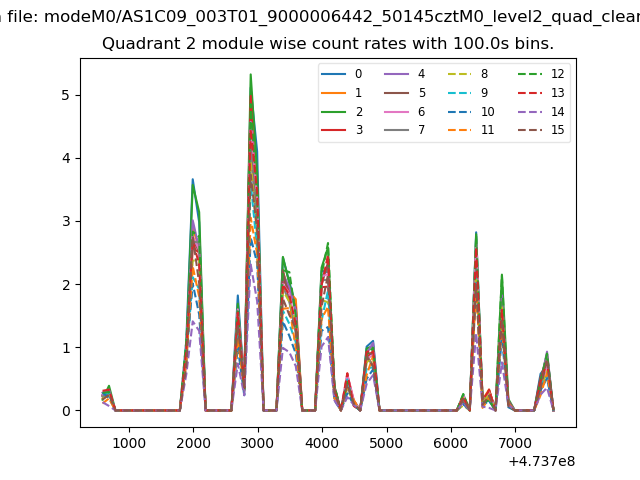
| Module-wise count rates for Quadrant B Data is divided into 100 sec bins |
 |
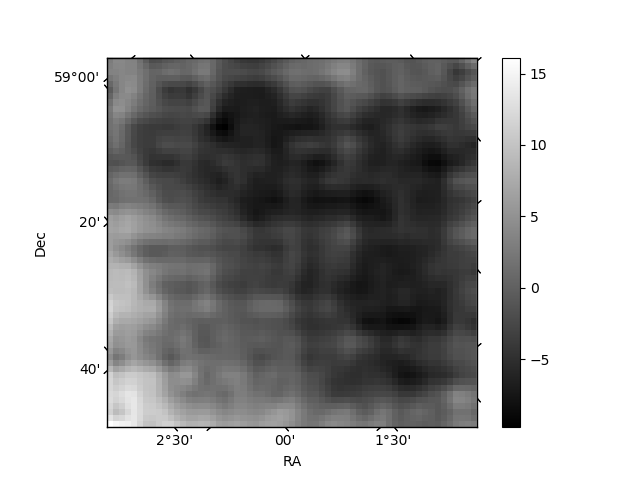 |
| Module-wise count rates for Quadrant C Data is divided into 100 sec bins |
 |
 |
| Module-wise count rates for Quadrant D Data is divided into 100 sec bins |
 |
 |
| Parameter | Plot |
|---|---|
| CZT HV Monitor | 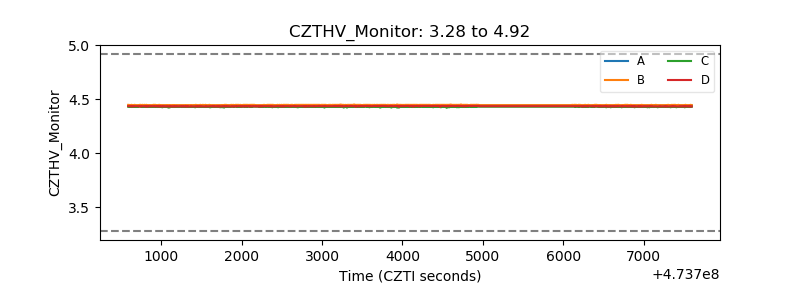 |
| D_VDD | 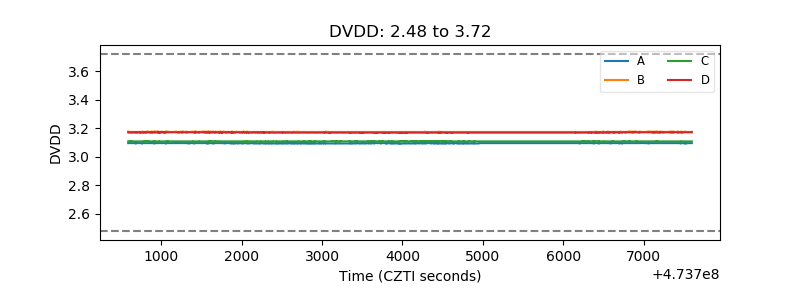 |
| Temperature 1 | 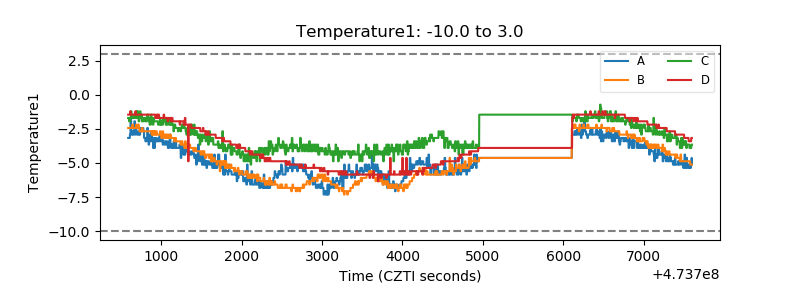 |
| Veto HV Monitor | 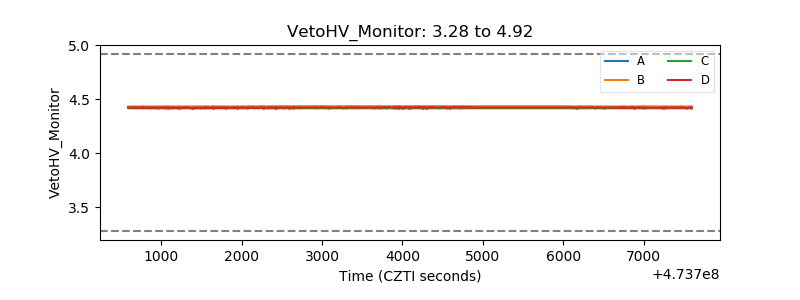 |
| Veto LLD | 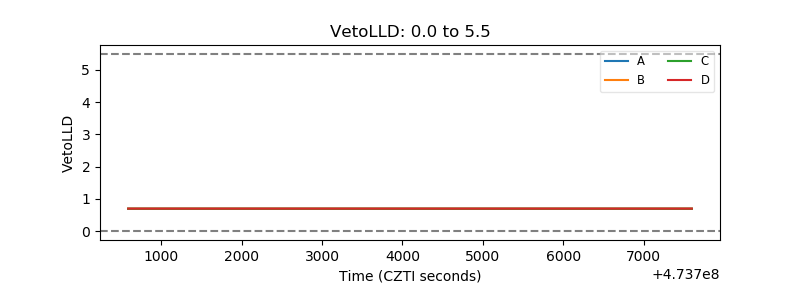 |
| Alpha Counter | 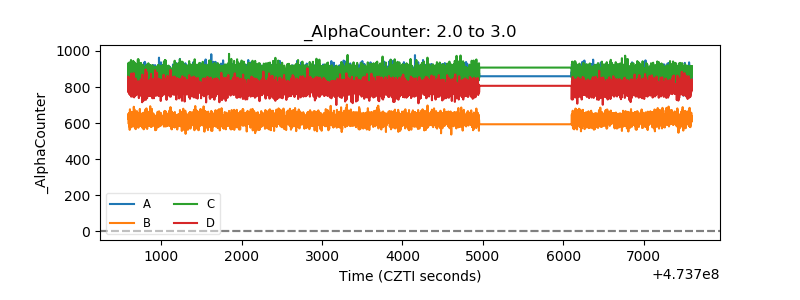 |
| _CPM_Rate | 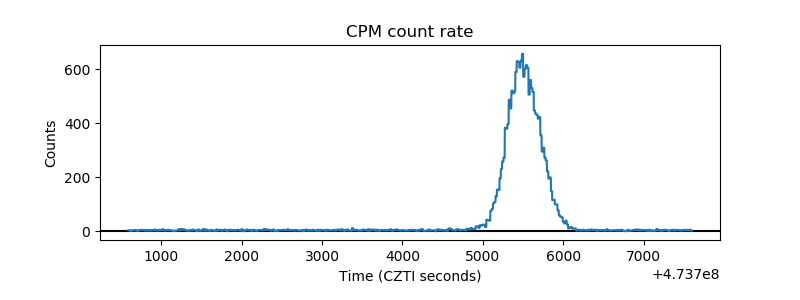 |
| CZT Counter | 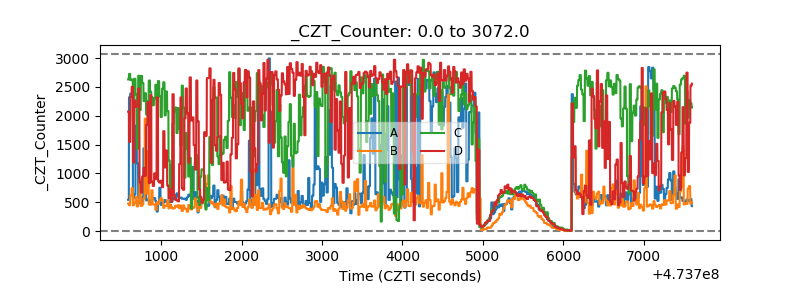 |
| +2.5 Volts monitor |  |
| +5 Volts monitor | 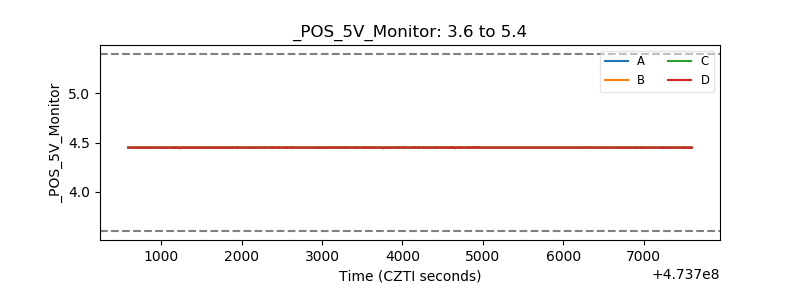 |
| _ROLL_ROT | 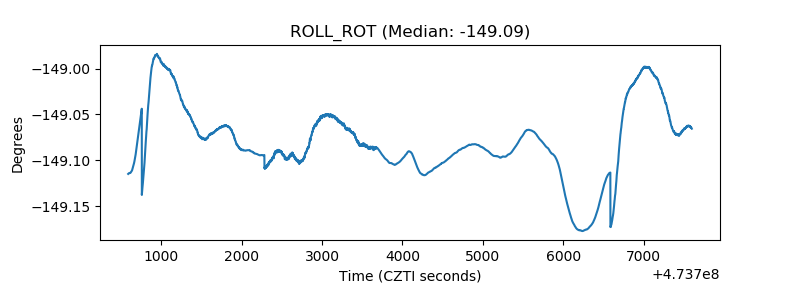 |
| _Roll_DEC | 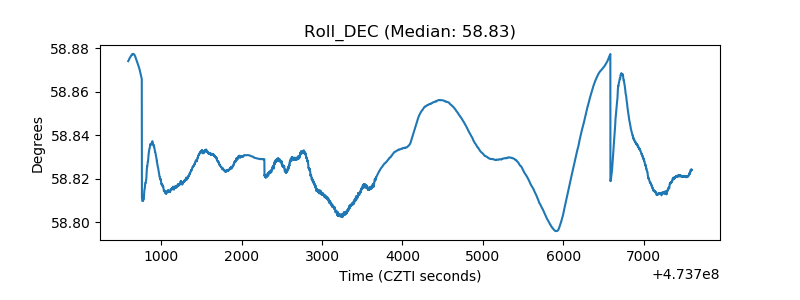 |
| _Roll_RA | 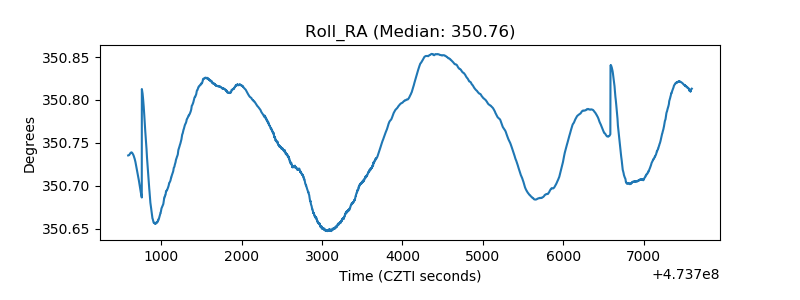 |
| Veto Counter | 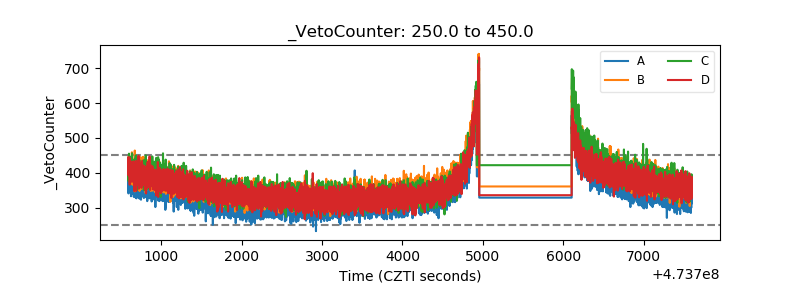 |