| Param | Original file | Final file |
|---|---|---|
| Filename | modeM0/AS1C09_003T01_9000006442_50146cztM0_level2.fits | modeM0/AS1C09_003T01_9000006442_50146cztM0_level2_quad_clean.evt |
| Size (bytes) | 952,712,640 | 72,092,160 |
| Size | 908.6 MB | 68.8 MB |
| Events in quadrant A | 5,388,550 | 578,294 |
| Events in quadrant B | 3,675,879 | 676,711 |
| Events in quadrant C | 13,360,973 | 176,007 |
| Events in quadrant D | 12,336,299 | 297,046 |
| Mode M9 | |||
|---|---|---|---|
| Quadrant | BADHDUFLAG | Total packets | Discarded packets |
| A | 0 | 11 | 0 |
| B | 0 | 11 | 0 |
| C | 0 | 11 | 0 |
| D | 0 | 11 | 0 |
| Mode M0 | |||
|---|---|---|---|
| Quadrant | BADHDUFLAG | Total packets | Discarded packets |
| A | 0 | 20458 | 2 |
| B | 0 | 15483 | 2 |
| C | 0 | 44151 | 2 |
| D | 0 | 41132 | 2 |
| Mode SS | |||
|---|---|---|---|
| Quadrant | BADHDUFLAG | Total packets | Discarded packets |
| A | 0 | 132 | 0 |
| B | 0 | 132 | 0 |
| C | 0 | 132 | 0 |
| D | 0 | 132 | 0 |
| Quadrant | Total seconds | Saturated seconds | Saturation percentage |
|---|---|---|---|
| A | 6518 | 695 | 10.662780% |
| B | 6519 | 137 | 2.101549% |
| C | 6519 | 4786 | 73.416168% |
| D | 6518 | 3435 | 52.700215% |
Noise dominated data is calculated using 1-second bins in cleaned event files. If a bin has >2000 counts, and if more than 50% of those come from <1% of pixels, then it is considered to be noise-dominated and hence unusable.
| Quadrant | # 1 sec bins | Bins with >0 counts | Bins with >2000 counts | High rate bins dominated by noise | Noise dominated (total time) | Noise dominated (detector-on time) | Marked lightcurve |
|---|---|---|---|---|---|---|---|
| A | 7583 | 6518 | 489 | 489 | 6.45% | 7.50% | 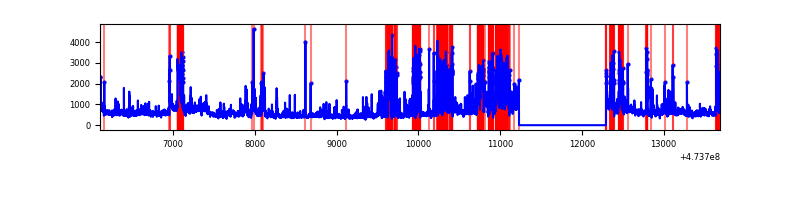 |
| B | 7584 | 6519 | 70 | 70 | 0.92% | 1.07% | 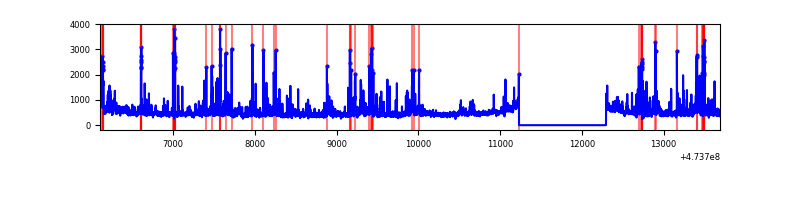 |
| C | 7584 | 6520 | 4029 | 4029 | 53.12% | 61.79% | 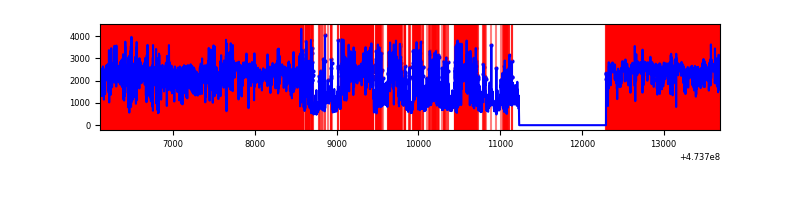 |
| D | 7583 | 6518 | 3262 | 3262 | 43.02% | 50.05% | 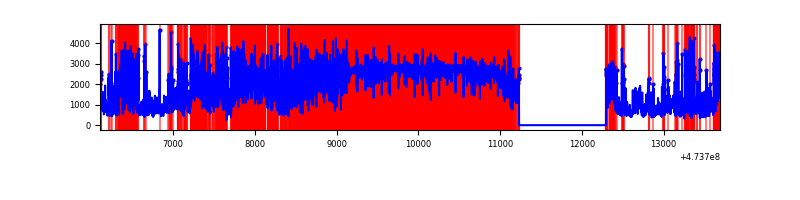 |
Top three noisy pixels from each quadrant. If the there are fewer than three noisy pixels in the level2.evt file, extra rows are filled as -1
| Pixel properties | Quadrant properties | ||||||
|---|---|---|---|---|---|---|---|
| Quadrant | DetID | PixID | Counts | Sigma | Mean | Median | Sigma |
| A | 0 | 98 | 994694 | 6082.51 | 661 | 645 | 163.4 |
| A | 10 | 253 | 389157 | 2377.28 | 661 | 645 | 163.4 |
| A | 6 | 250 | 304148 | 1857.11 | 661 | 645 | 163.4 |
| B | 4 | 206 | 157622 | 1100.94 | 681 | 658 | 142.6 |
| B | 5 | 185 | 111533 | 777.67 | 681 | 658 | 142.6 |
| B | 10 | 247 | 89697 | 624.51 | 681 | 658 | 142.6 |
| C | 4 | 111 | 7617281 | 76090.89 | 344 | 342 | 100.1 |
| C | 15 | 230 | 776706 | 7755.64 | 344 | 342 | 100.1 |
| C | 1 | 60 | 662846 | 6618.21 | 344 | 342 | 100.1 |
| D | 15 | 106 | 2679323 | 18194.22 | 512 | 494 | 147.2 |
| D | 15 | 168 | 1681226 | 11415.29 | 512 | 494 | 147.2 |
| D | 15 | 108 | 1070279 | 7265.83 | 512 | 494 | 147.2 |
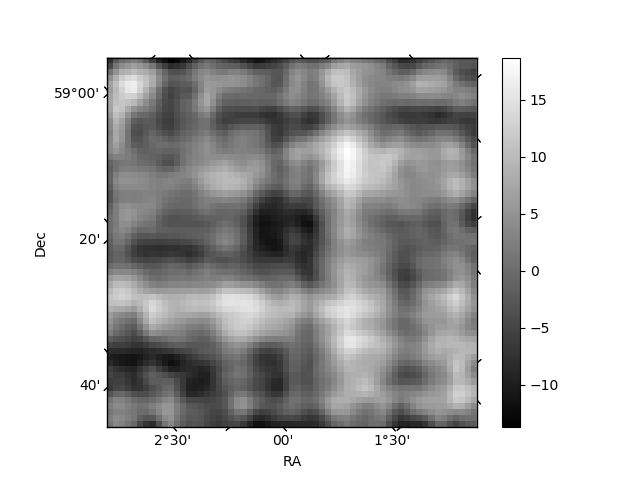
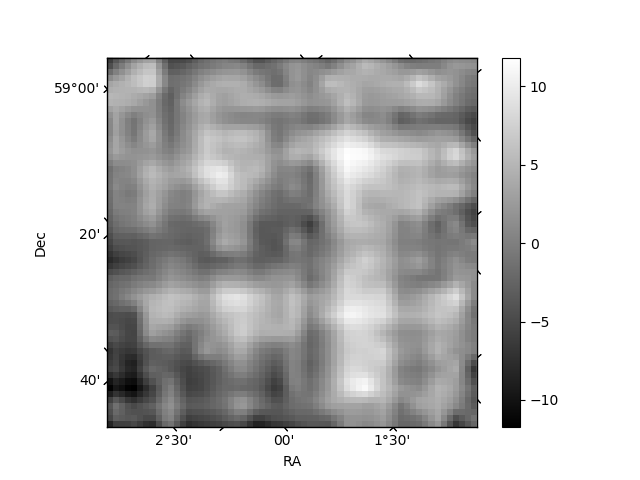
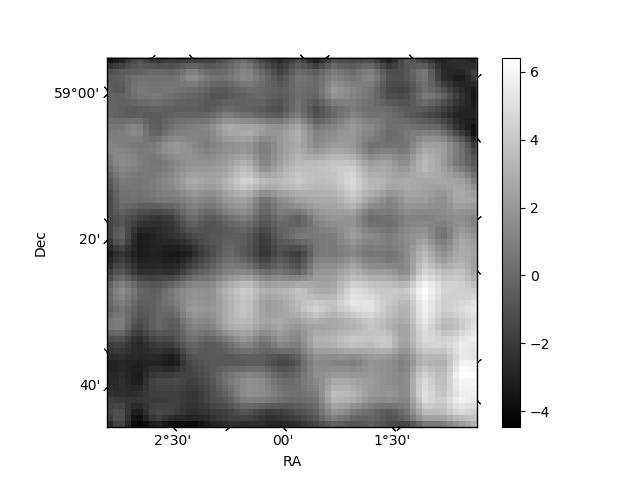
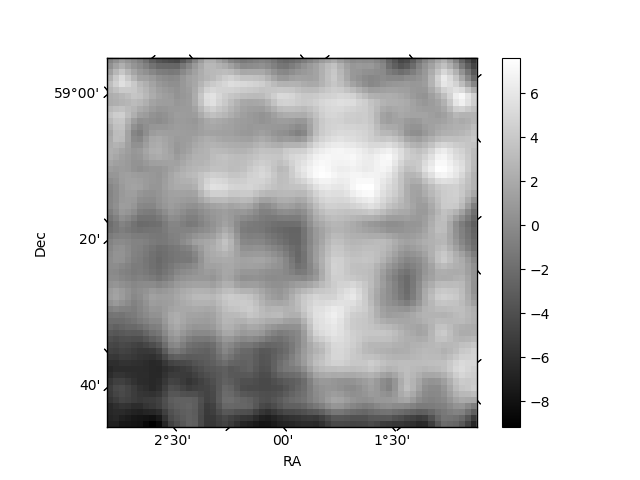
Histogram calculated using DETX and DETY for each event in the final _common_clean file
| Quadrant A | 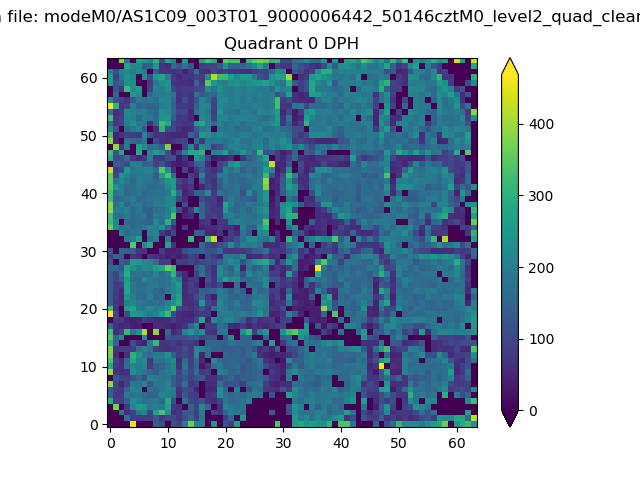 |
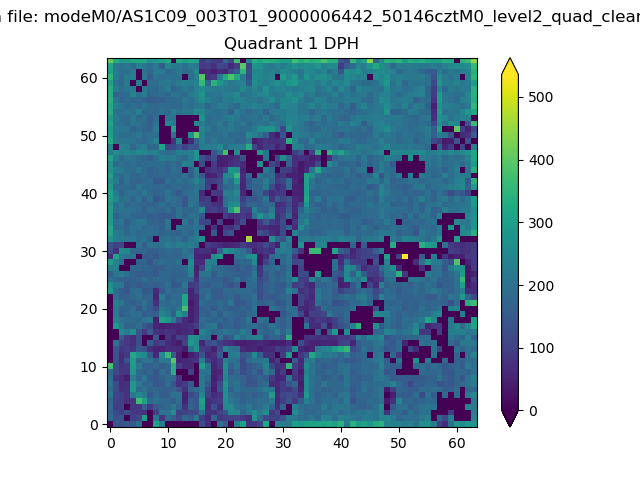 |
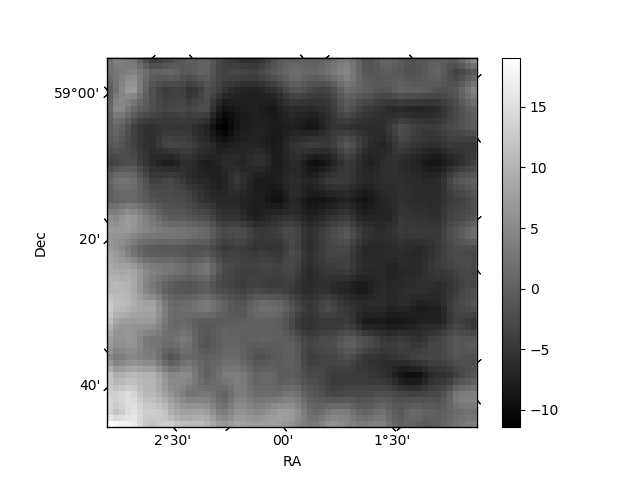
Quadrant B |
|---|---|---|---|
| Quadrant D | 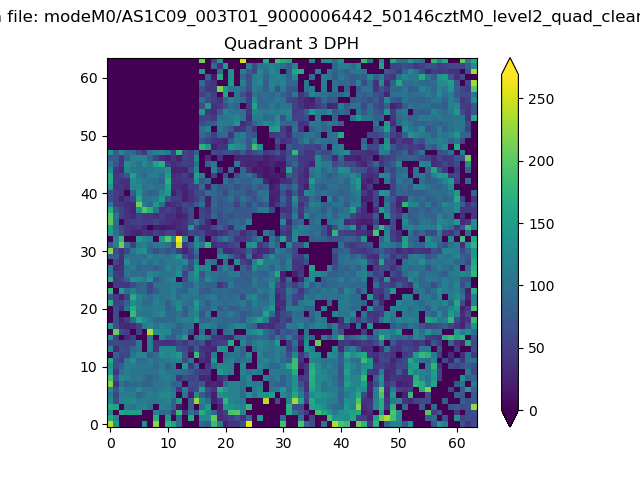 |
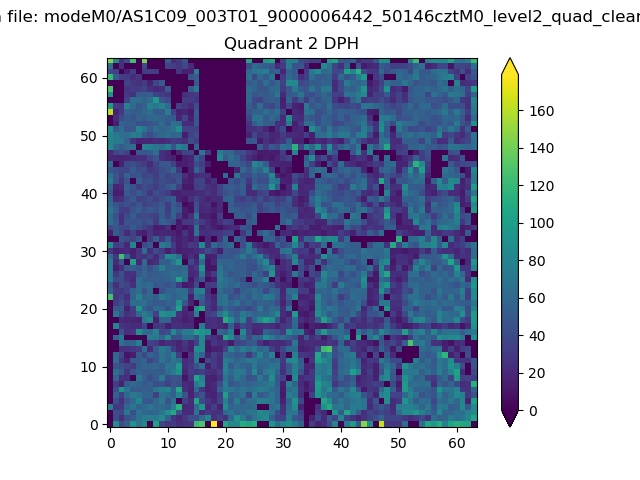 |
Quadrant C |
| Plot type | Count rate plots | Images |
|---|---|---|
| Comparison with Poisson distribution Blue bars denote a histogram of data divided into 1 sec bins. Red curve is a Poisson curve with rate = median count rate of data. |
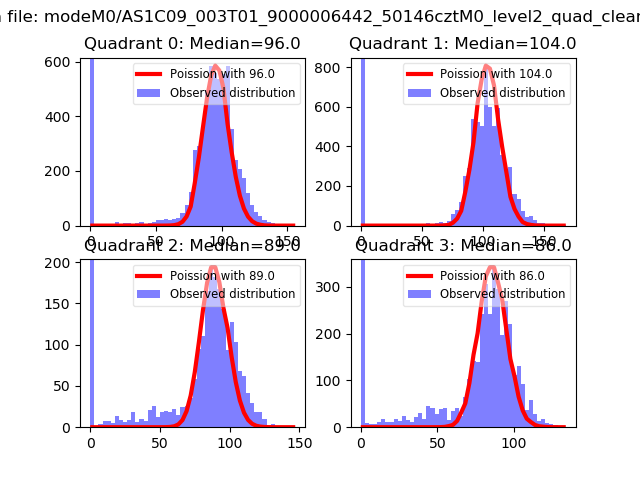 |
 |
| Quadrant-wise count rates Data is divided into 100 sec bins |
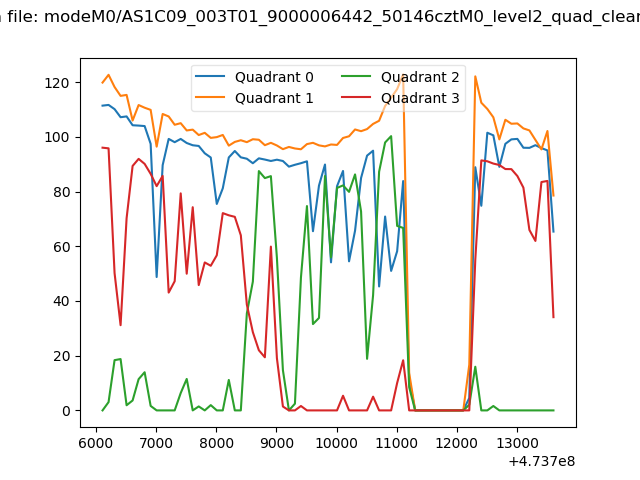 |
|
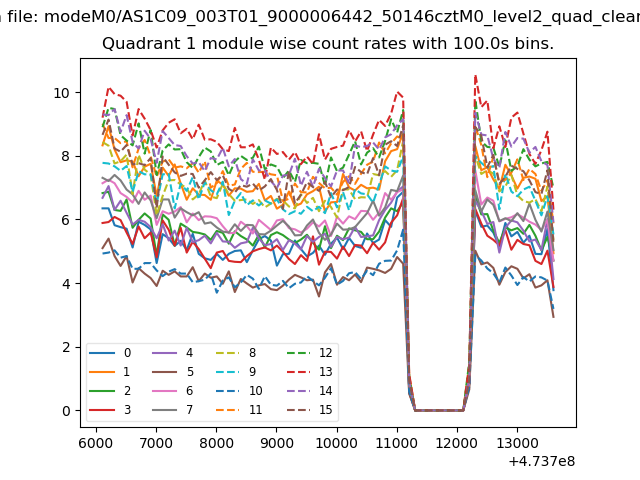
| Module-wise count rates for Quadrant A Data is divided into 100 sec bins |
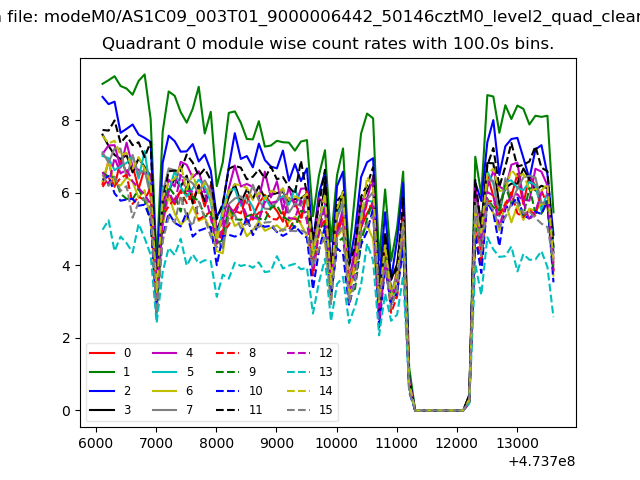 |
 |
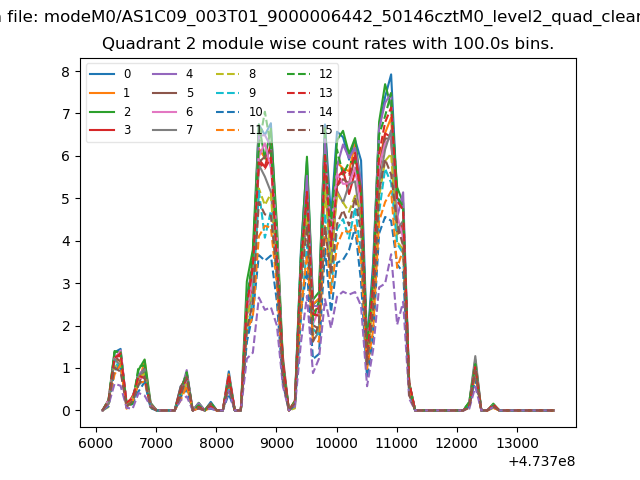
| Module-wise count rates for Quadrant B Data is divided into 100 sec bins |
 |
 |
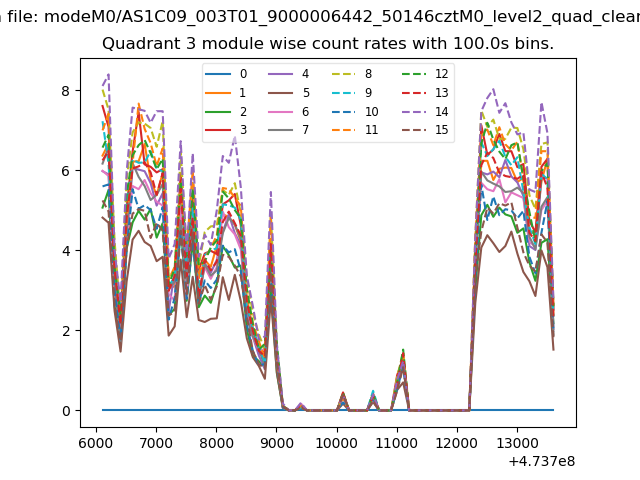
| Module-wise count rates for Quadrant C Data is divided into 100 sec bins |
 |
 |
| Module-wise count rates for Quadrant D Data is divided into 100 sec bins |
 |
 |
| Parameter | Plot |
|---|---|
| CZT HV Monitor | 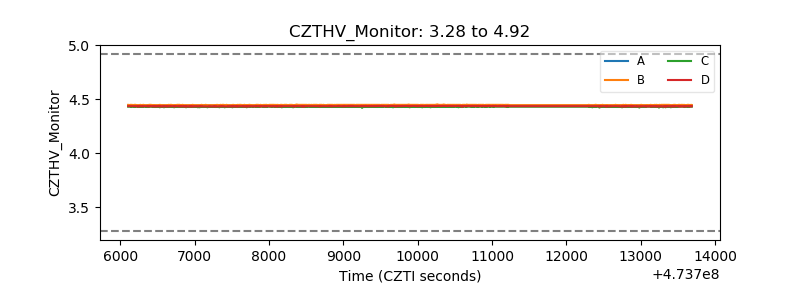 |
| D_VDD | 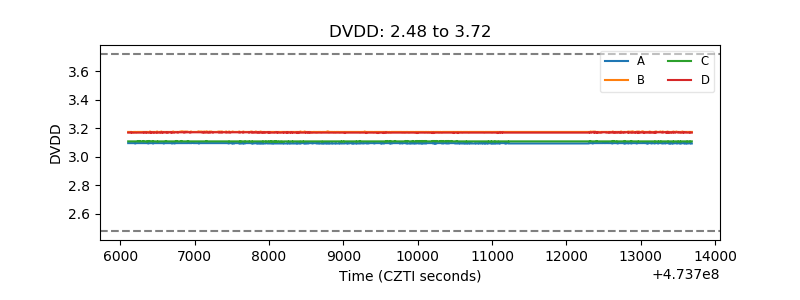 |
| Temperature 1 | 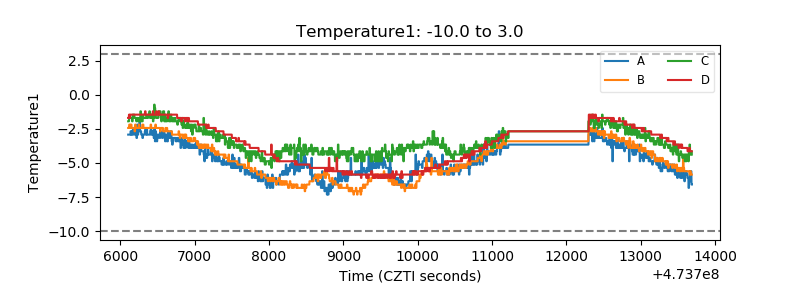 |
| Veto HV Monitor | 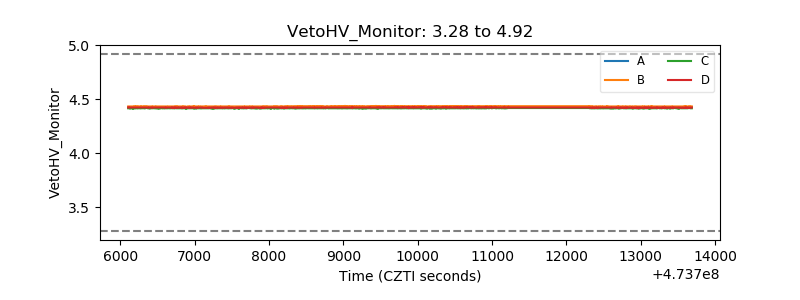 |
| Veto LLD | 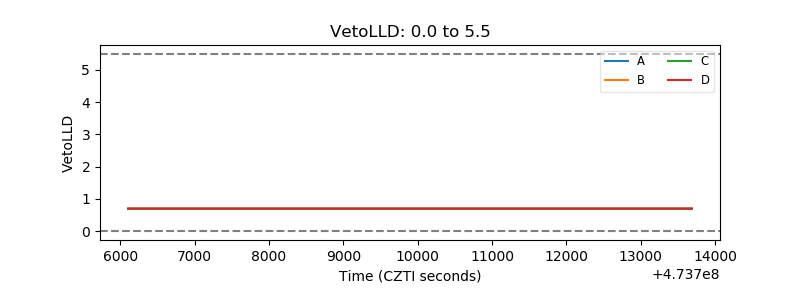 |
| Alpha Counter | 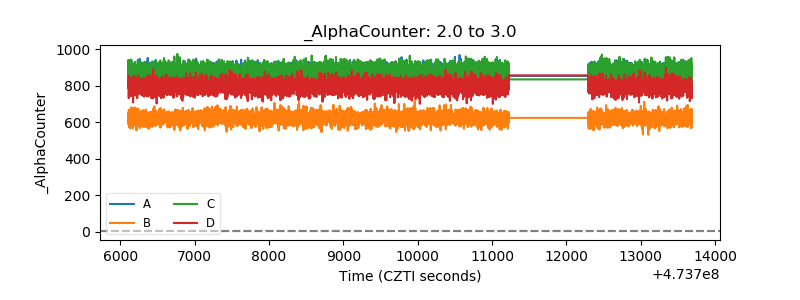 |
| _CPM_Rate | 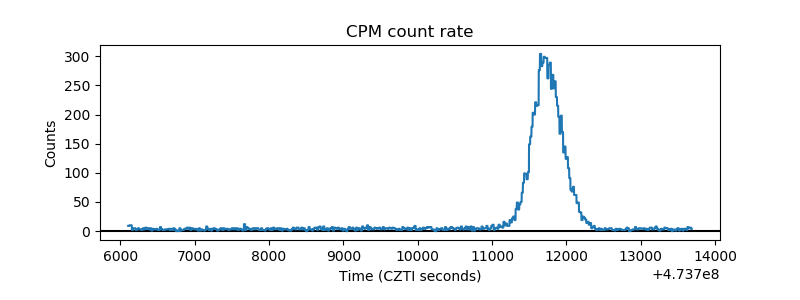 |
| CZT Counter | 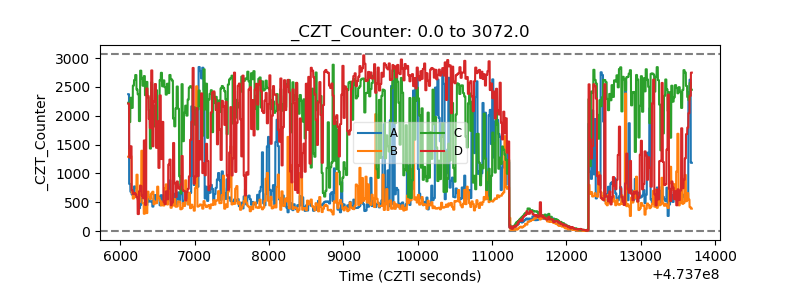 |
| +2.5 Volts monitor |  |
| +5 Volts monitor | 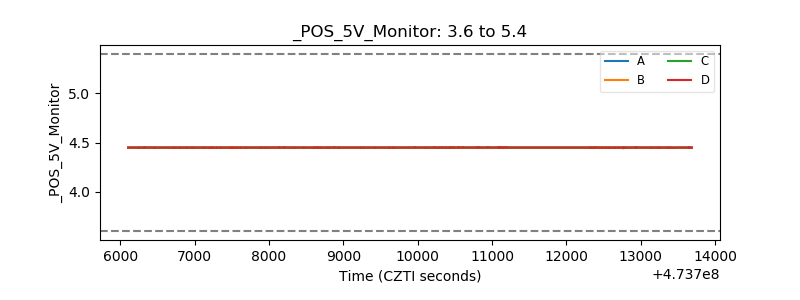 |
| _ROLL_ROT | 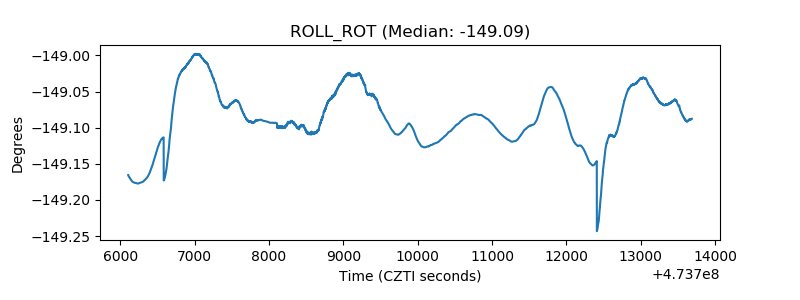 |
| _Roll_DEC | 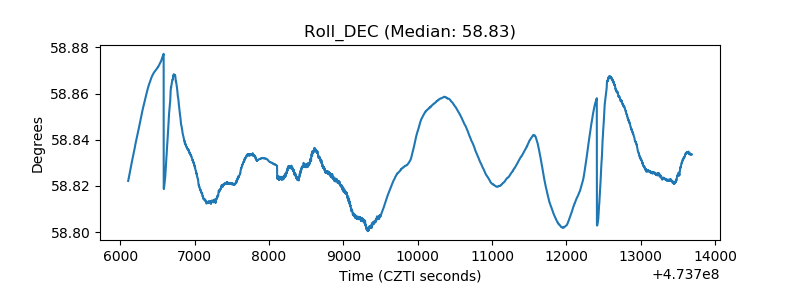 |
| _Roll_RA | 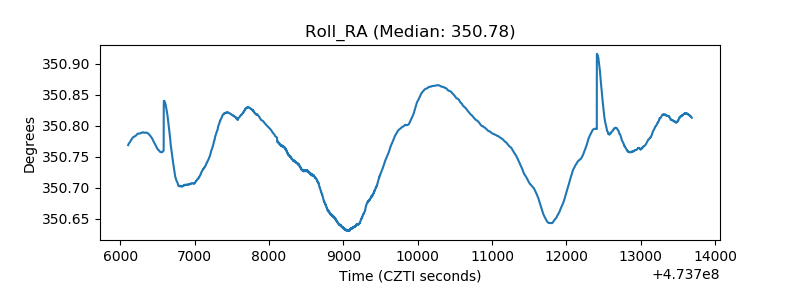 |
| Veto Counter | 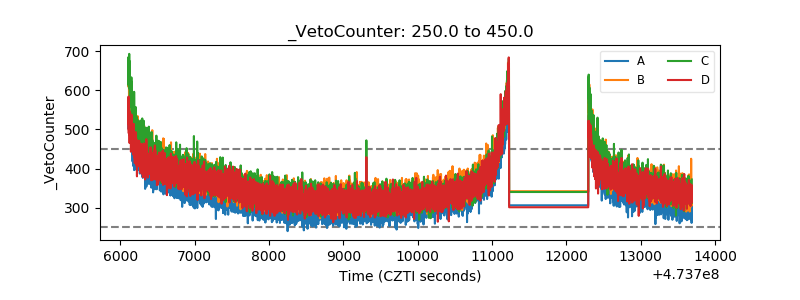 |