| Param | Original file | Final file |
|---|---|---|
| Filename | modeM0/AS1C09_003T01_9000006442_50147cztM0_level2.fits | modeM0/AS1C09_003T01_9000006442_50147cztM0_level2_quad_clean.evt |
| Size (bytes) | 1,042,680,960 | 73,681,920 |
| Size | 994.4 MB | 70.3 MB |
| Events in quadrant A | 7,254,610 | 540,942 |
| Events in quadrant B | 3,769,085 | 693,112 |
| Events in quadrant C | 15,102,612 | 139,142 |
| Events in quadrant D | 11,936,370 | 375,529 |
| Mode M9 | |||
|---|---|---|---|
| Quadrant | BADHDUFLAG | Total packets | Discarded packets |
| A | 0 | 7 | 0 |
| B | 0 | 7 | 0 |
| C | 0 | 7 | 0 |
| D | 0 | 7 | 0 |
| Mode M0 | |||
|---|---|---|---|
| Quadrant | BADHDUFLAG | Total packets | Discarded packets |
| A | 0 | 26209 | 3 |
| B | 0 | 16101 | 3 |
| C | 0 | 49606 | 3 |
| D | 0 | 40296 | 3 |
| Mode SS | |||
|---|---|---|---|
| Quadrant | BADHDUFLAG | Total packets | Discarded packets |
| A | 0 | 142 | 0 |
| B | 0 | 142 | 0 |
| C | 0 | 142 | 0 |
| D | 0 | 142 | 0 |
| Quadrant | Total seconds | Saturated seconds | Saturation percentage |
|---|---|---|---|
| A | 6911 | 1318 | 19.071046% |
| B | 6912 | 164 | 2.372685% |
| C | 6911 | 5610 | 81.174939% |
| D | 6911 | 2886 | 41.759514% |
Noise dominated data is calculated using 1-second bins in cleaned event files. If a bin has >2000 counts, and if more than 50% of those come from <1% of pixels, then it is considered to be noise-dominated and hence unusable.
| Quadrant | # 1 sec bins | Bins with >0 counts | Bins with >2000 counts | High rate bins dominated by noise | Noise dominated (total time) | Noise dominated (detector-on time) | Marked lightcurve |
|---|---|---|---|---|---|---|---|
| A | 7701 | 6912 | 1106 | 1106 | 14.36% | 16.00% | 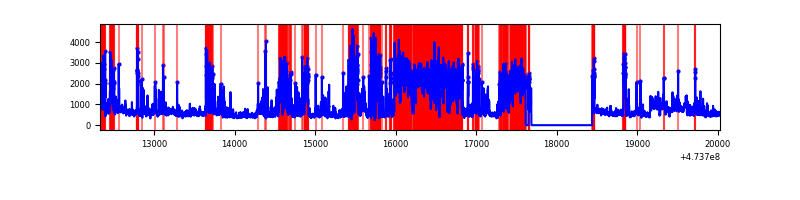 |
| B | 7702 | 6914 | 66 | 66 | 0.86% | 0.95% | 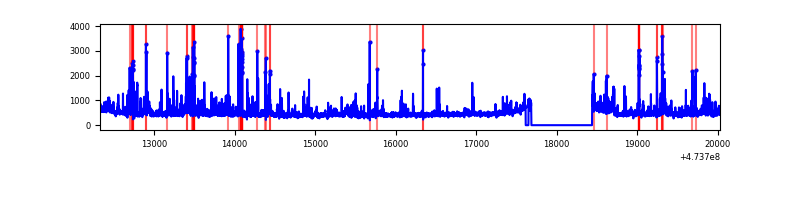 |
| C | 7701 | 6912 | 4728 | 4728 | 61.39% | 68.40% | 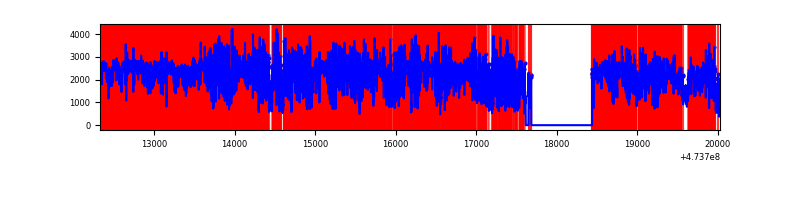 |
| D | 7700 | 6912 | 2724 | 2724 | 35.38% | 39.41% | 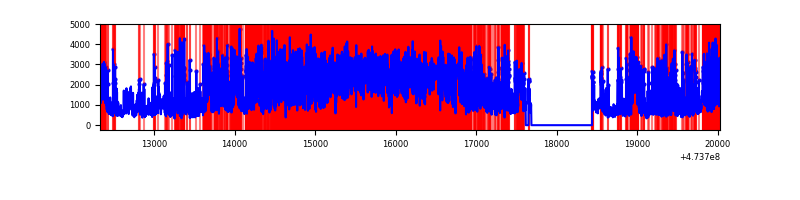 |
Top three noisy pixels from each quadrant. If the there are fewer than three noisy pixels in the level2.evt file, extra rows are filled as -1
| Pixel properties | Quadrant properties | ||||||
|---|---|---|---|---|---|---|---|
| Quadrant | DetID | PixID | Counts | Sigma | Mean | Median | Sigma |
| A | 0 | 98 | 2497122 | 14842.24 | 672 | 658 | 168.2 |
| A | 8 | 8 | 310040 | 1839.37 | 672 | 658 | 168.2 |
| A | 12 | 250 | 283421 | 1681.11 | 672 | 658 | 168.2 |
| B | 4 | 206 | 171004 | 1119.84 | 713 | 687 | 152.1 |
| B | 0 | 213 | 90852 | 592.84 | 713 | 687 | 152.1 |
| B | 5 | 185 | 79258 | 516.61 | 713 | 687 | 152.1 |
| C | 4 | 111 | 8827000 | 91452.41 | 345 | 343 | 96.5 |
| C | 15 | 147 | 1109844 | 11495.47 | 345 | 343 | 96.5 |
| C | 15 | 213 | 989783 | 10251.52 | 345 | 343 | 96.5 |
| D | 15 | 168 | 3362145 | 19811.87 | 598 | 579 | 169.7 |
| D | 15 | 106 | 1892879 | 11152.54 | 598 | 579 | 169.7 |
| D | 12 | 6 | 586611 | 3453.86 | 598 | 579 | 169.7 |
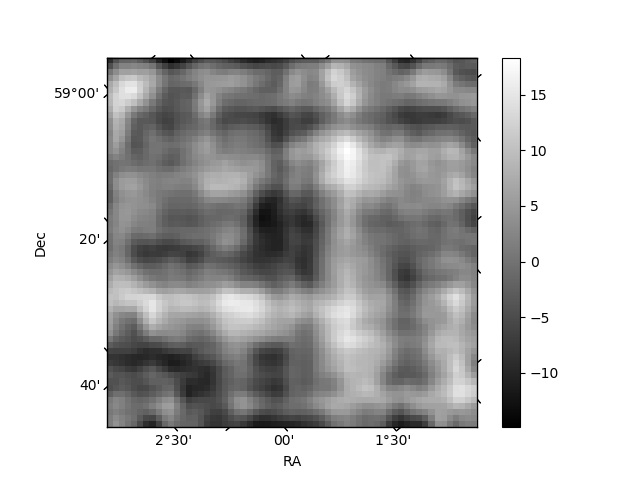
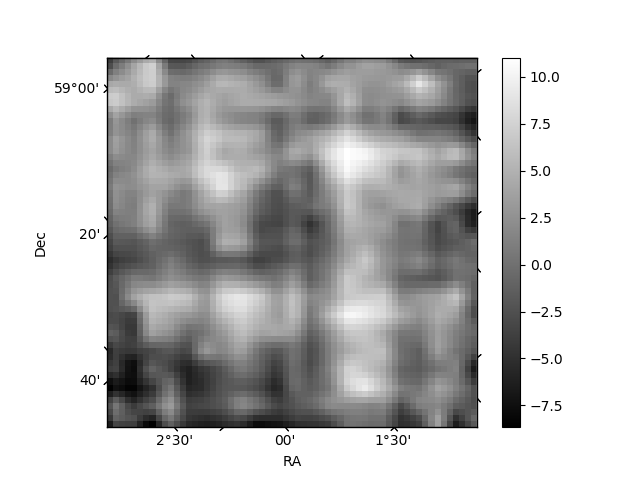
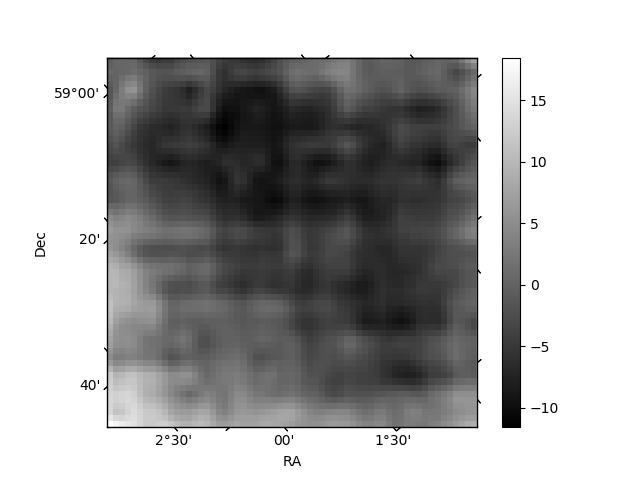
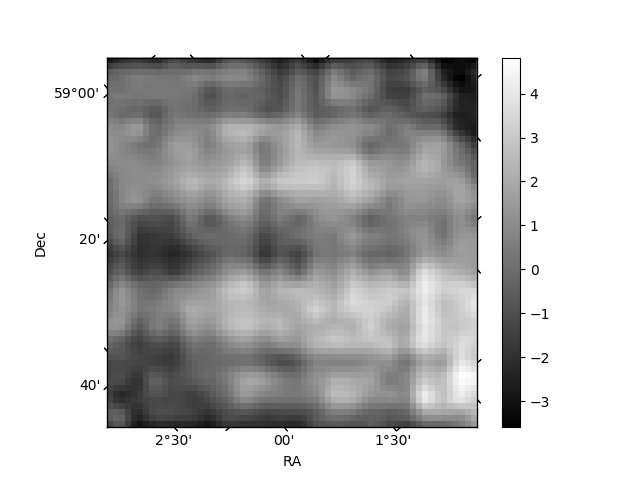
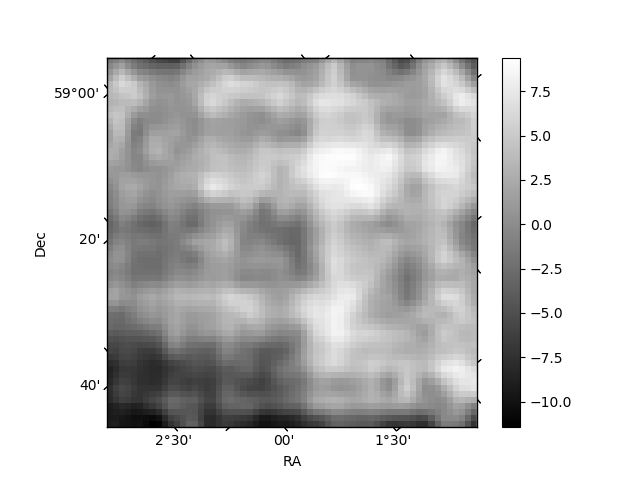
Histogram calculated using DETX and DETY for each event in the final _common_clean file
| Quadrant A | 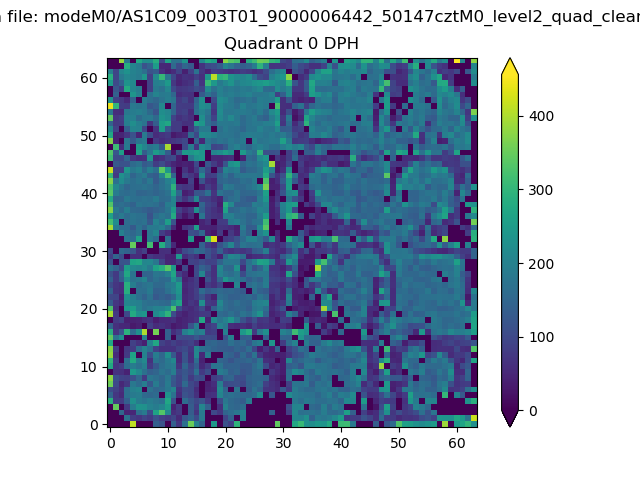 |
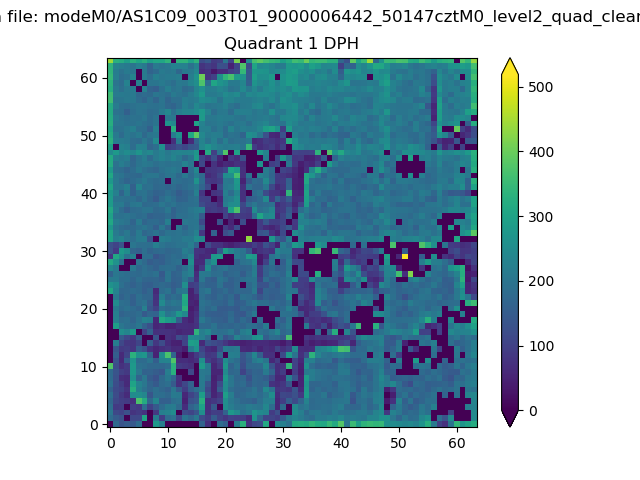 |
Quadrant B |
|---|---|---|---|
| Quadrant D | 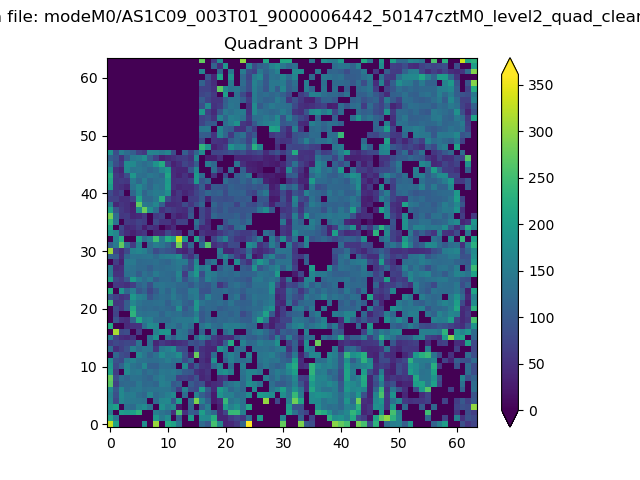 |
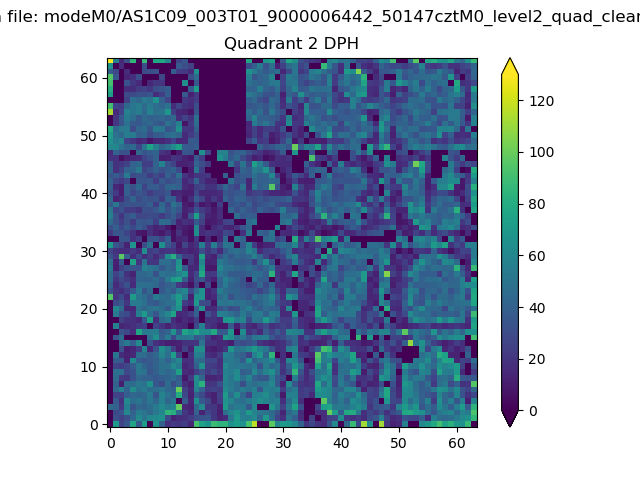 |
Quadrant C |
| Plot type | Count rate plots | Images |
|---|---|---|
| Comparison with Poisson distribution Blue bars denote a histogram of data divided into 1 sec bins. Red curve is a Poisson curve with rate = median count rate of data. |
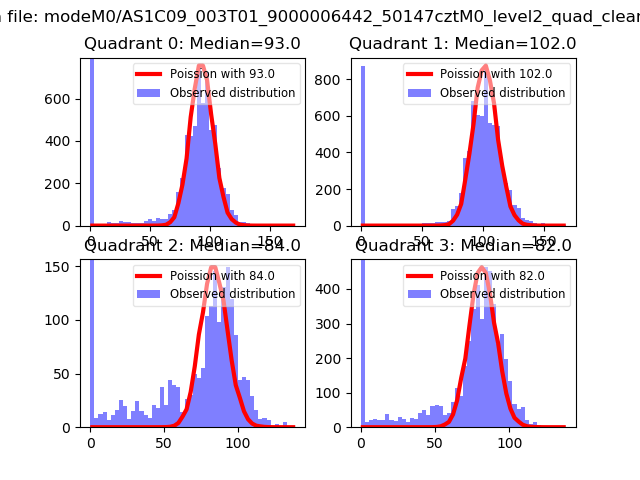 |
 |
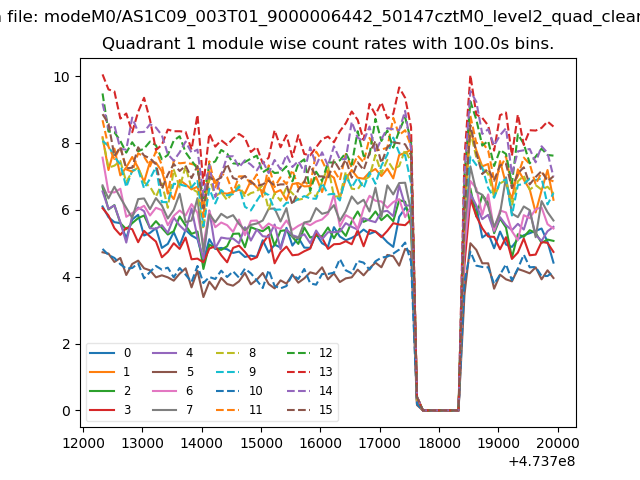
| Quadrant-wise count rates Data is divided into 100 sec bins |
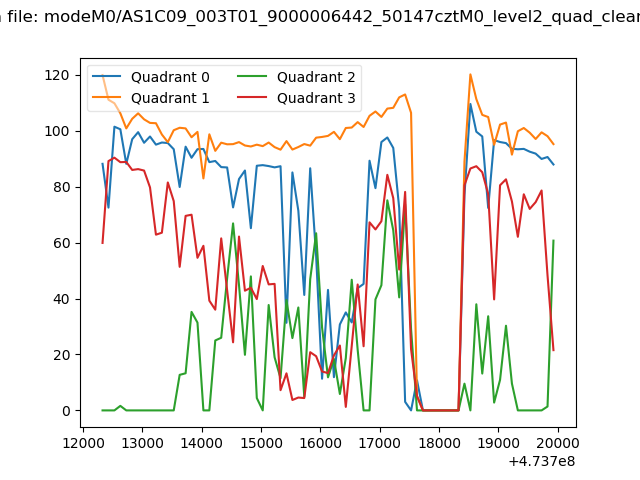 |
|
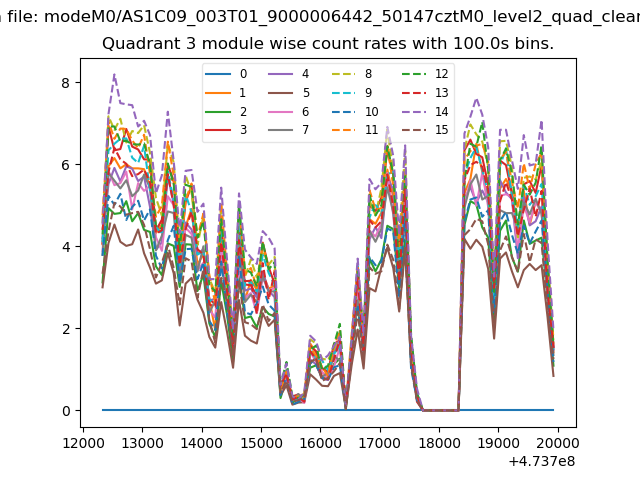
| Module-wise count rates for Quadrant A Data is divided into 100 sec bins |
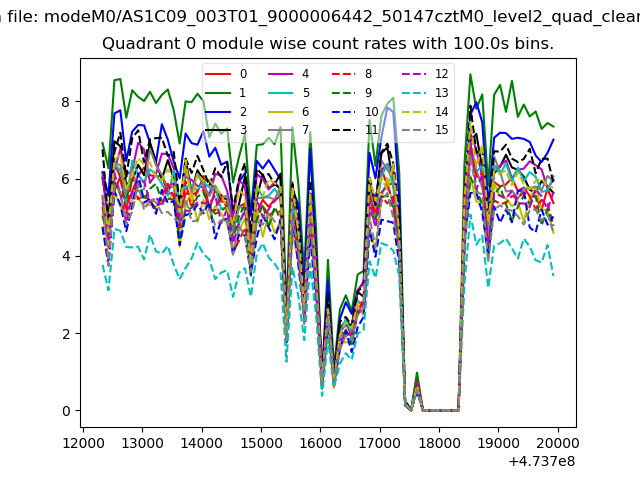 |
 |
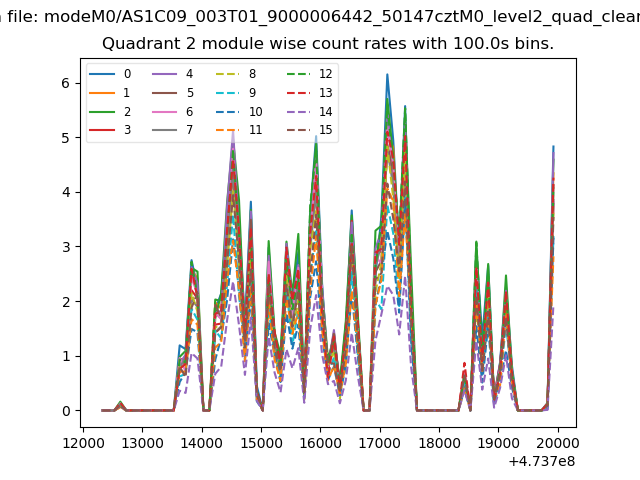
| Module-wise count rates for Quadrant B Data is divided into 100 sec bins |
 |
 |
| Module-wise count rates for Quadrant C Data is divided into 100 sec bins |
 |
 |
| Module-wise count rates for Quadrant D Data is divided into 100 sec bins |
 |
 |
| Parameter | Plot |
|---|---|
| CZT HV Monitor | 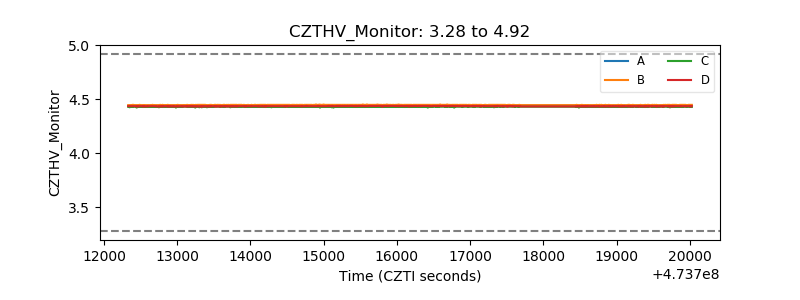 |
| D_VDD | 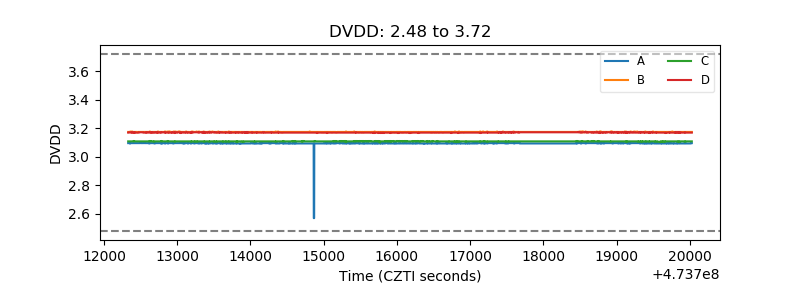 |
| Temperature 1 |  |
| Veto HV Monitor | 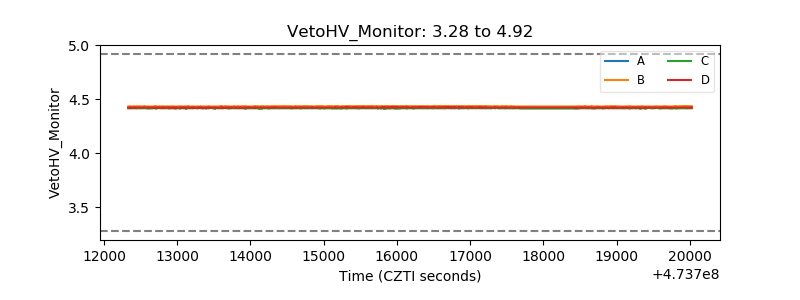 |
| Veto LLD | 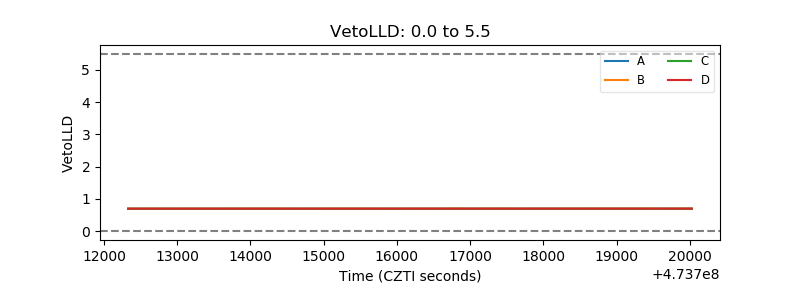 |
| Alpha Counter | 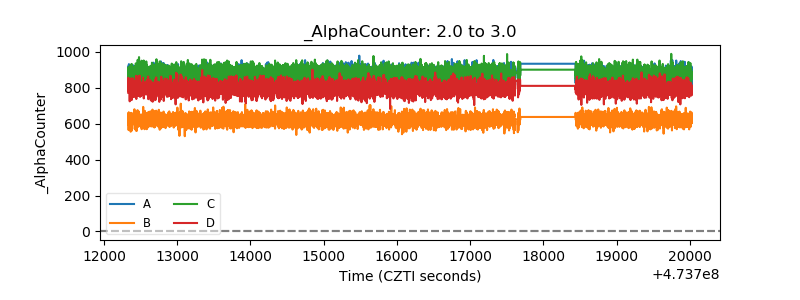 |
| _CPM_Rate | 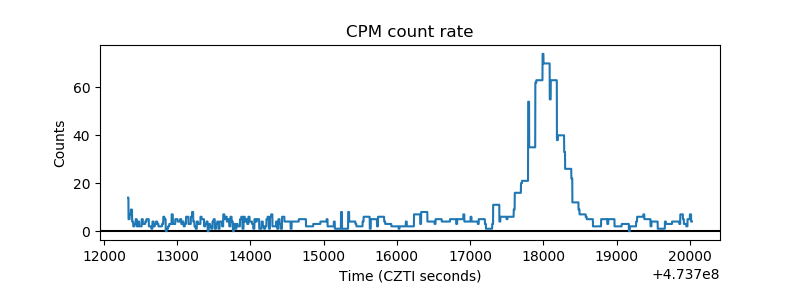 |
| CZT Counter | 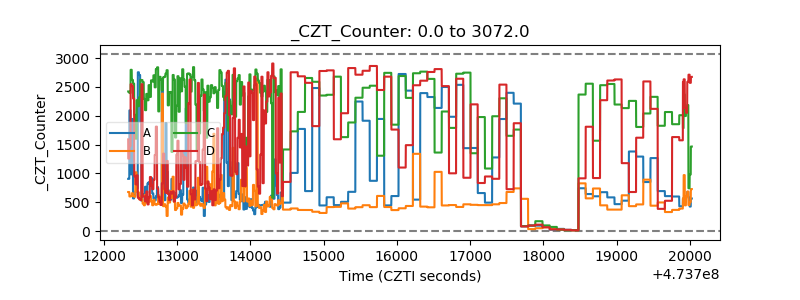 |
| +2.5 Volts monitor |  |
| +5 Volts monitor |  |
| _ROLL_ROT | 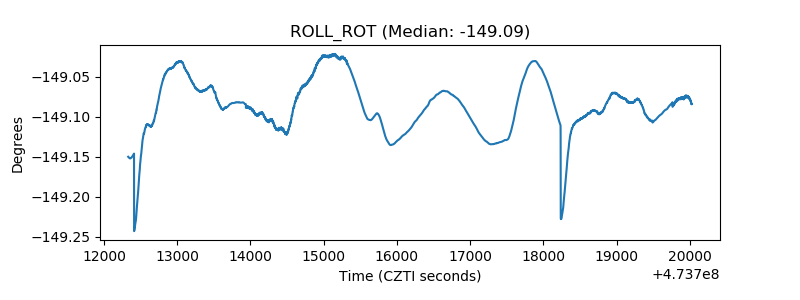 |
| _Roll_DEC | 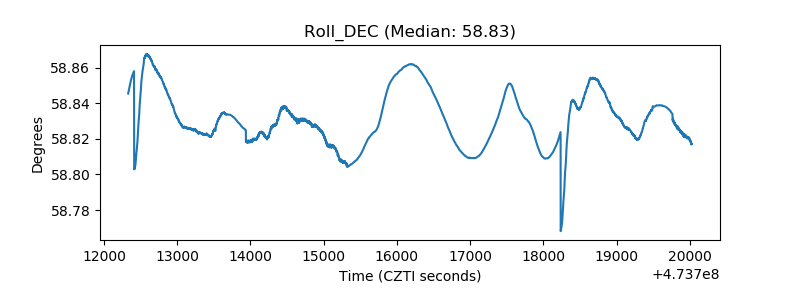 |
| _Roll_RA | 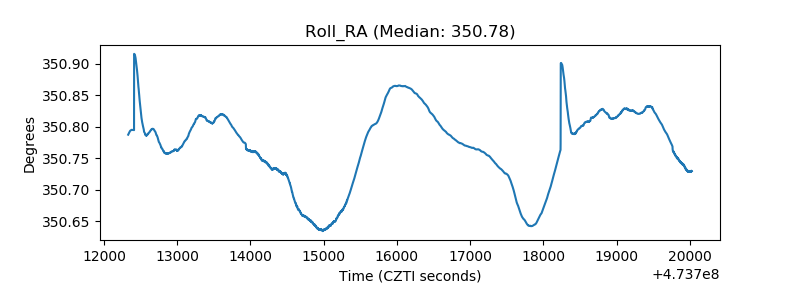 |
| Veto Counter | 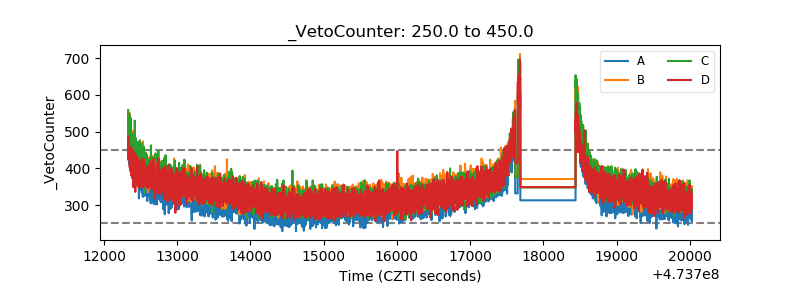 |