| Param | Original file | Final file |
|---|---|---|
| Filename | modeM0/AS1C09_003T01_9000006442_50148cztM0_level2.fits | modeM0/AS1C09_003T01_9000006442_50148cztM0_level2_quad_clean.evt |
| Size (bytes) | 1,306,085,760 | 72,288,000 |
| Size | 1.2 GB | 68.9 MB |
| Events in quadrant A | 9,186,901 | 558,628 |
| Events in quadrant B | 5,300,394 | 732,948 |
| Events in quadrant C | 16,541,425 | 141,020 |
| Events in quadrant D | 16,724,505 | 219,933 |
| Mode M9 | |||
|---|---|---|---|
| Quadrant | BADHDUFLAG | Total packets | Discarded packets |
| A | 0 | 1 | 0 |
| B | 0 | 1 | 0 |
| C | 0 | 2 | 0 |
| D | 0 | 2 | 0 |
| Mode M0 | |||
|---|---|---|---|
| Quadrant | BADHDUFLAG | Total packets | Discarded packets |
| A | 0 | 32545 | 3 |
| B | 0 | 21091 | 3 |
| C | 0 | 54406 | 3 |
| D | 0 | 55018 | 4 |
| Mode SS | |||
|---|---|---|---|
| Quadrant | BADHDUFLAG | Total packets | Discarded packets |
| A | 0 | 156 | 0 |
| B | 0 | 156 | 0 |
| C | 0 | 156 | 0 |
| D | 0 | 156 | 0 |
| Quadrant | Total seconds | Saturated seconds | Saturation percentage |
|---|---|---|---|
| A | 7702 | 1932 | 25.084394% |
| B | 7702 | 617 | 8.010906% |
| C | 7702 | 6333 | 82.225396% |
| D | 7701 | 5483 | 71.198546% |
Noise dominated data is calculated using 1-second bins in cleaned event files. If a bin has >2000 counts, and if more than 50% of those come from <1% of pixels, then it is considered to be noise-dominated and hence unusable.
| Quadrant | # 1 sec bins | Bins with >0 counts | Bins with >2000 counts | High rate bins dominated by noise | Noise dominated (total time) | Noise dominated (detector-on time) | Marked lightcurve |
|---|---|---|---|---|---|---|---|
| A | 7767 | 7703 | 1532 | 1532 | 19.72% | 19.89% | 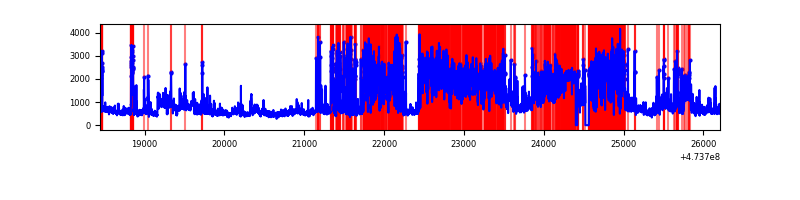 |
| B | 7767 | 7704 | 314 | 314 | 4.04% | 4.08% | 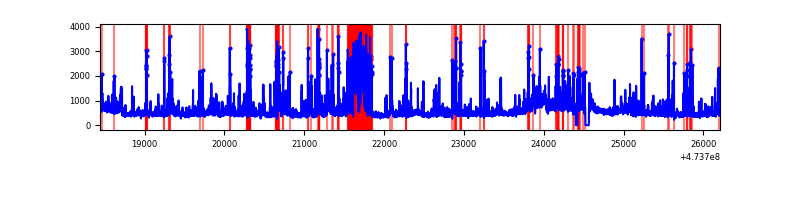 |
| C | 7766 | 7701 | 5088 | 5088 | 65.52% | 66.07% | 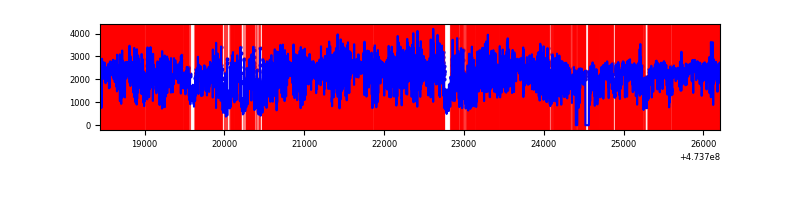 |
| D | 7766 | 7702 | 5121 | 5121 | 65.94% | 66.49% | 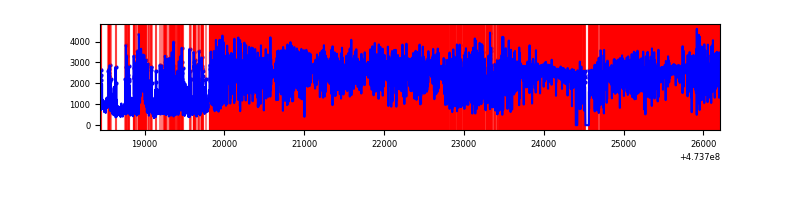 |
Top three noisy pixels from each quadrant. If the there are fewer than three noisy pixels in the level2.evt file, extra rows are filled as -1
| Pixel properties | Quadrant properties | ||||||
|---|---|---|---|---|---|---|---|
| Quadrant | DetID | PixID | Counts | Sigma | Mean | Median | Sigma |
| A | 0 | 98 | 2903673 | 15807.08 | 732 | 714 | 183.6 |
| A | 8 | 8 | 974972 | 5304.99 | 732 | 714 | 183.6 |
| A | 0 | 175 | 693217 | 3770.79 | 732 | 714 | 183.6 |
| B | 0 | 200 | 804062 | 4730.35 | 798 | 769 | 169.8 |
| B | 0 | 213 | 168342 | 986.79 | 798 | 769 | 169.8 |
| B | 1 | 255 | 167896 | 984.16 | 798 | 769 | 169.8 |
| C | 4 | 111 | 9408670 | 85201.24 | 385 | 381 | 110.4 |
| C | 15 | 230 | 1222627 | 11068.63 | 385 | 381 | 110.4 |
| C | 15 | 147 | 1070644 | 9692.28 | 385 | 381 | 110.4 |
| D | 15 | 168 | 3924485 | 25241.21 | 531 | 511 | 155.5 |
| D | 15 | 106 | 1898313 | 12207.73 | 531 | 511 | 155.5 |
| D | 15 | 142 | 1309648 | 8421.11 | 531 | 511 | 155.5 |
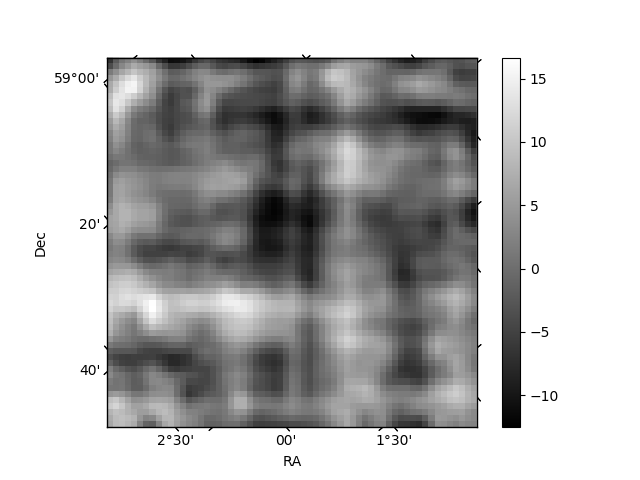
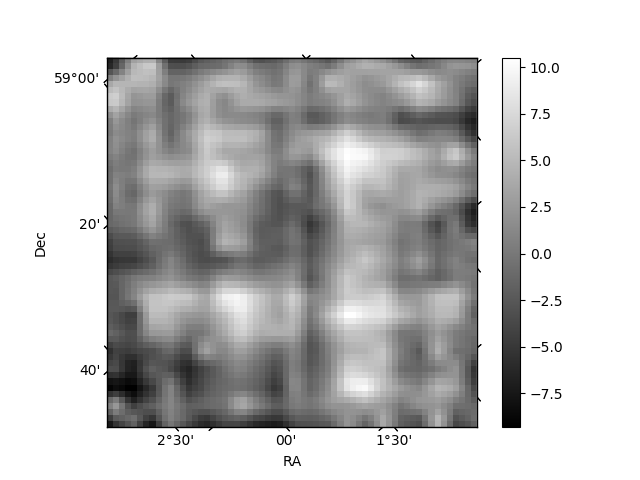
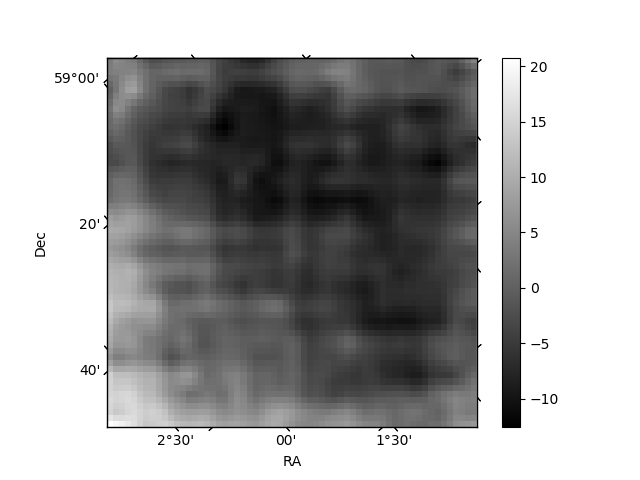
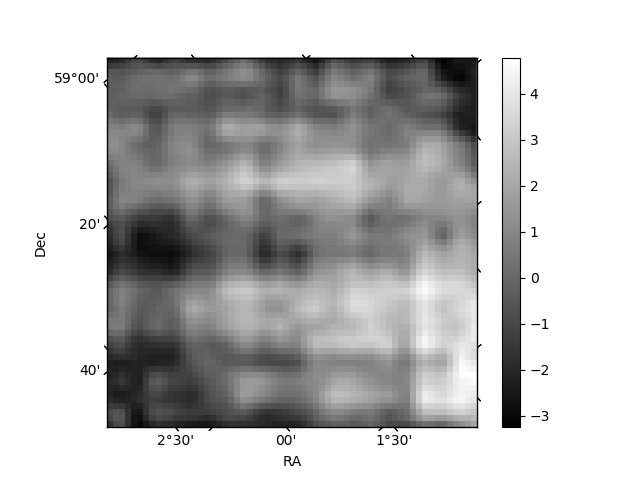
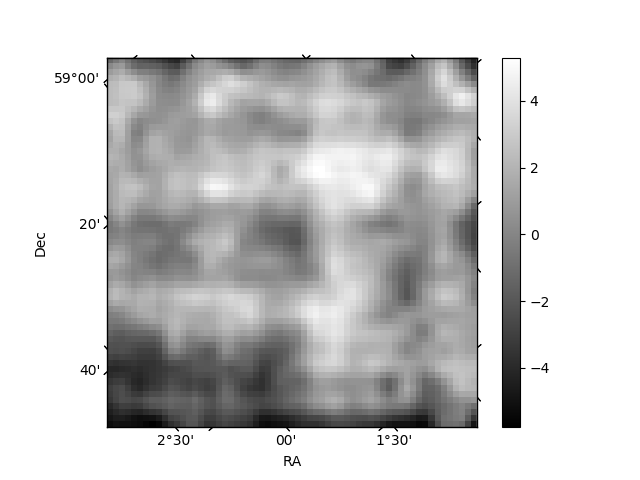
Histogram calculated using DETX and DETY for each event in the final _common_clean file
| Quadrant A | 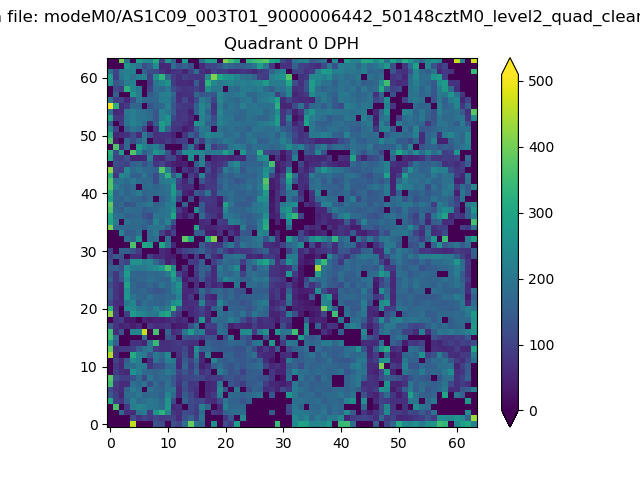 |
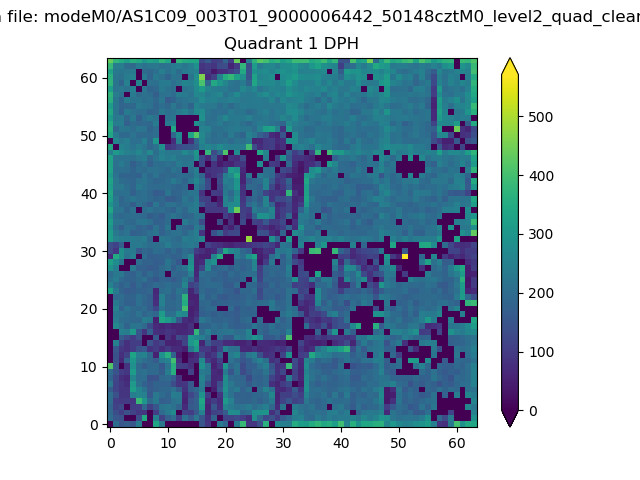 |
Quadrant B |
|---|---|---|---|
| Quadrant D | 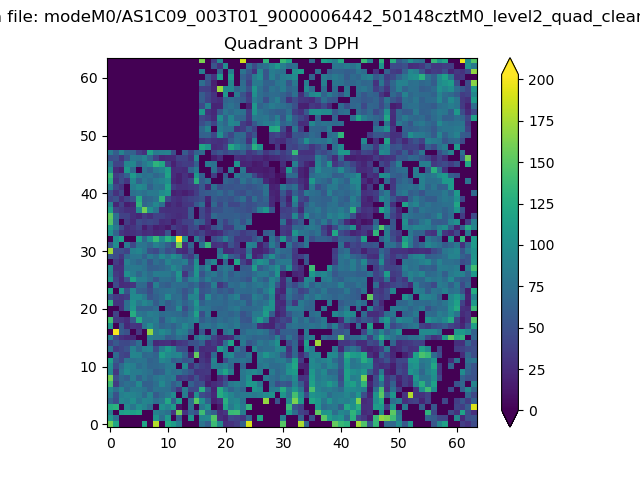 |
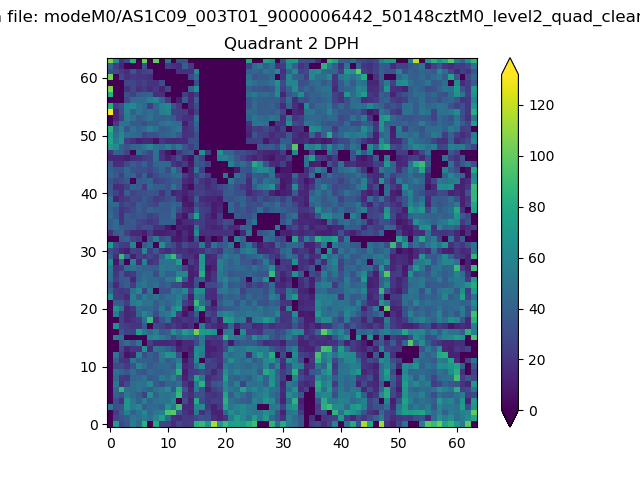 |
Quadrant C |
| Plot type | Count rate plots | Images |
|---|---|---|
| Comparison with Poisson distribution Blue bars denote a histogram of data divided into 1 sec bins. Red curve is a Poisson curve with rate = median count rate of data. |
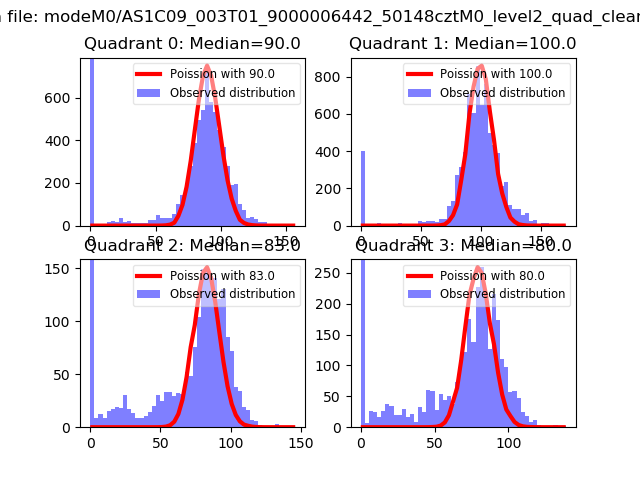 |
 |
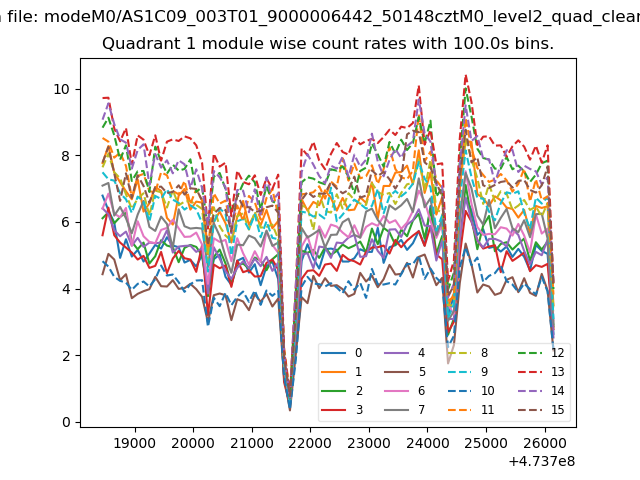
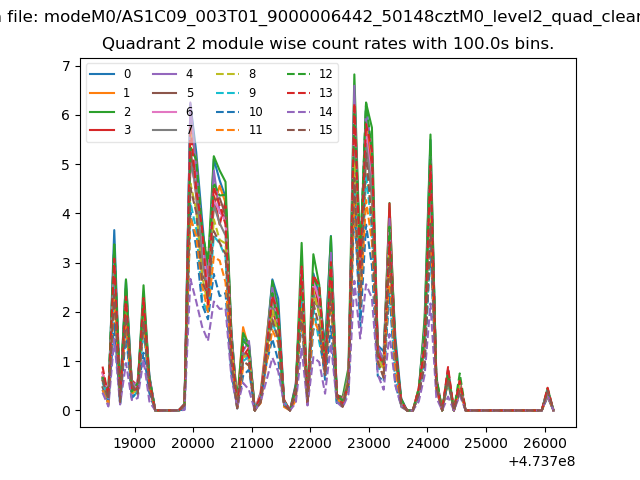
| Quadrant-wise count rates Data is divided into 100 sec bins |
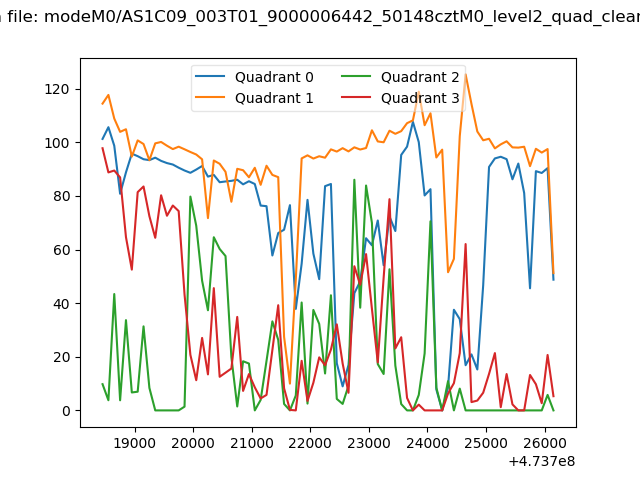 |
|
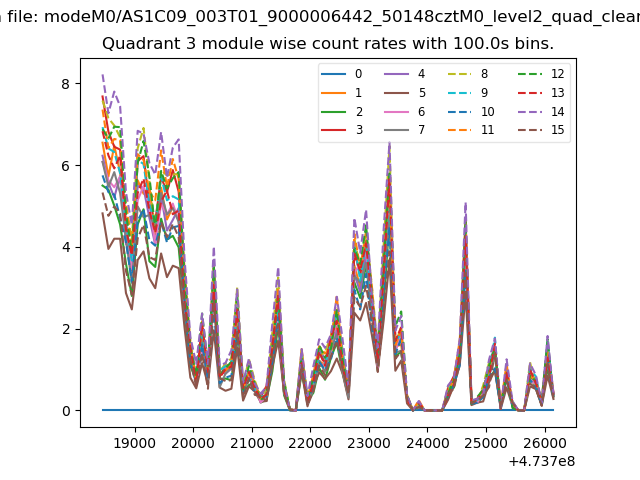
| Module-wise count rates for Quadrant A Data is divided into 100 sec bins |
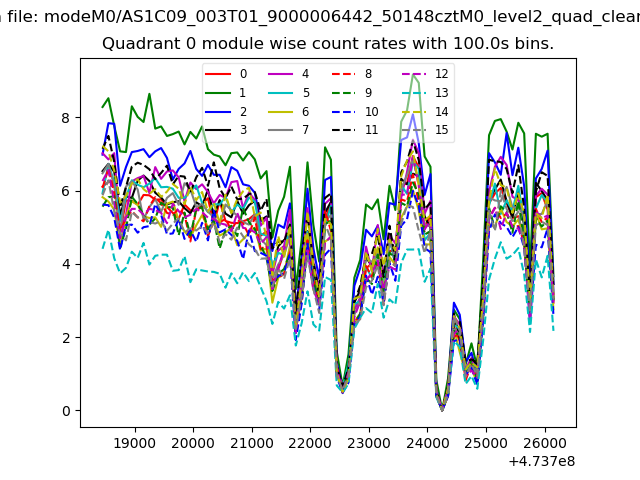 |
 |
| Module-wise count rates for Quadrant B Data is divided into 100 sec bins |
 |
 |
| Module-wise count rates for Quadrant C Data is divided into 100 sec bins |
 |
 |
| Module-wise count rates for Quadrant D Data is divided into 100 sec bins |
 |
 |
| Parameter | Plot |
|---|---|
| CZT HV Monitor | 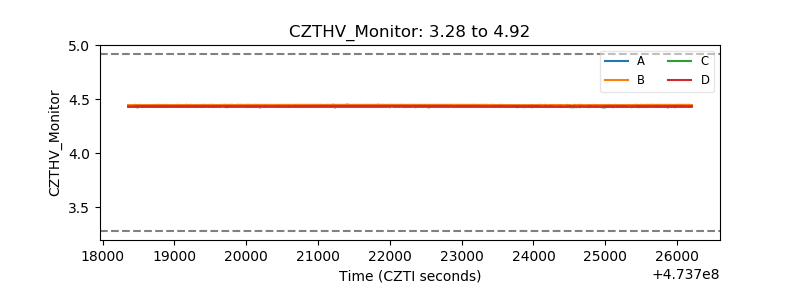 |
| D_VDD | 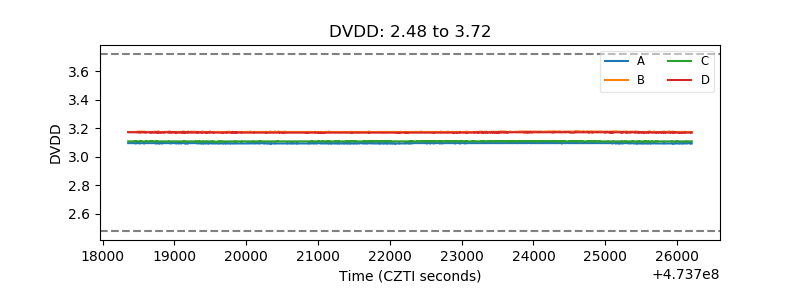 |
| Temperature 1 | 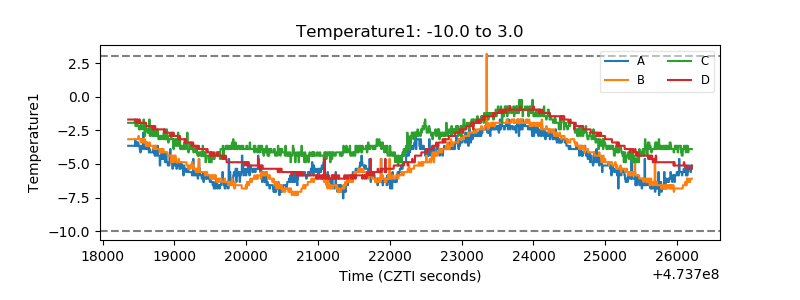 |
| Veto HV Monitor | 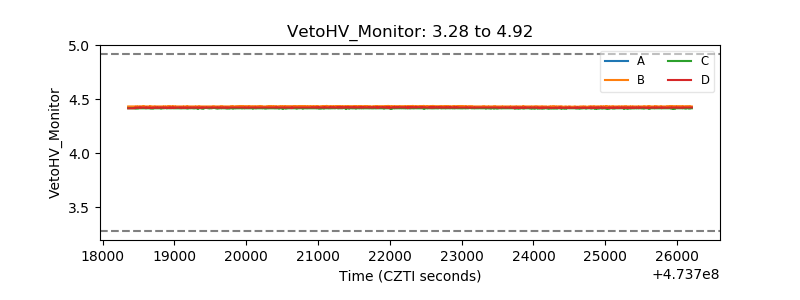 |
| Veto LLD | 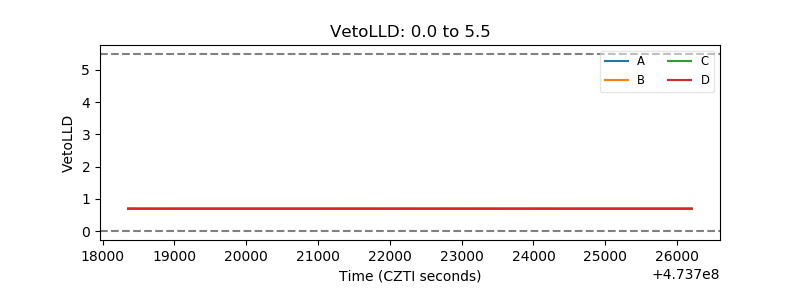 |
| Alpha Counter | 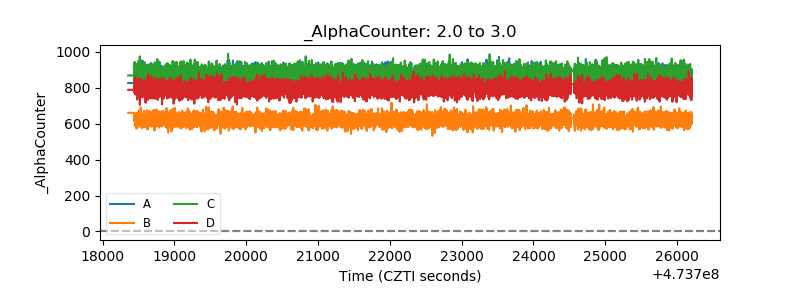 |
| _CPM_Rate | 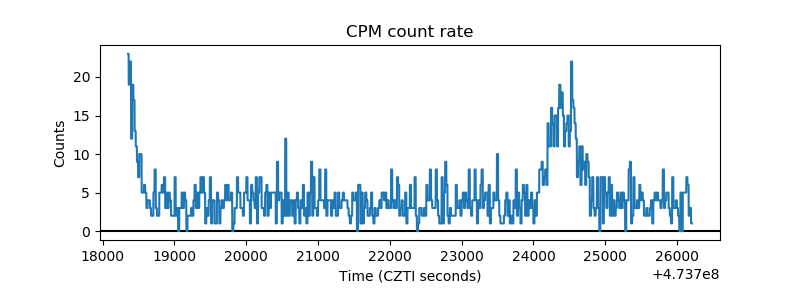 |
| CZT Counter | 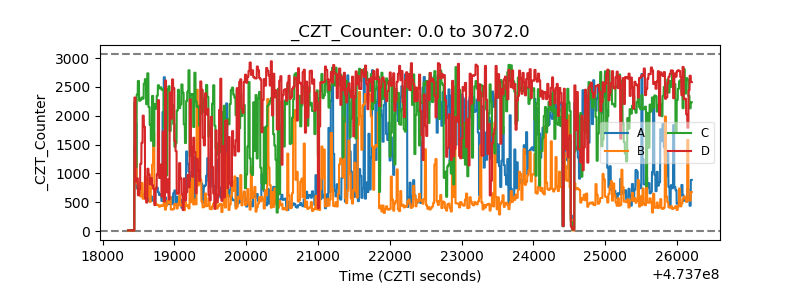 |
| +2.5 Volts monitor |  |
| +5 Volts monitor | 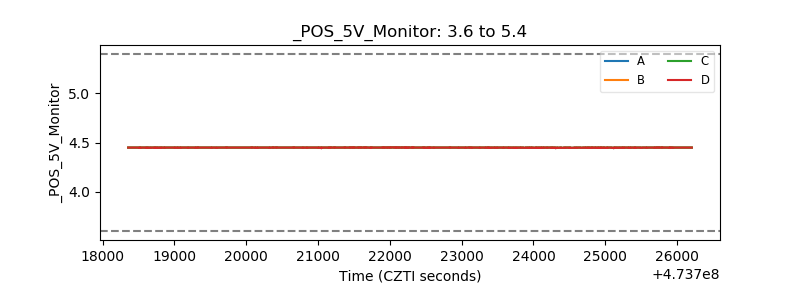 |
| _ROLL_ROT | 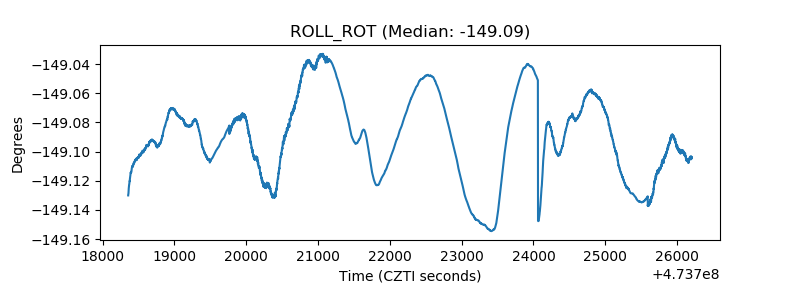 |
| _Roll_DEC | 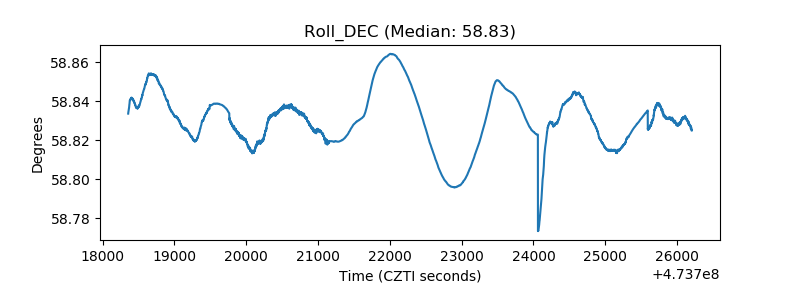 |
| _Roll_RA | 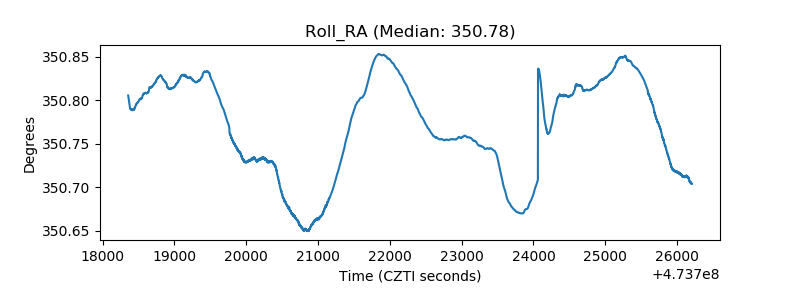 |
| Veto Counter | 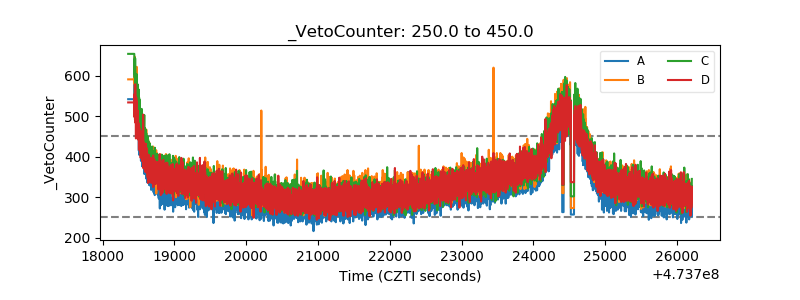 |