| Param | Original file | Final file |
|---|---|---|
| Filename | modeM0/AS1C09_003T01_9000006442_50149cztM0_level2.fits | modeM0/AS1C09_003T01_9000006442_50149cztM0_level2_quad_clean.evt |
| Size (bytes) | 1,462,979,520 | 74,208,960 |
| Size | 1.4 GB | 70.8 MB |
| Events in quadrant A | 12,783,287 | 513,130 |
| Events in quadrant B | 4,916,408 | 794,499 |
| Events in quadrant C | 15,923,085 | 267,354 |
| Events in quadrant D | 19,909,005 | 108,076 |
| Mode M0 | |||
|---|---|---|---|
| Quadrant | BADHDUFLAG | Total packets | Discarded packets |
| A | 0 | 43633 | 0 |
| B | 0 | 20197 | 0 |
| C | 0 | 52803 | 0 |
| D | 0 | 64712 | 0 |
| Mode SS | |||
|---|---|---|---|
| Quadrant | BADHDUFLAG | Total packets | Discarded packets |
| A | 0 | 162 | 0 |
| B | 0 | 162 | 0 |
| C | 0 | 162 | 0 |
| D | 0 | 162 | 0 |
| Quadrant | Total seconds | Saturated seconds | Saturation percentage |
|---|---|---|---|
| A | 8103 | 2957 | 36.492657% |
| B | 8103 | 190 | 2.344811% |
| C | 8104 | 5372 | 66.288253% |
| D | 8104 | 7082 | 87.388944% |
Noise dominated data is calculated using 1-second bins in cleaned event files. If a bin has >2000 counts, and if more than 50% of those come from <1% of pixels, then it is considered to be noise-dominated and hence unusable.
| Quadrant | # 1 sec bins | Bins with >0 counts | Bins with >2000 counts | High rate bins dominated by noise | Noise dominated (total time) | Noise dominated (detector-on time) | Marked lightcurve |
|---|---|---|---|---|---|---|---|
| A | 8102 | 8102 | 2641 | 2641 | 32.60% | 32.60% | 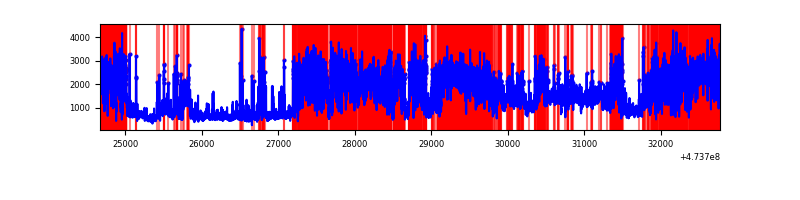 |
| B | 8103 | 8103 | 135 | 135 | 1.67% | 1.67% | 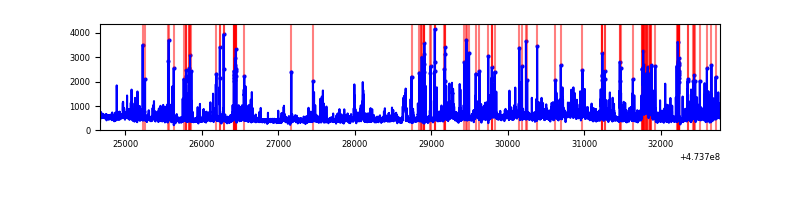 |
| C | 8104 | 8104 | 4504 | 4504 | 55.58% | 55.58% | 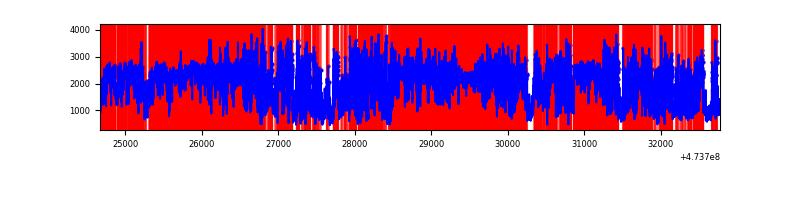 |
| D | 8103 | 8103 | 6729 | 6729 | 83.04% | 83.04% | 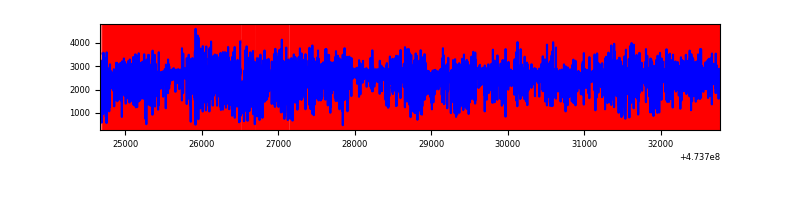 |
Top three noisy pixels from each quadrant. If the there are fewer than three noisy pixels in the level2.evt file, extra rows are filled as -1
| Pixel properties | Quadrant properties | ||||||
|---|---|---|---|---|---|---|---|
| Quadrant | DetID | PixID | Counts | Sigma | Mean | Median | Sigma |
| A | 0 | 98 | 5069802 | 27123.65 | 736 | 715 | 186.9 |
| A | 8 | 8 | 1868197 | 9992.52 | 736 | 715 | 186.9 |
| A | 12 | 250 | 659709 | 3526.14 | 736 | 715 | 186.9 |
| B | 4 | 206 | 265575 | 1523.32 | 825 | 798 | 173.8 |
| B | 3 | 249 | 189300 | 1084.49 | 825 | 798 | 173.8 |
| B | 1 | 255 | 172176 | 985.97 | 825 | 798 | 173.8 |
| C | 4 | 111 | 3600345 | 25929.4 | 493 | 490 | 138.8 |
| C | 15 | 197 | 2095177 | 15087.82 | 493 | 490 | 138.8 |
| C | 15 | 147 | 1840903 | 13256.31 | 493 | 490 | 138.8 |
| D | 15 | 168 | 6645622 | 45966.66 | 467 | 448 | 144.6 |
| D | 15 | 142 | 1715411 | 11862.91 | 467 | 448 | 144.6 |
| D | 15 | 185 | 1582967 | 10946.76 | 467 | 448 | 144.6 |
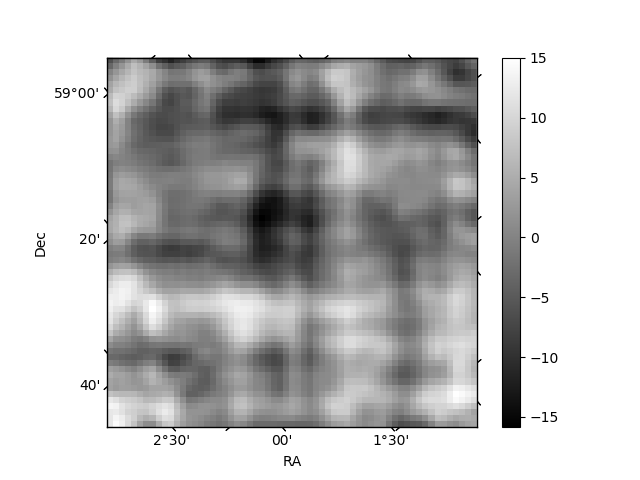
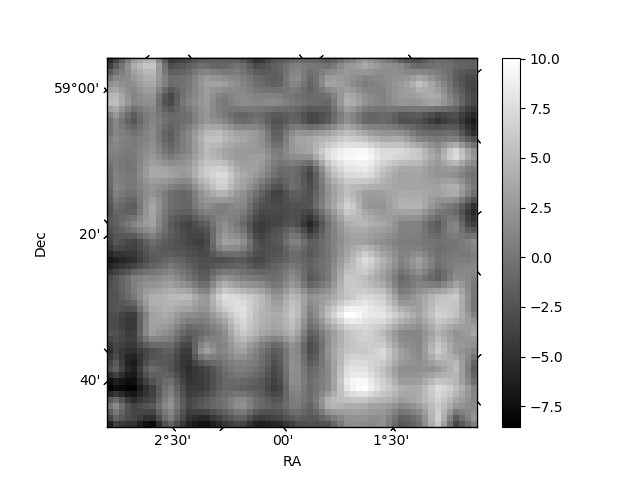
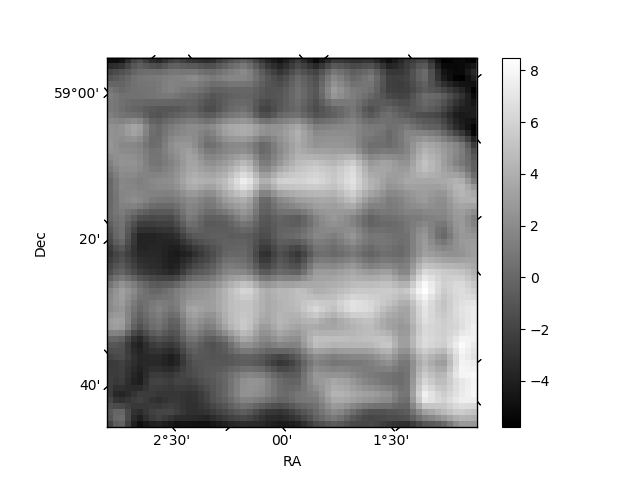
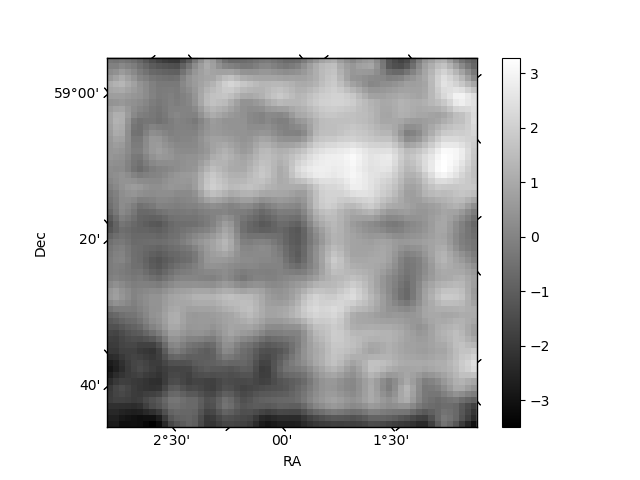
Histogram calculated using DETX and DETY for each event in the final _common_clean file
| Quadrant A | 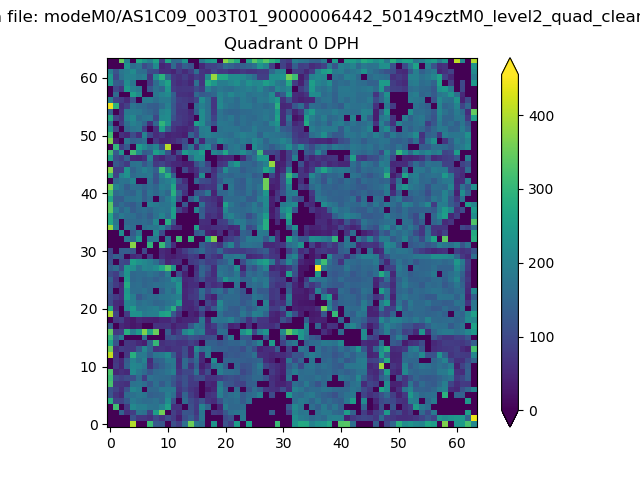 |
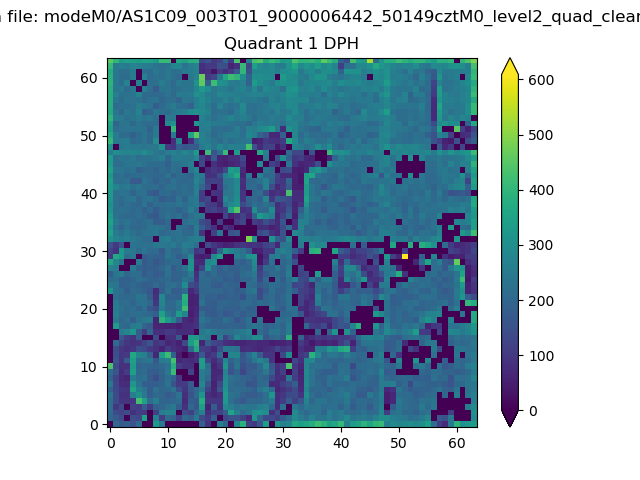 |
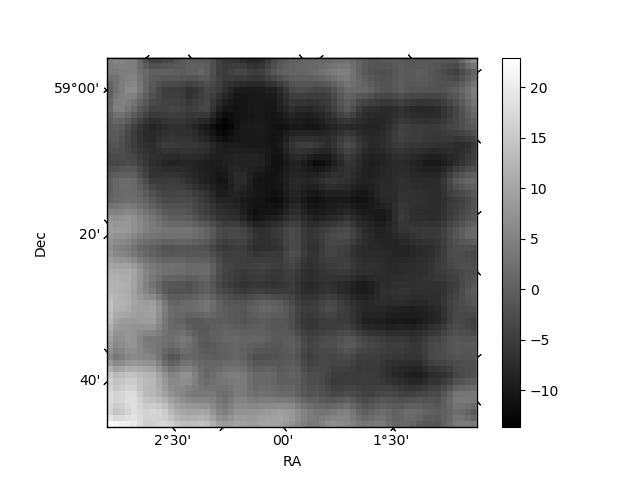
Quadrant B |
|---|---|---|---|
| Quadrant D | 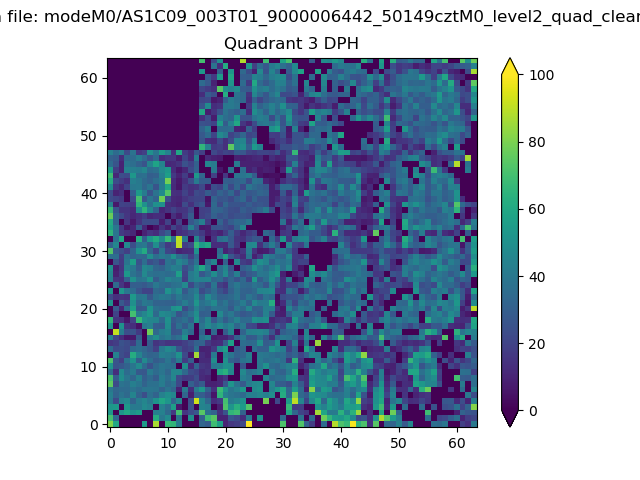 |
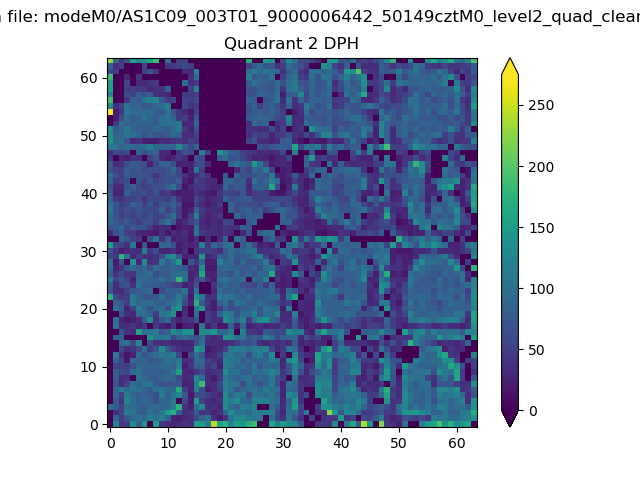 |
Quadrant C |
| Plot type | Count rate plots | Images |
|---|---|---|
| Comparison with Poisson distribution Blue bars denote a histogram of data divided into 1 sec bins. Red curve is a Poisson curve with rate = median count rate of data. |
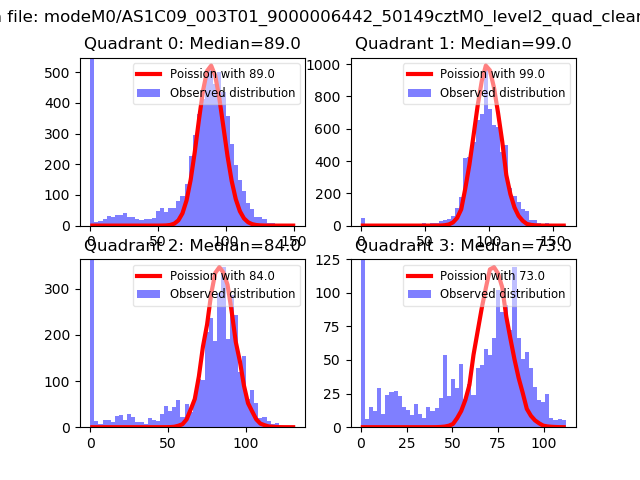 |
 |
| Quadrant-wise count rates Data is divided into 100 sec bins |
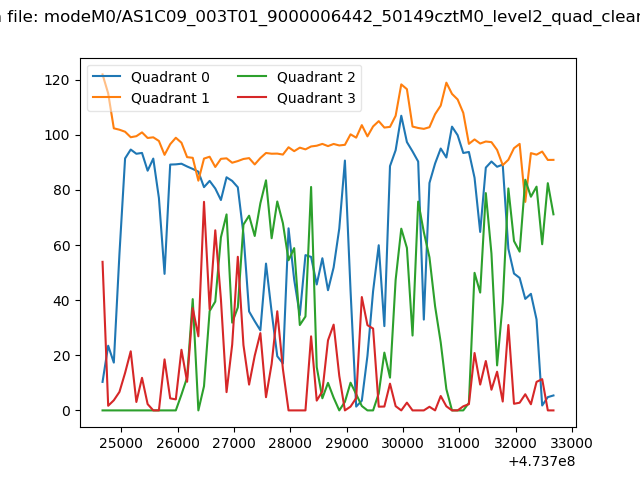 |
|
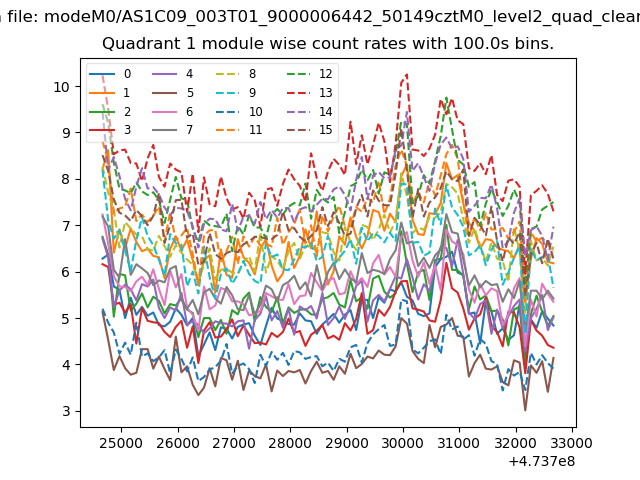
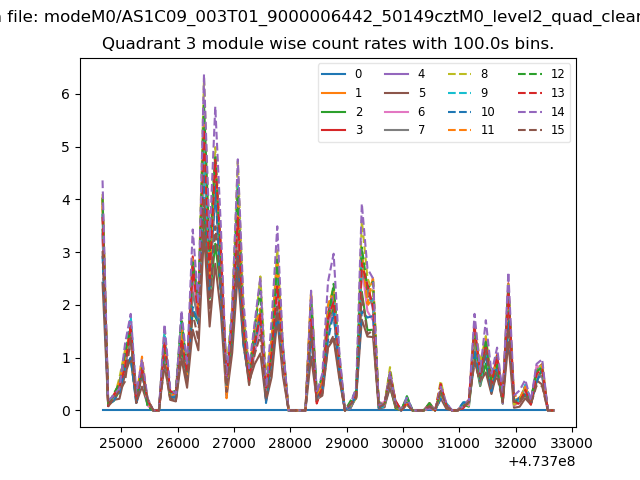
| Module-wise count rates for Quadrant A Data is divided into 100 sec bins |
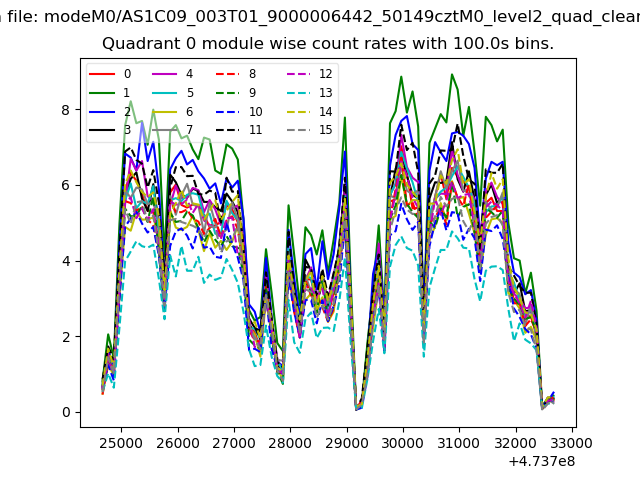 |
 |
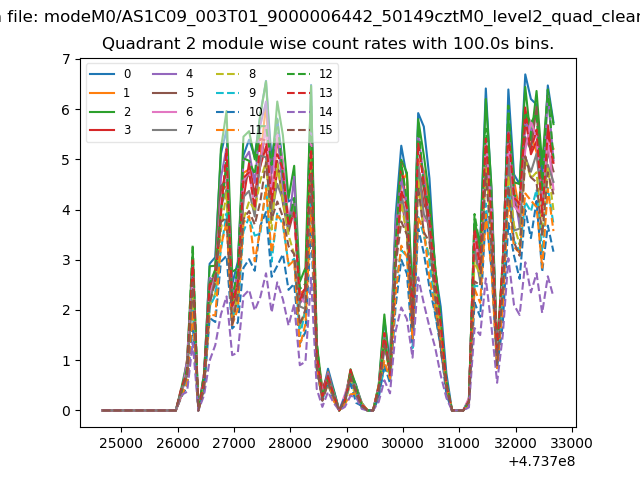
| Module-wise count rates for Quadrant B Data is divided into 100 sec bins |
 |
 |
| Module-wise count rates for Quadrant C Data is divided into 100 sec bins |
 |
 |
| Module-wise count rates for Quadrant D Data is divided into 100 sec bins |
 |
 |
| Parameter | Plot |
|---|---|
| CZT HV Monitor | 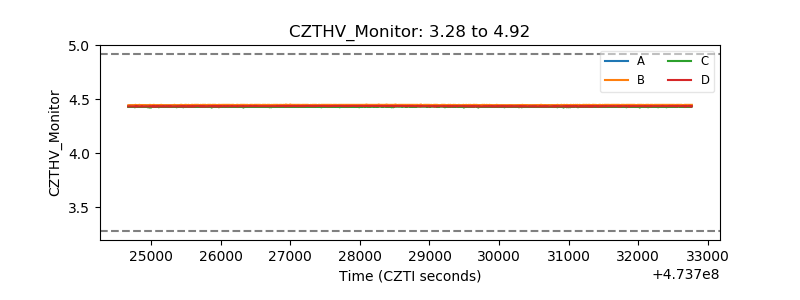 |
| D_VDD | 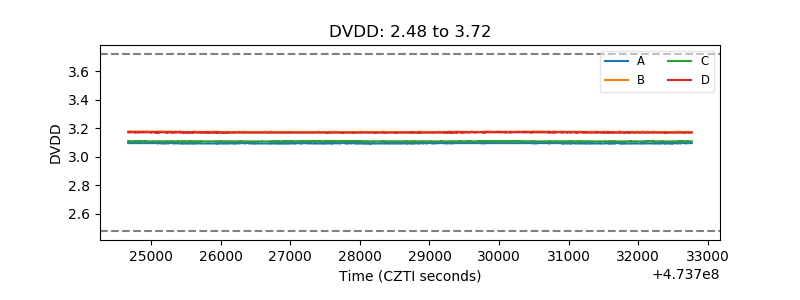 |
| Temperature 1 | 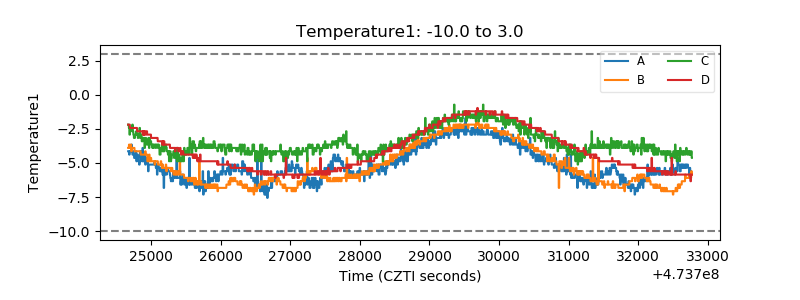 |
| Veto HV Monitor | 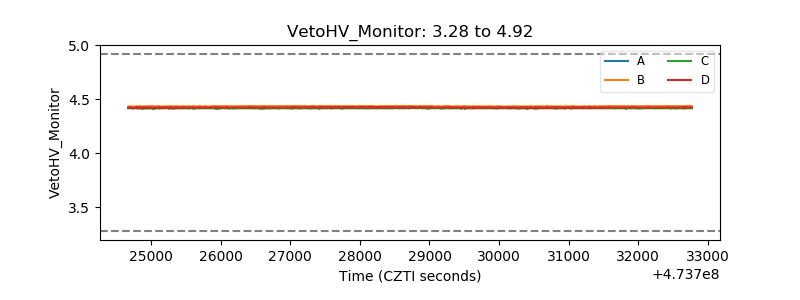 |
| Veto LLD | 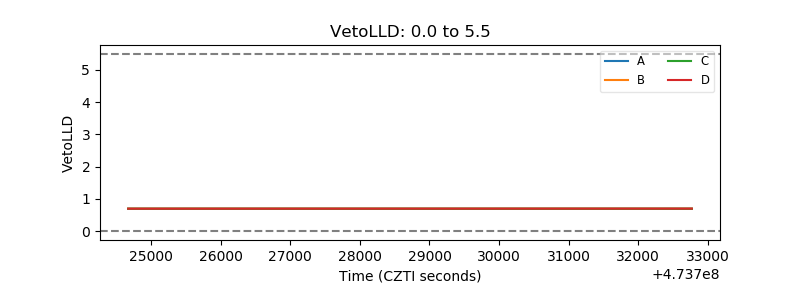 |
| Alpha Counter | 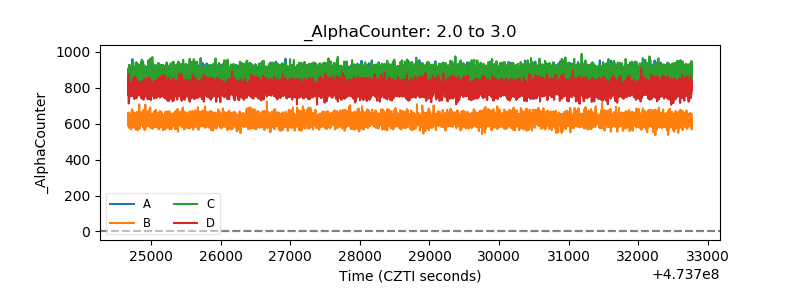 |
| _CPM_Rate | 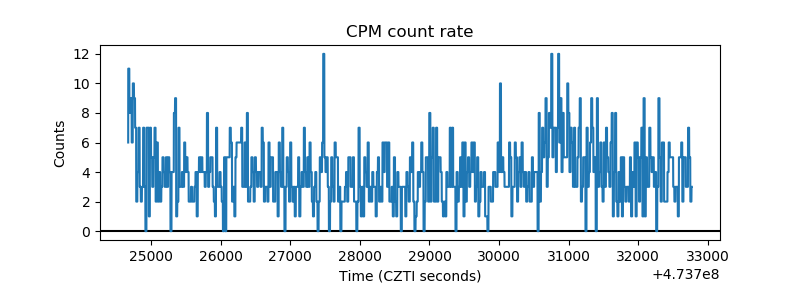 |
| CZT Counter | 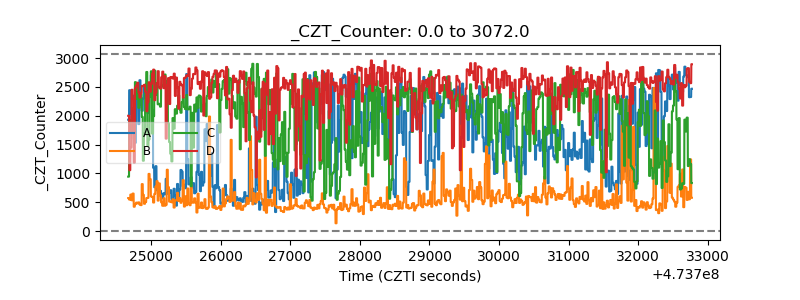 |
| +2.5 Volts monitor | 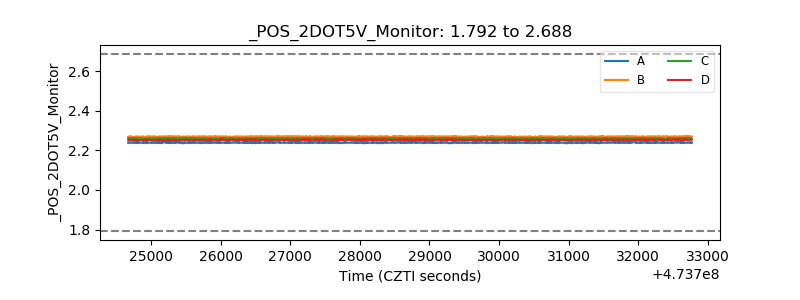 |
| +5 Volts monitor | 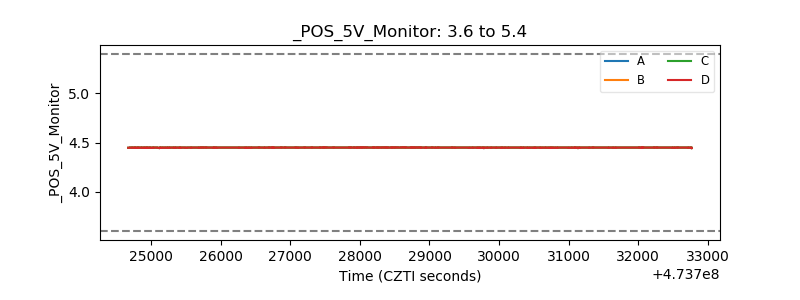 |
| _ROLL_ROT | 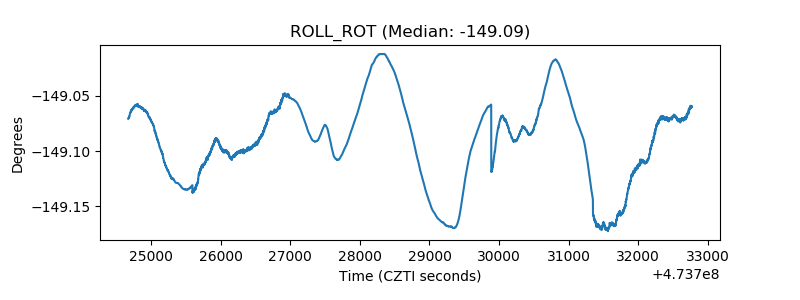 |
| _Roll_DEC | 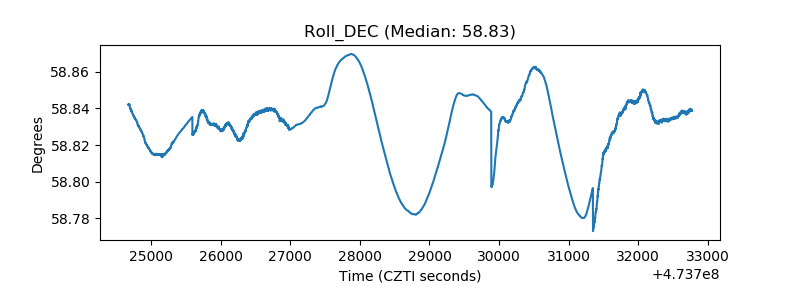 |
| _Roll_RA | 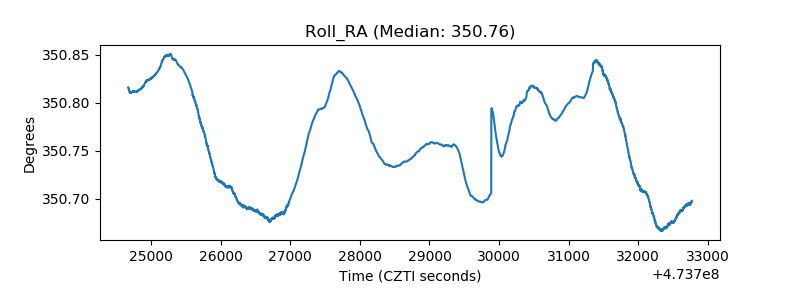 |
| Veto Counter | 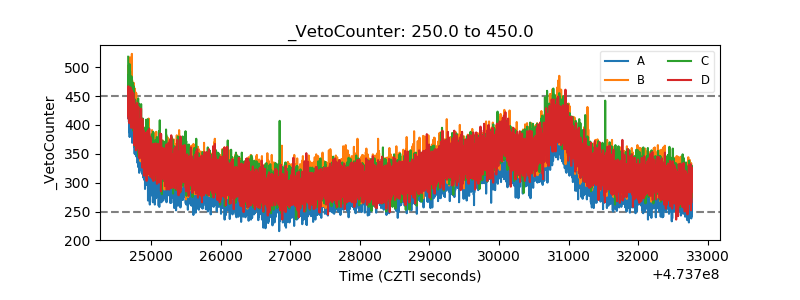 |