| Param | Original file | Final file |
|---|---|---|
| Filename | modeM0/AS1C09_003T01_9000006442_50153cztM0_level2.fits | modeM0/AS1C09_003T01_9000006442_50153cztM0_level2_quad_clean.evt |
| Size (bytes) | 3,754,900,800 | 139,870,080 |
| Size | 3.5 GB | 133.4 MB |
| Events in quadrant A | 38,009,007 | 679,651 |
| Events in quadrant B | 13,343,917 | 1,737,109 |
| Events in quadrant C | 42,135,781 | 277,870 |
| Events in quadrant D | 44,074,402 | 249,742 |
| Mode M9 | |||
|---|---|---|---|
| Quadrant | BADHDUFLAG | Total packets | Discarded packets |
| A | 0 | 8 | 0 |
| B | 0 | 8 | 0 |
| C | 0 | 8 | 0 |
| D | 0 | 8 | 0 |
| Mode M0 | |||
|---|---|---|---|
| Quadrant | BADHDUFLAG | Total packets | Discarded packets |
| A | 0 | 125742 | 2 |
| B | 0 | 52421 | 2 |
| C | 0 | 137970 | 7 |
| D | 0 | 143787 | 2 |
| Mode SS | |||
|---|---|---|---|
| Quadrant | BADHDUFLAG | Total packets | Discarded packets |
| A | 0 | 378 | 0 |
| B | 0 | 378 | 0 |
| C | 0 | 378 | 0 |
| D | 0 | 378 | 0 |
| Quadrant | Total seconds | Saturated seconds | Saturation percentage |
|---|---|---|---|
| A | 18705 | 11839 | 63.293237% |
| B | 18705 | 1278 | 6.832398% |
| C | 18704 | 16032 | 85.714286% |
| D | 18704 | 16021 | 85.655475% |
Noise dominated data is calculated using 1-second bins in cleaned event files. If a bin has >2000 counts, and if more than 50% of those come from <1% of pixels, then it is considered to be noise-dominated and hence unusable.
| Quadrant | # 1 sec bins | Bins with >0 counts | Bins with >2000 counts | High rate bins dominated by noise | Noise dominated (total time) | Noise dominated (detector-on time) | Marked lightcurve |
|---|---|---|---|---|---|---|---|
| A | 19505 | 18705 | 10810 | 10810 | 55.42% | 57.79% | 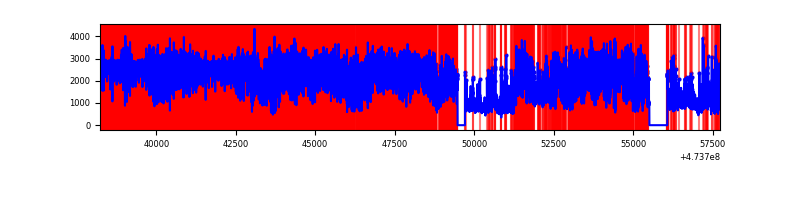 |
| B | 19505 | 18707 | 880 | 880 | 4.51% | 4.70% | 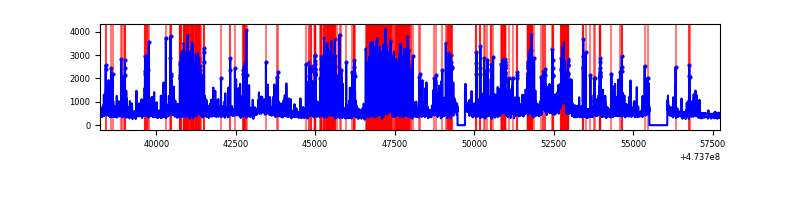 |
| C | 19503 | 18703 | 14716 | 14716 | 75.46% | 78.68% | 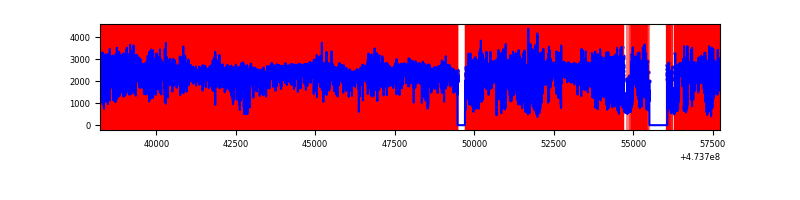 |
| D | 19503 | 18703 | 15139 | 15139 | 77.62% | 80.94% | 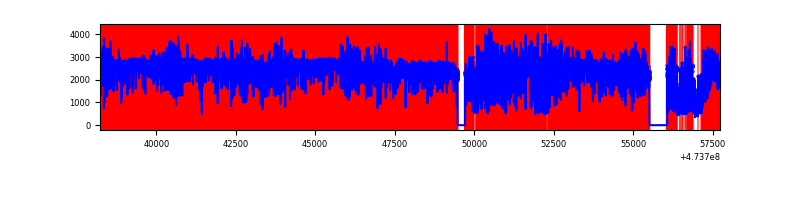 |
Top three noisy pixels from each quadrant. If the there are fewer than three noisy pixels in the level2.evt file, extra rows are filled as -1
| Pixel properties | Quadrant properties | ||||||
|---|---|---|---|---|---|---|---|
| Quadrant | DetID | PixID | Counts | Sigma | Mean | Median | Sigma |
| A | 0 | 98 | 16281541 | 44180.83 | 1450 | 1409 | 368.5 |
| A | 8 | 8 | 4414675 | 11976.67 | 1450 | 1409 | 368.5 |
| A | 4 | 4 | 3347887 | 9081.63 | 1450 | 1409 | 368.5 |
| B | 1 | 255 | 2237995 | 5490.54 | 1902 | 1833 | 407.3 |
| B | 5 | 185 | 701488 | 1717.89 | 1902 | 1833 | 407.3 |
| B | 4 | 206 | 392602 | 959.47 | 1902 | 1833 | 407.3 |
| C | 4 | 111 | 10640674 | 39992.6 | 910 | 904 | 266.0 |
| C | 15 | 164 | 4791908 | 18008.35 | 910 | 904 | 266.0 |
| C | 15 | 147 | 3713873 | 13956.25 | 910 | 904 | 266.0 |
| D | 15 | 168 | 10532761 | 34986.2 | 894 | 853 | 301.0 |
| D | 7 | 61 | 4068224 | 13511.5 | 894 | 853 | 301.0 |
| D | 15 | 142 | 4028356 | 13379.06 | 894 | 853 | 301.0 |
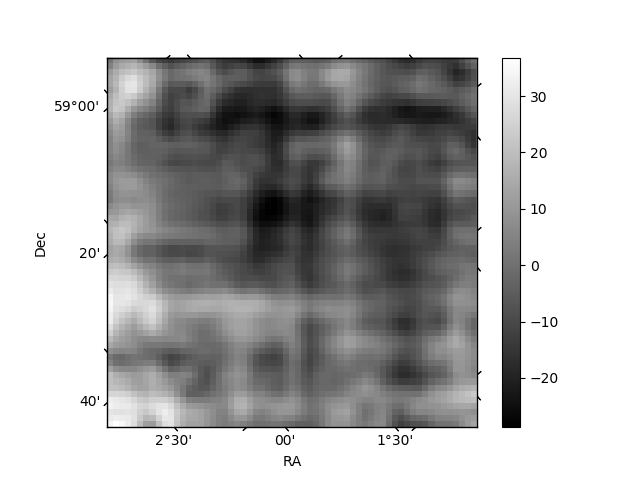
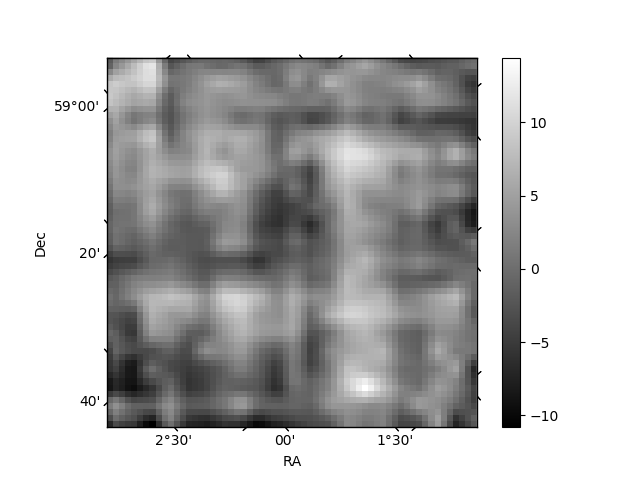
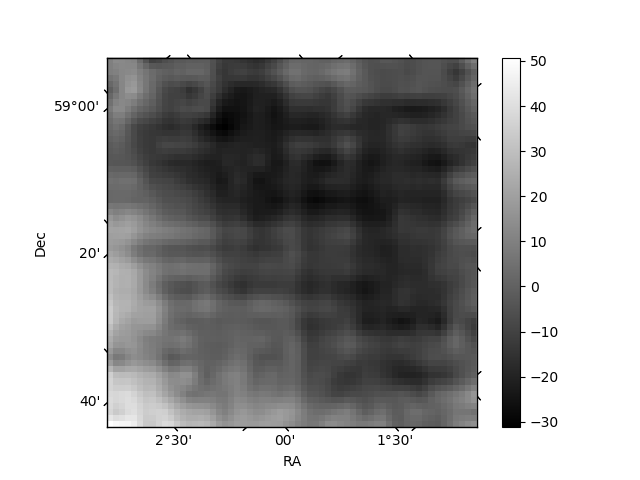
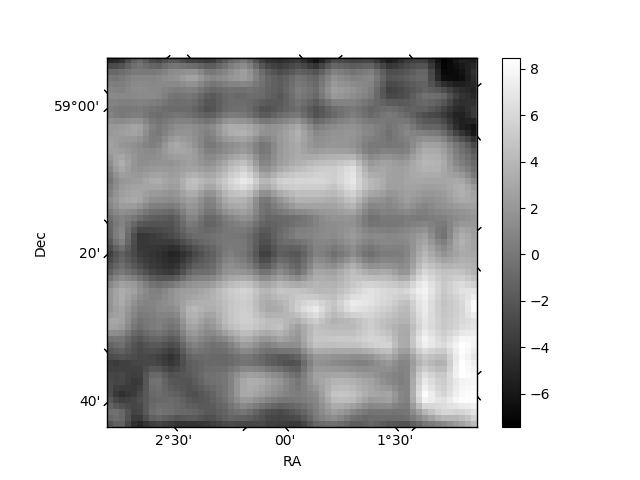
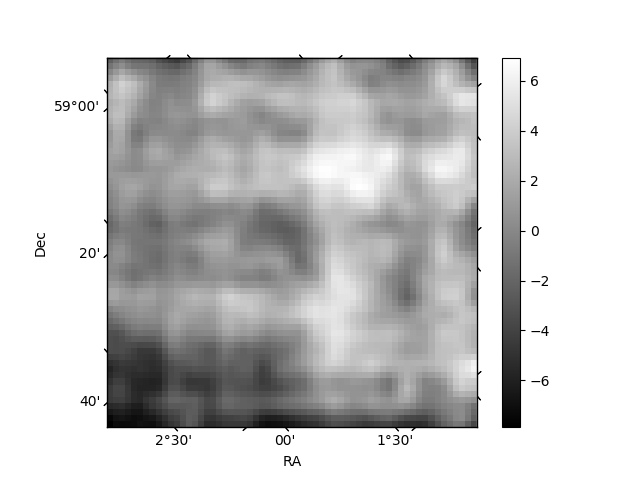
Histogram calculated using DETX and DETY for each event in the final _common_clean file
| Quadrant A | 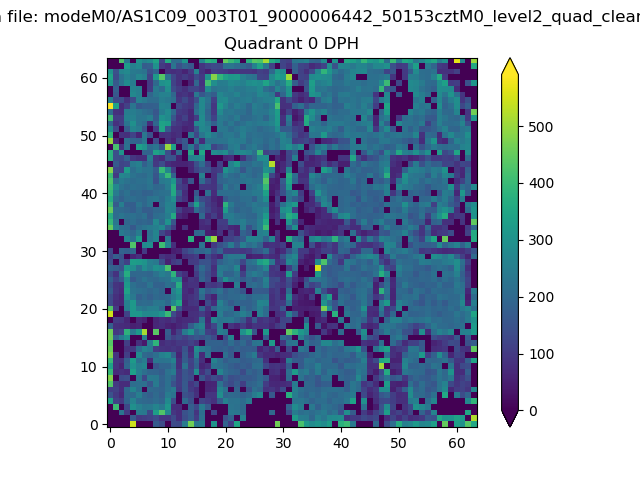 |
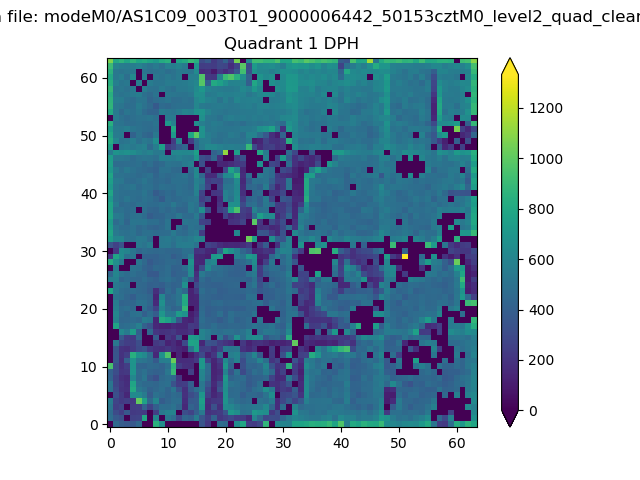 |
Quadrant B |
|---|---|---|---|
| Quadrant D | 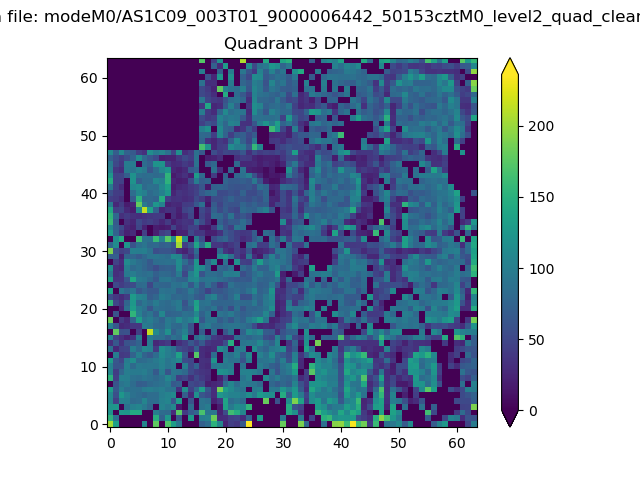 |
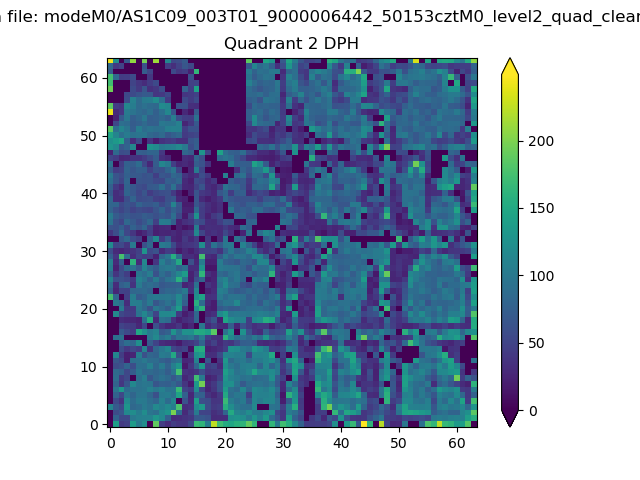 |
Quadrant C |
| Plot type | Count rate plots | Images |
|---|---|---|
| Comparison with Poisson distribution Blue bars denote a histogram of data divided into 1 sec bins. Red curve is a Poisson curve with rate = median count rate of data. |
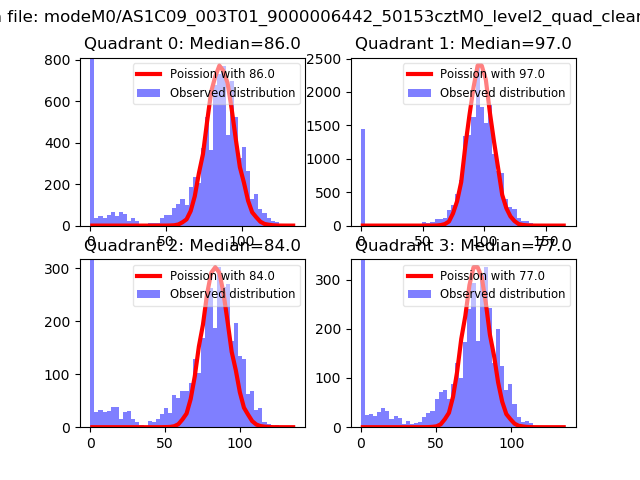 |
 |
| Quadrant-wise count rates Data is divided into 100 sec bins |
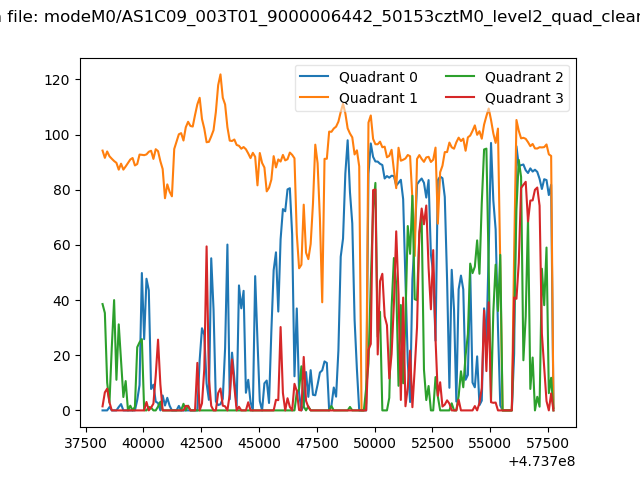 |
|
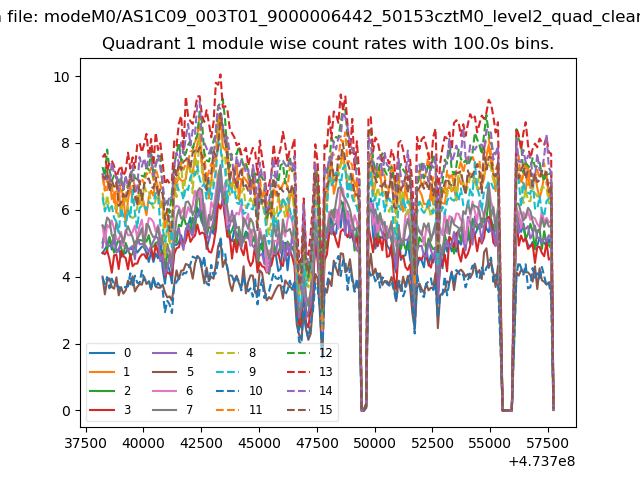
| Module-wise count rates for Quadrant A Data is divided into 100 sec bins |
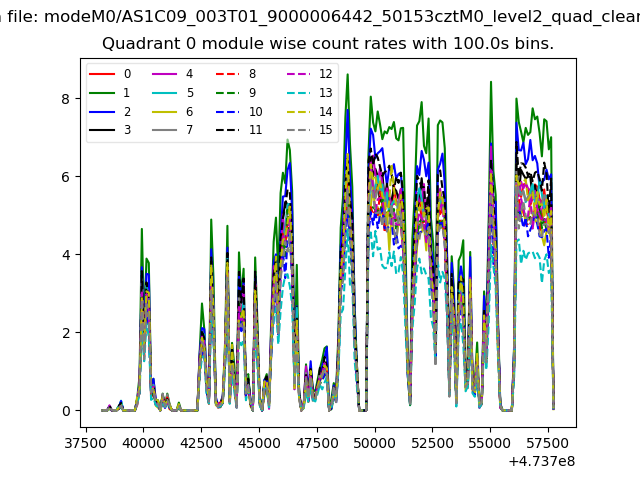 |
 |
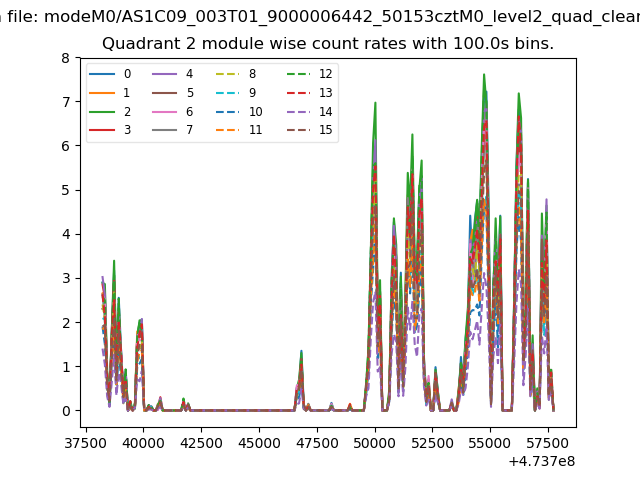
| Module-wise count rates for Quadrant B Data is divided into 100 sec bins |
 |
 |
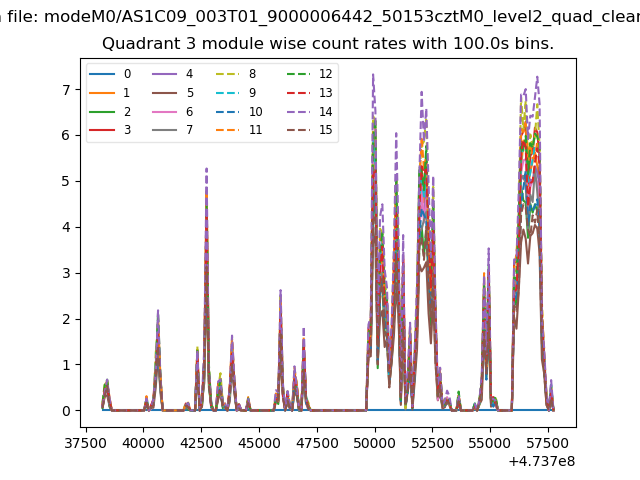
| Module-wise count rates for Quadrant C Data is divided into 100 sec bins |
 |
 |
| Module-wise count rates for Quadrant D Data is divided into 100 sec bins |
 |
 |
| Parameter | Plot |
|---|---|
| CZT HV Monitor | 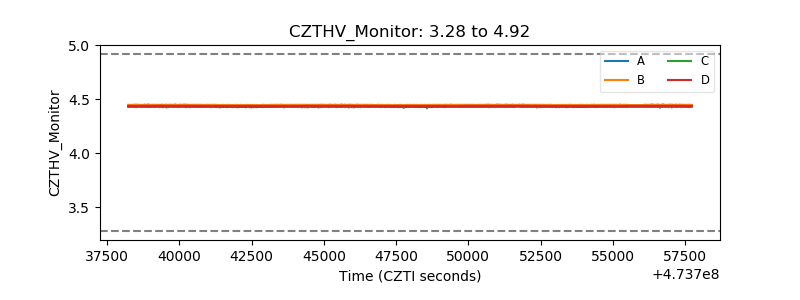 |
| D_VDD | 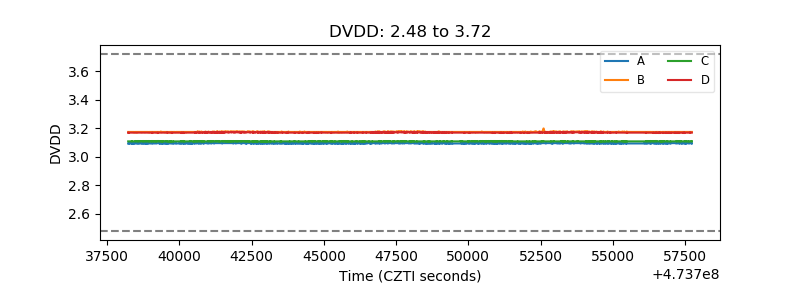 |
| Temperature 1 | 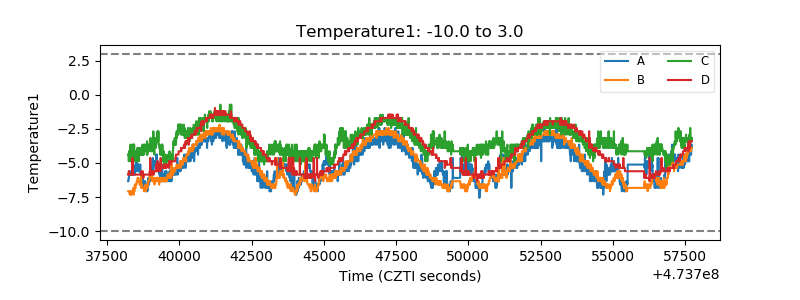 |
| Veto HV Monitor | 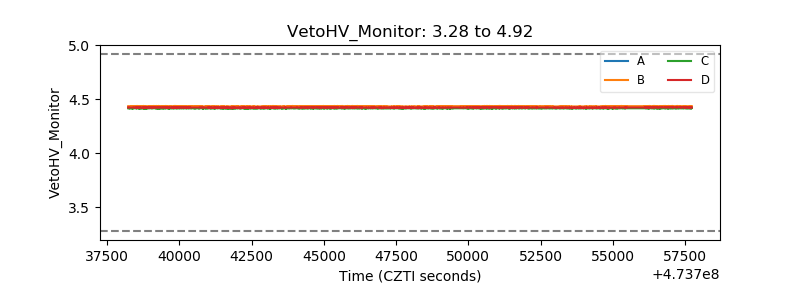 |
| Veto LLD | 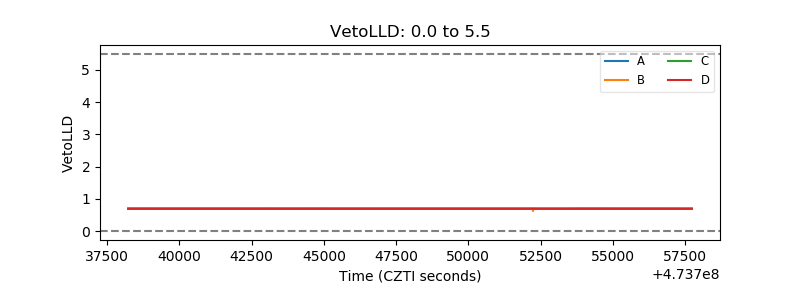 |
| Alpha Counter | 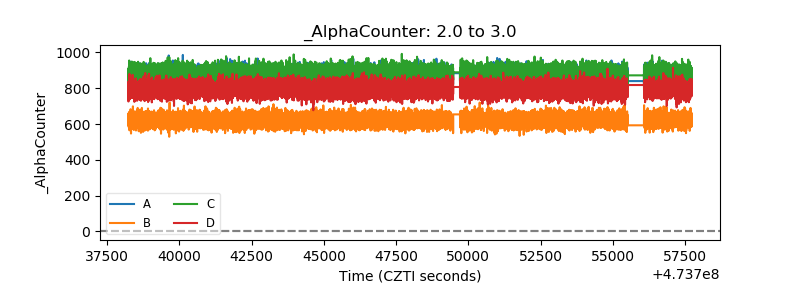 |
| _CPM_Rate | 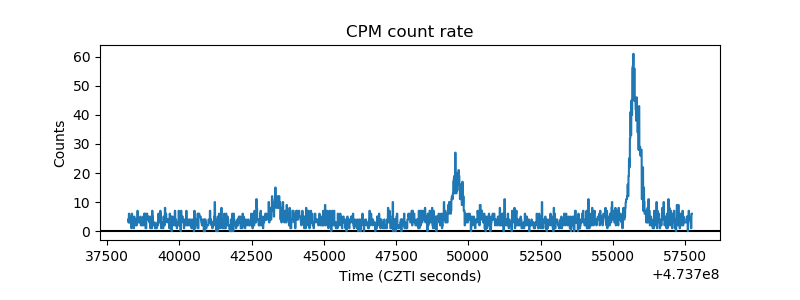 |
| CZT Counter | 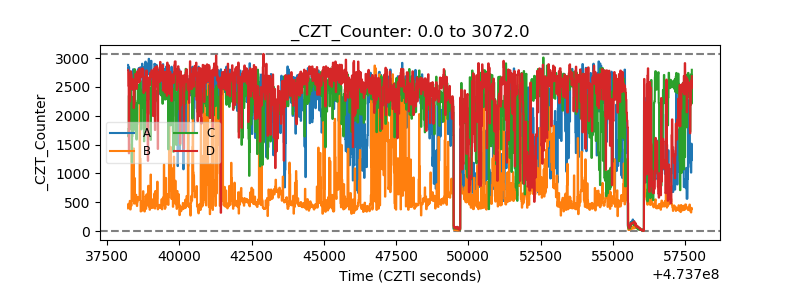 |
| +2.5 Volts monitor | 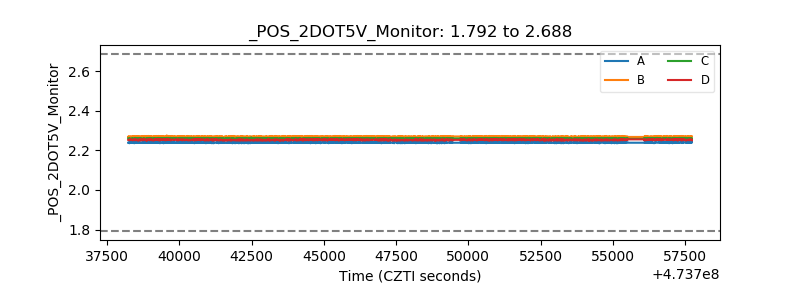 |
| +5 Volts monitor | 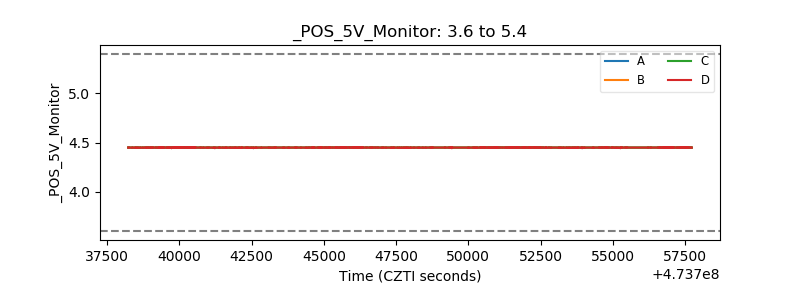 |
| _ROLL_ROT | 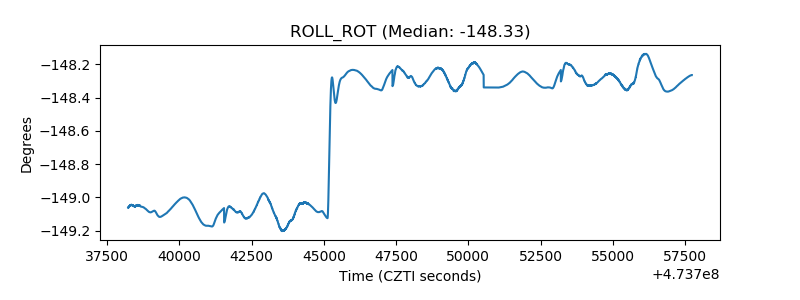 |
| _Roll_DEC | 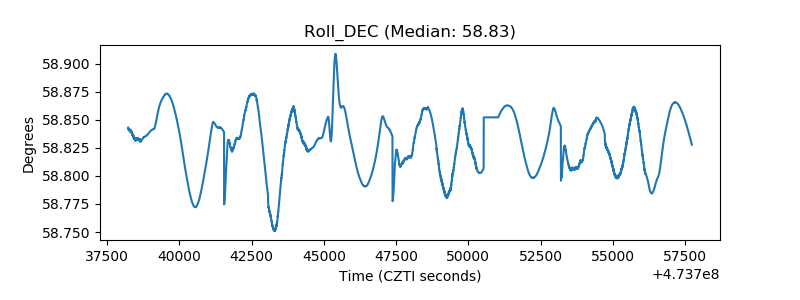 |
| _Roll_RA | 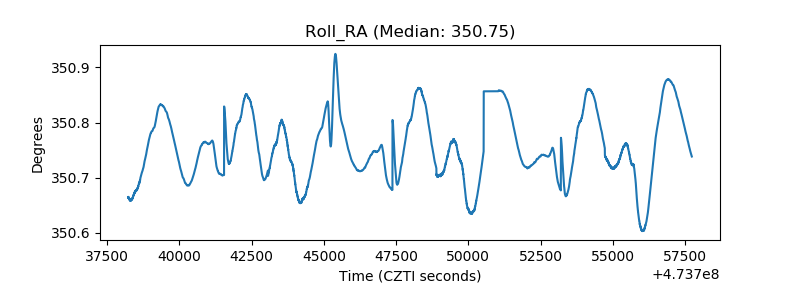 |
| Veto Counter | 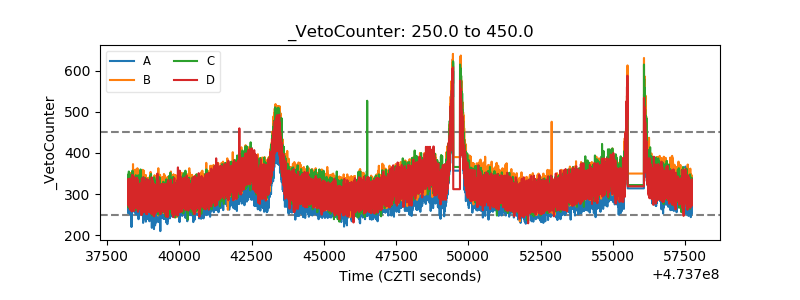 |