| Param | Original file | Final file |
|---|---|---|
| Filename | modeM0/AS1C09_003T01_9000006442_50154cztM0_level2.fits | modeM0/AS1C09_003T01_9000006442_50154cztM0_level2_quad_clean.evt |
| Size (bytes) | 976,207,680 | 65,494,080 |
| Size | 931.0 MB | 62.5 MB |
| Events in quadrant A | 9,537,556 | 448,051 |
| Events in quadrant B | 3,239,712 | 596,371 |
| Events in quadrant C | 10,727,755 | 291,947 |
| Events in quadrant D | 12,163,349 | 222,446 |
| Mode M9 | |||
|---|---|---|---|
| Quadrant | BADHDUFLAG | Total packets | Discarded packets |
| A | 0 | 8 | 0 |
| B | 0 | 8 | 0 |
| C | 0 | 8 | 0 |
| D | 0 | 8 | 0 |
| Mode M0 | |||
|---|---|---|---|
| Quadrant | BADHDUFLAG | Total packets | Discarded packets |
| A | 0 | 32566 | 2 |
| B | 0 | 13908 | 1 |
| C | 0 | 36073 | 1 |
| D | 0 | 40343 | 1 |
| Mode SS | |||
|---|---|---|---|
| Quadrant | BADHDUFLAG | Total packets | Discarded packets |
| A | 0 | 122 | 0 |
| B | 0 | 122 | 0 |
| C | 0 | 122 | 0 |
| D | 0 | 122 | 0 |
| Quadrant | Total seconds | Saturated seconds | Saturation percentage |
|---|---|---|---|
| A | 6070 | 1526 | 25.140033% |
| B | 6070 | 106 | 1.746293% |
| C | 6071 | 2994 | 49.316422% |
| D | 6071 | 3619 | 59.611267% |
Noise dominated data is calculated using 1-second bins in cleaned event files. If a bin has >2000 counts, and if more than 50% of those come from <1% of pixels, then it is considered to be noise-dominated and hence unusable.
| Quadrant | # 1 sec bins | Bins with >0 counts | Bins with >2000 counts | High rate bins dominated by noise | Noise dominated (total time) | Noise dominated (detector-on time) | Marked lightcurve |
|---|---|---|---|---|---|---|---|
| A | 6810 | 6070 | 1381 | 1381 | 20.28% | 22.75% | 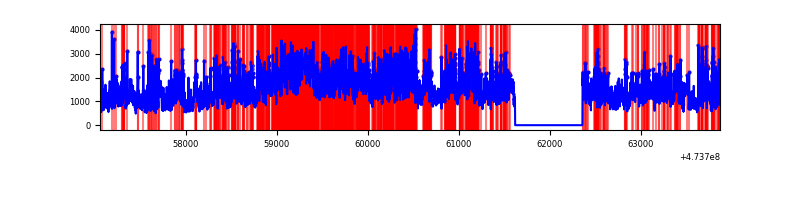 |
| B | 6810 | 6071 | 34 | 34 | 0.50% | 0.56% | 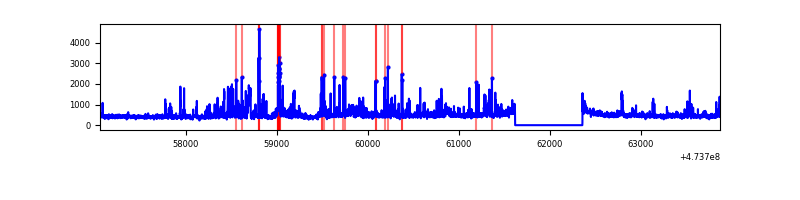 |
| C | 6811 | 6071 | 2819 | 2819 | 41.39% | 46.43% | 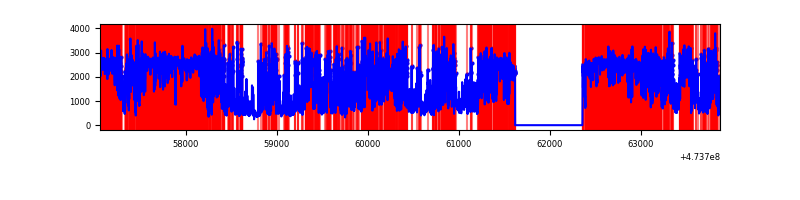 |
| D | 6810 | 6070 | 3571 | 3571 | 52.44% | 58.83% | 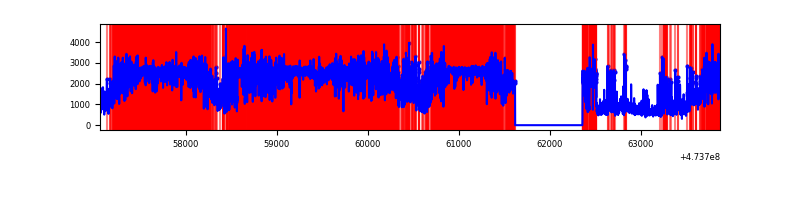 |
Top three noisy pixels from each quadrant. If the there are fewer than three noisy pixels in the level2.evt file, extra rows are filled as -1
| Pixel properties | Quadrant properties | ||||||
|---|---|---|---|---|---|---|---|
| Quadrant | DetID | PixID | Counts | Sigma | Mean | Median | Sigma |
| A | 9 | 191 | 2827350 | 19127.14 | 584 | 568 | 147.8 |
| A | 6 | 250 | 1009869 | 6829.34 | 584 | 568 | 147.8 |
| A | 8 | 8 | 919467 | 6217.64 | 584 | 568 | 147.8 |
| B | 4 | 206 | 175369 | 1318.02 | 622 | 601 | 132.6 |
| B | 4 | 216 | 83876 | 628.02 | 622 | 601 | 132.6 |
| B | 5 | 185 | 52647 | 392.51 | 622 | 601 | 132.6 |
| C | 4 | 111 | 4621437 | 36480.86 | 445 | 444 | 126.7 |
| C | 15 | 147 | 2323889 | 18342.65 | 445 | 444 | 126.7 |
| C | 0 | 208 | 332071 | 2618.06 | 445 | 444 | 126.7 |
| D | 15 | 185 | 2769172 | 21476.05 | 433 | 416 | 128.9 |
| D | 15 | 168 | 1500868 | 11638.36 | 433 | 416 | 128.9 |
| D | 15 | 58 | 1289632 | 9999.89 | 433 | 416 | 128.9 |
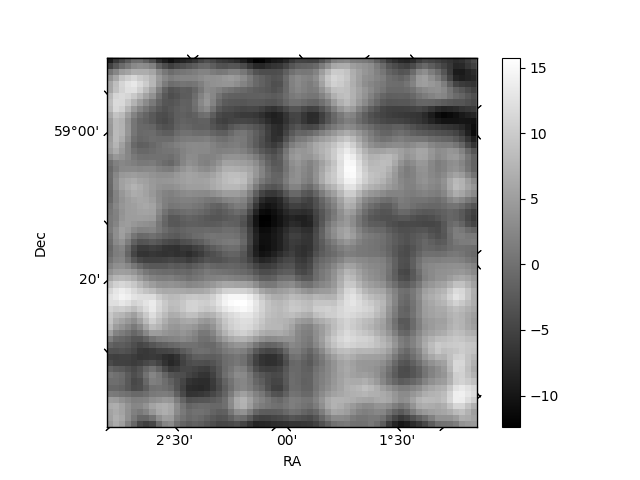
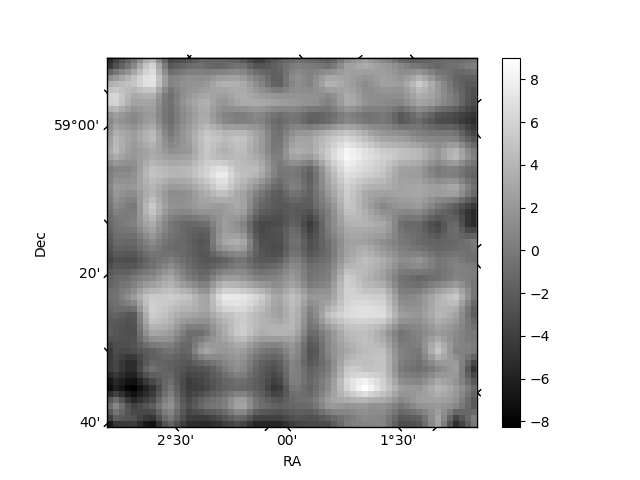
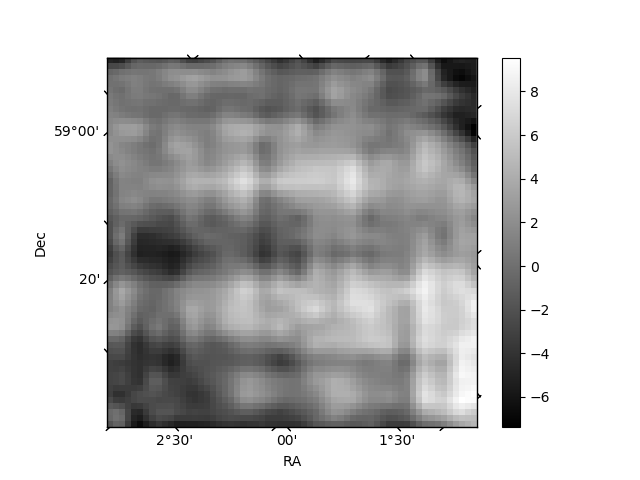
Histogram calculated using DETX and DETY for each event in the final _common_clean file
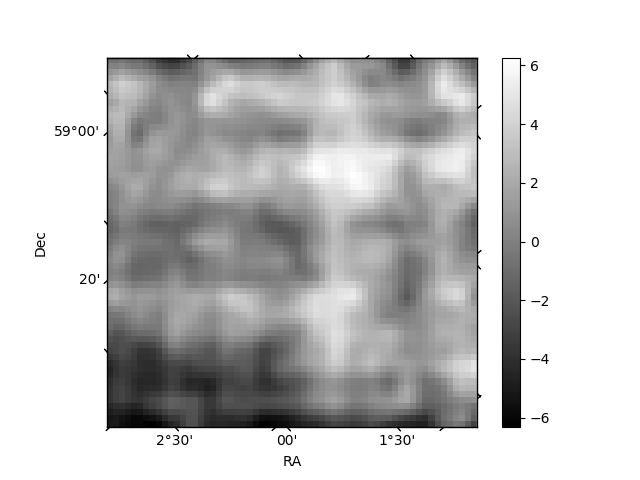
| Quadrant A | 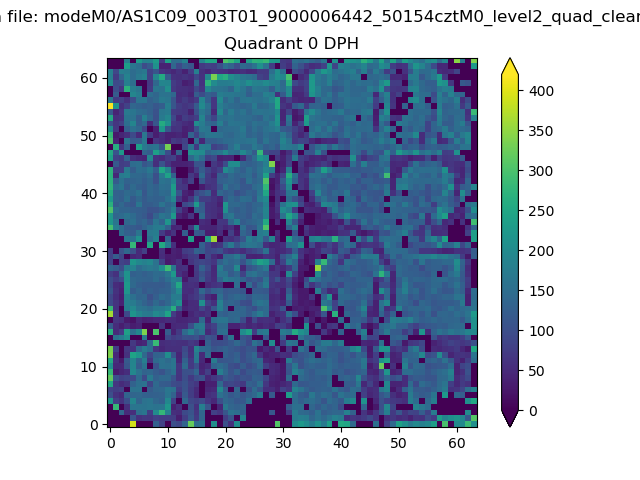 |
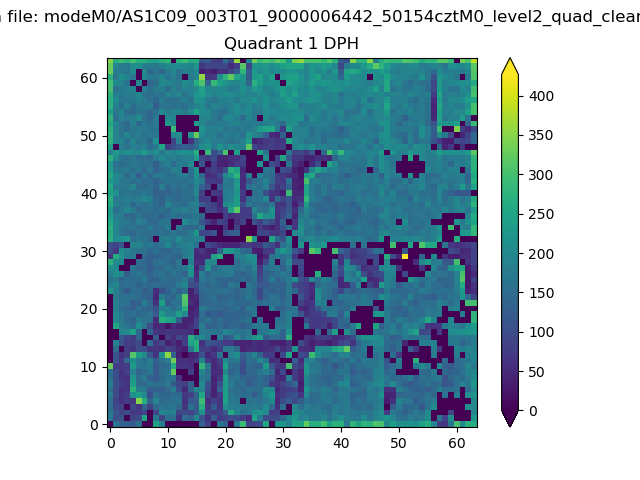 |
Quadrant B |
|---|---|---|---|
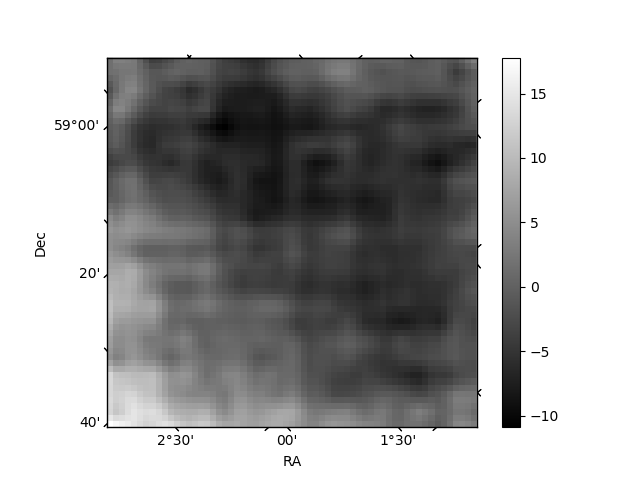
| Quadrant D | 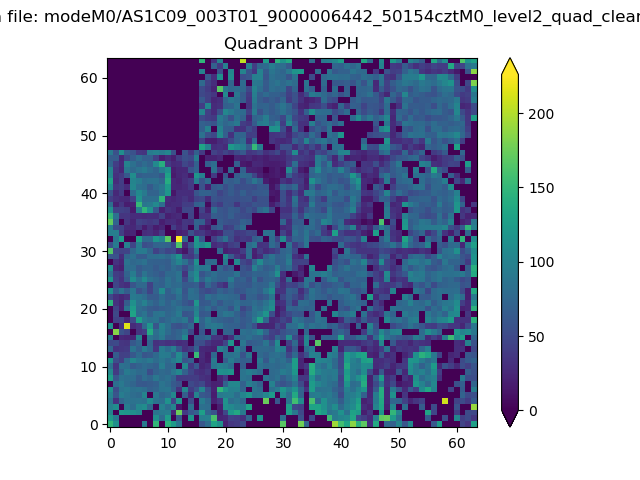 |
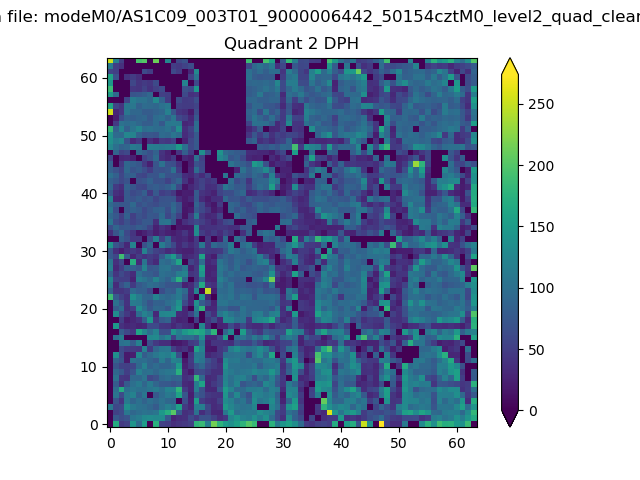 |
Quadrant C |
| Plot type | Count rate plots | Images |
|---|---|---|
| Comparison with Poisson distribution Blue bars denote a histogram of data divided into 1 sec bins. Red curve is a Poisson curve with rate = median count rate of data. |
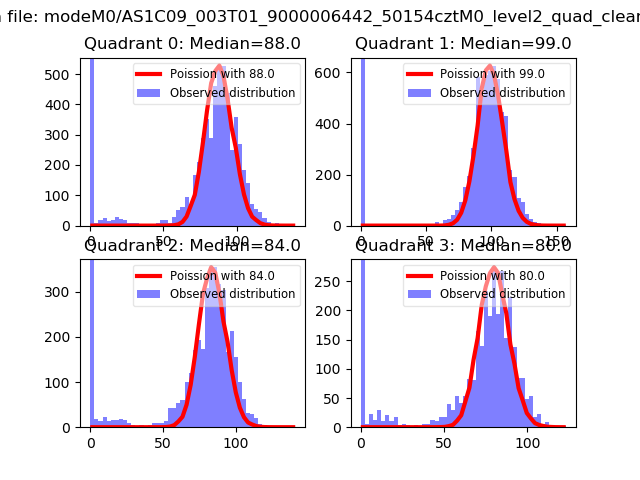 |
 |
| Quadrant-wise count rates Data is divided into 100 sec bins |
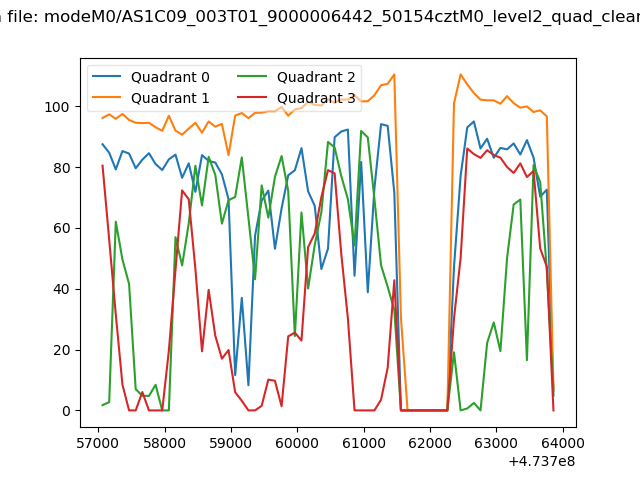 |
|
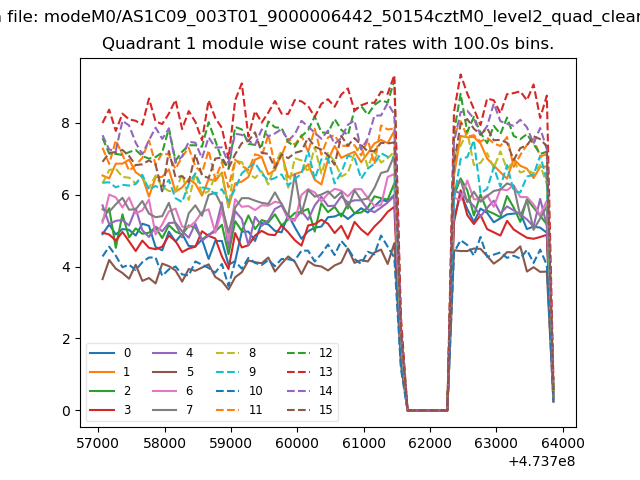
| Module-wise count rates for Quadrant A Data is divided into 100 sec bins |
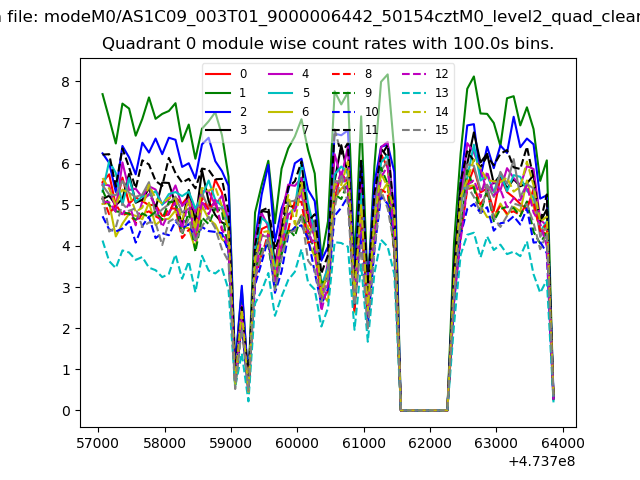 |
 |
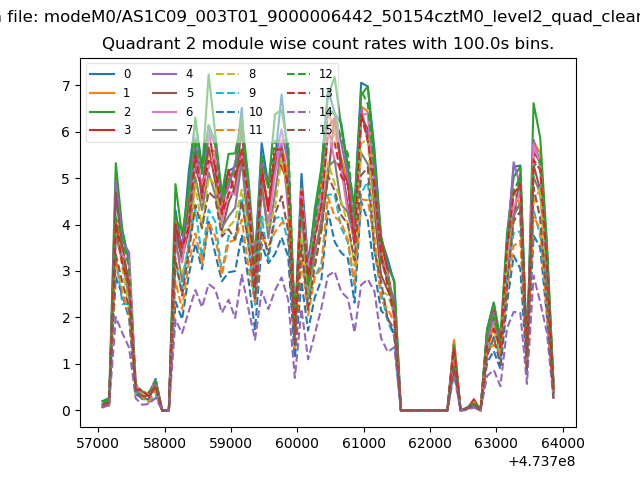
| Module-wise count rates for Quadrant B Data is divided into 100 sec bins |
 |
 |
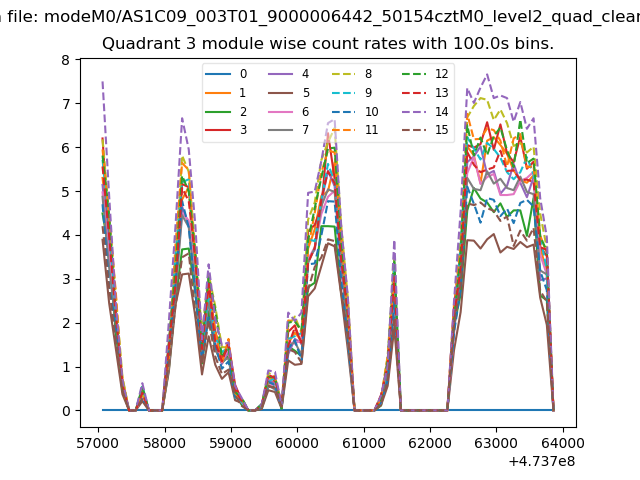
| Module-wise count rates for Quadrant C Data is divided into 100 sec bins |
 |
 |
| Module-wise count rates for Quadrant D Data is divided into 100 sec bins |
 |
 |
| Parameter | Plot |
|---|---|
| CZT HV Monitor | 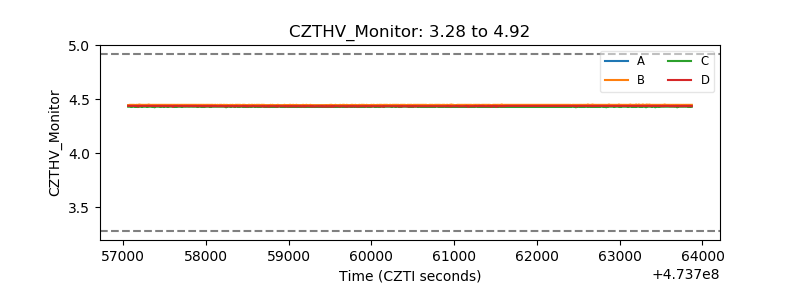 |
| D_VDD | 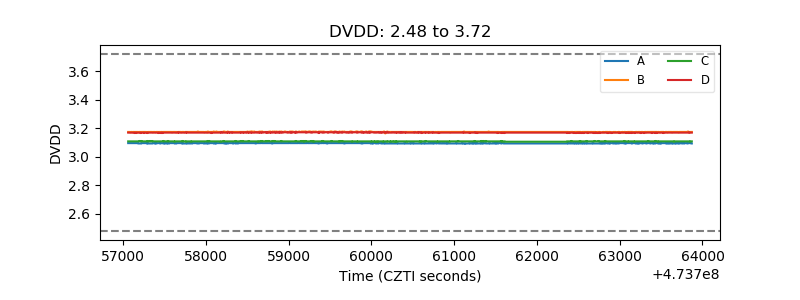 |
| Temperature 1 | 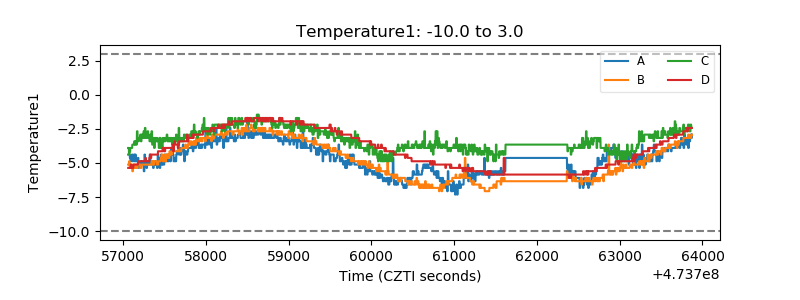 |
| Veto HV Monitor | 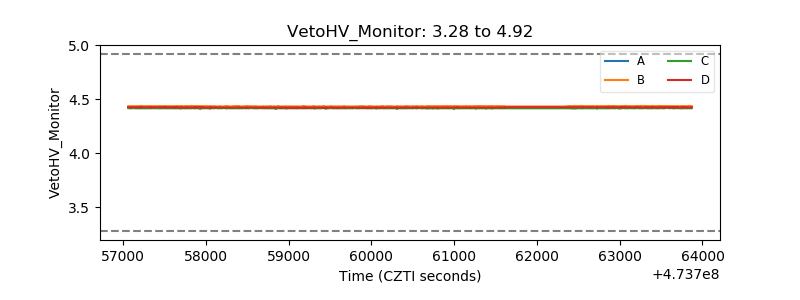 |
| Veto LLD | 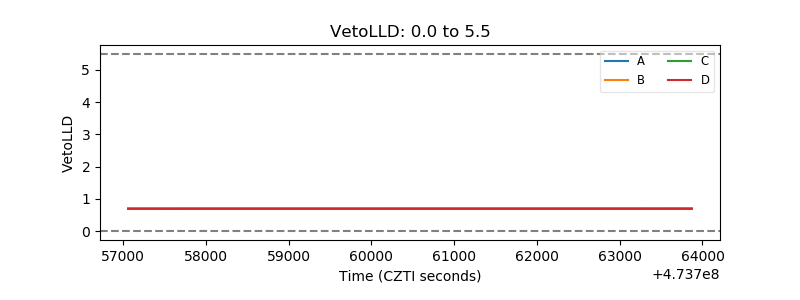 |
| Alpha Counter | 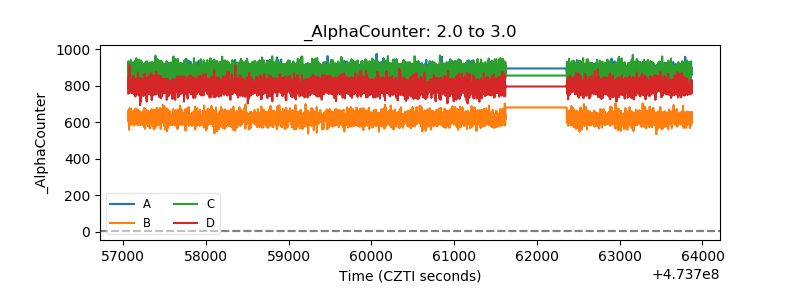 |
| _CPM_Rate | 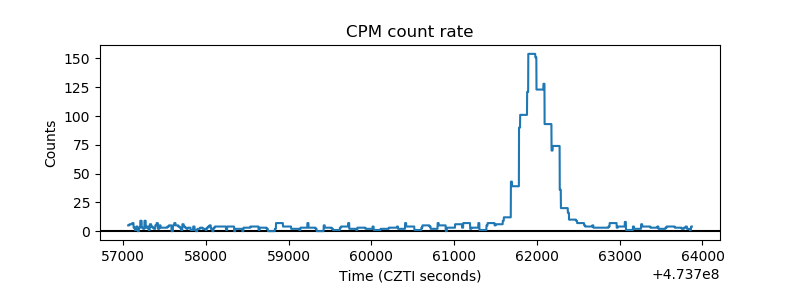 |
| CZT Counter | 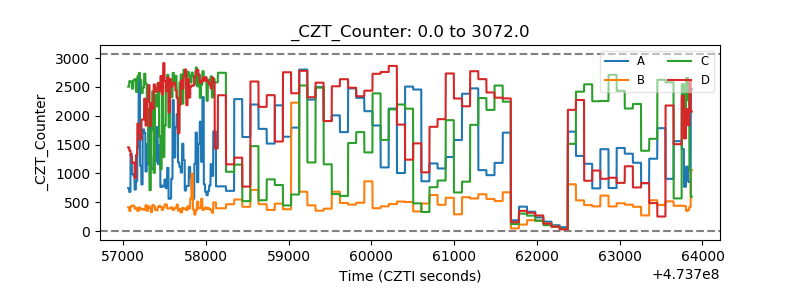 |
| +2.5 Volts monitor |  |
| +5 Volts monitor | 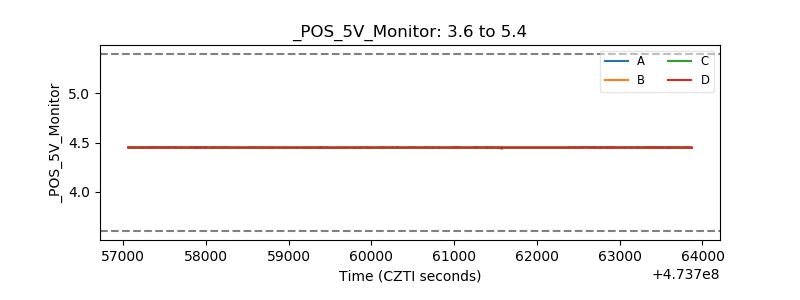 |
| _ROLL_ROT | 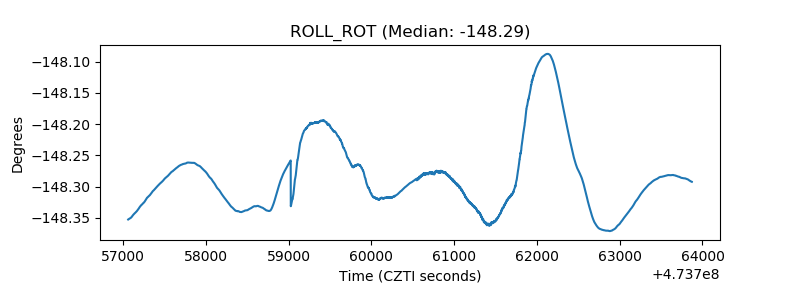 |
| _Roll_DEC | 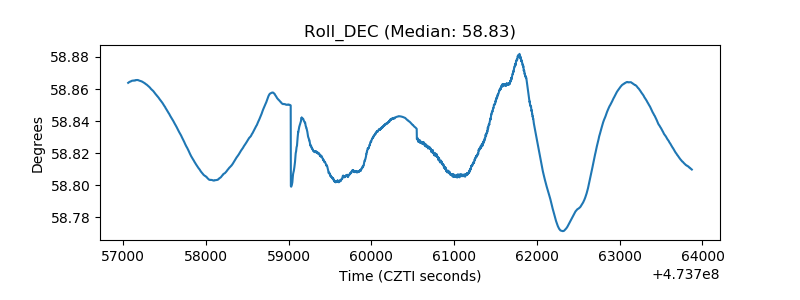 |
| _Roll_RA | 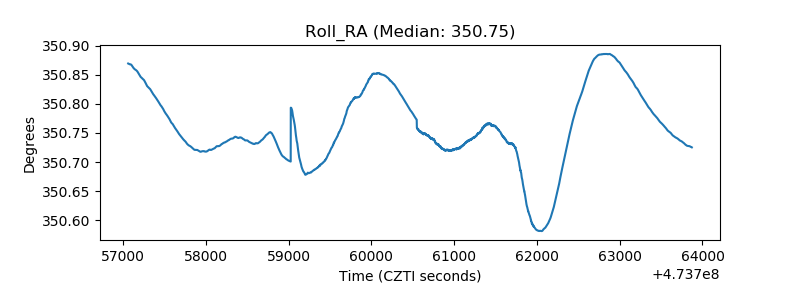 |
| Veto Counter | 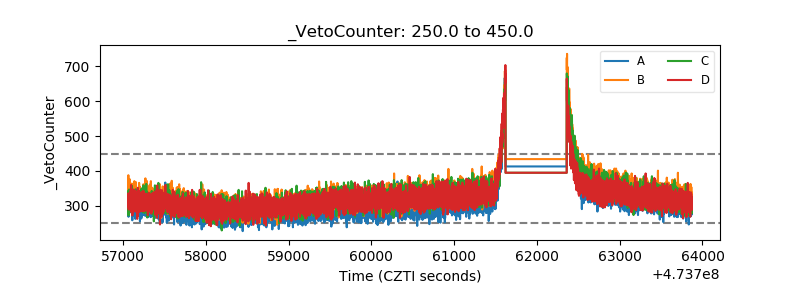 |