| Param | Original file | Final file |
|---|---|---|
| Filename | modeM0/AS1C09_003T01_9000006442_50155cztM0_level2.fits | modeM0/AS1C09_003T01_9000006442_50155cztM0_level2_quad_clean.evt |
| Size (bytes) | 1,061,585,280 | 66,939,840 |
| Size | 1012.4 MB | 63.8 MB |
| Events in quadrant A | 8,974,381 | 494,524 |
| Events in quadrant B | 3,628,618 | 628,886 |
| Events in quadrant C | 13,486,268 | 191,752 |
| Events in quadrant D | 12,718,936 | 268,584 |
| Mode M9 | |||
|---|---|---|---|
| Quadrant | BADHDUFLAG | Total packets | Discarded packets |
| A | 0 | 9 | 0 |
| B | 0 | 9 | 0 |
| C | 0 | 9 | 0 |
| D | 0 | 9 | 0 |
| Mode M0 | |||
|---|---|---|---|
| Quadrant | BADHDUFLAG | Total packets | Discarded packets |
| A | 0 | 31154 | 1 |
| B | 0 | 15183 | 1 |
| C | 0 | 44425 | 5 |
| D | 0 | 42155 | 1 |
| Mode SS | |||
|---|---|---|---|
| Quadrant | BADHDUFLAG | Total packets | Discarded packets |
| A | 0 | 128 | 0 |
| B | 0 | 128 | 0 |
| C | 0 | 128 | 0 |
| D | 0 | 128 | 0 |
| Quadrant | Total seconds | Saturated seconds | Saturation percentage |
|---|---|---|---|
| A | 6343 | 1340 | 21.125650% |
| B | 6343 | 173 | 2.727416% |
| C | 6342 | 4430 | 69.851782% |
| D | 6343 | 3572 | 56.314047% |
Noise dominated data is calculated using 1-second bins in cleaned event files. If a bin has >2000 counts, and if more than 50% of those come from <1% of pixels, then it is considered to be noise-dominated and hence unusable.
| Quadrant | # 1 sec bins | Bins with >0 counts | Bins with >2000 counts | High rate bins dominated by noise | Noise dominated (total time) | Noise dominated (detector-on time) | Marked lightcurve |
|---|---|---|---|---|---|---|---|
| A | 7248 | 6343 | 1109 | 1109 | 15.30% | 17.48% | 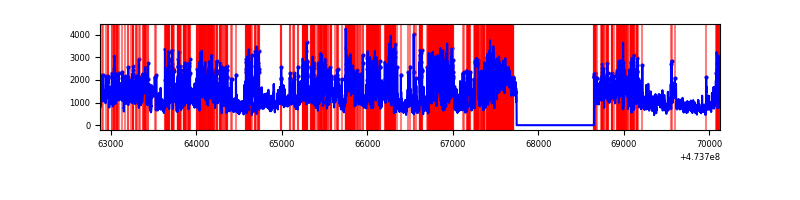 |
| B | 7248 | 6343 | 72 | 72 | 0.99% | 1.14% | 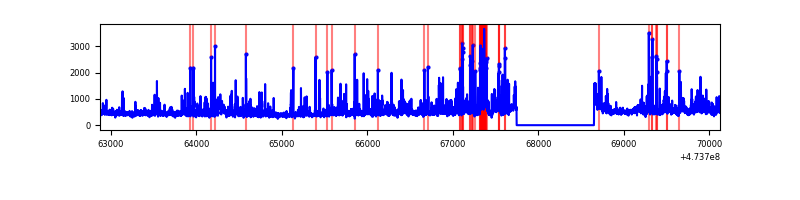 |
| C | 7247 | 6342 | 4158 | 4158 | 57.38% | 65.56% | 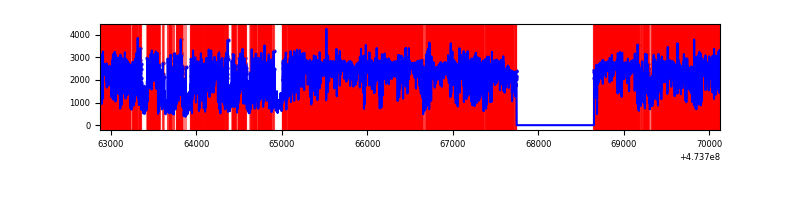 |
| D | 7248 | 6343 | 3608 | 3608 | 49.78% | 56.88% | 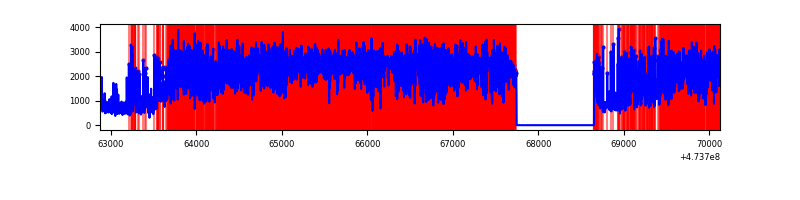 |
Top three noisy pixels from each quadrant. If the there are fewer than three noisy pixels in the level2.evt file, extra rows are filled as -1
| Pixel properties | Quadrant properties | ||||||
|---|---|---|---|---|---|---|---|
| Quadrant | DetID | PixID | Counts | Sigma | Mean | Median | Sigma |
| A | 9 | 191 | 1715669 | 11198.91 | 612 | 597 | 153.1 |
| A | 8 | 8 | 1110899 | 7249.94 | 612 | 597 | 153.1 |
| A | 0 | 98 | 1012574 | 6607.91 | 612 | 597 | 153.1 |
| B | 3 | 249 | 183083 | 1316.87 | 651 | 629 | 138.6 |
| B | 4 | 206 | 128092 | 919.97 | 651 | 629 | 138.6 |
| B | 5 | 185 | 127633 | 916.66 | 651 | 629 | 138.6 |
| C | 4 | 111 | 8162053 | 74463.65 | 392 | 391 | 109.6 |
| C | 15 | 147 | 1063859 | 9702.64 | 392 | 391 | 109.6 |
| C | 0 | 208 | 485248 | 4423.64 | 392 | 391 | 109.6 |
| D | 15 | 185 | 2865587 | 19285.29 | 505 | 487 | 148.6 |
| D | 15 | 142 | 1239964 | 8343.05 | 505 | 487 | 148.6 |
| D | 15 | 184 | 876510 | 5896.6 | 505 | 487 | 148.6 |
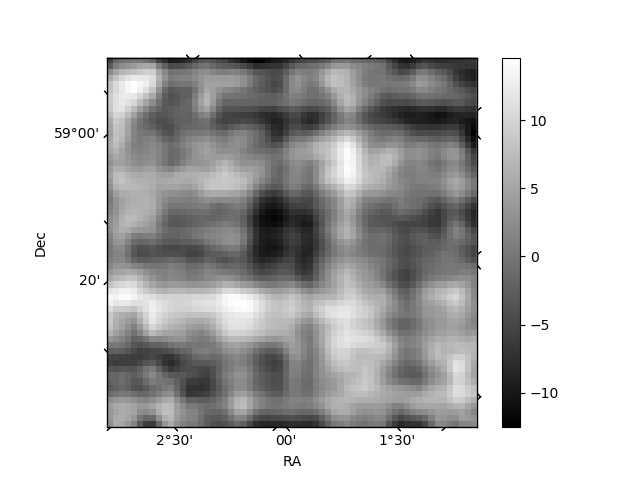
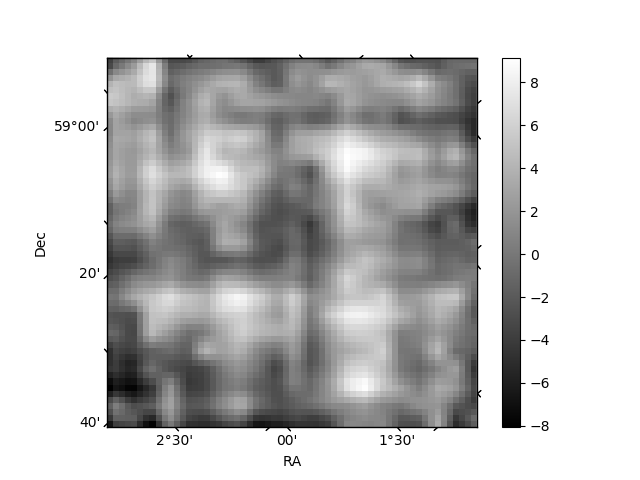
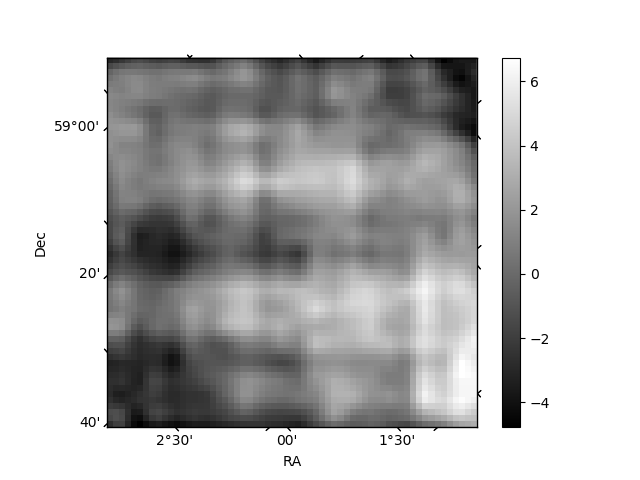
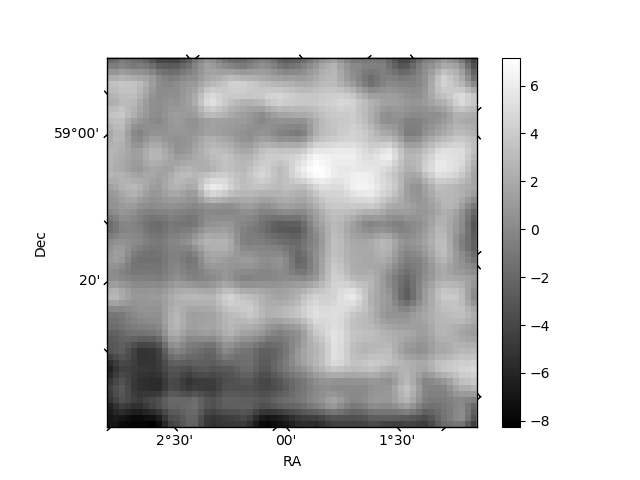
Histogram calculated using DETX and DETY for each event in the final _common_clean file
| Quadrant A | 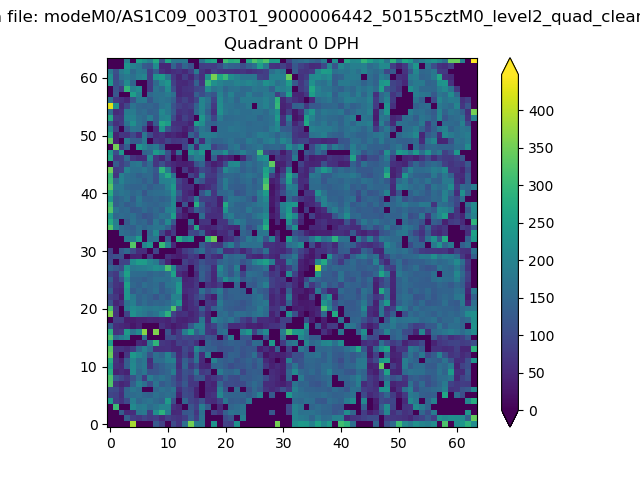 |
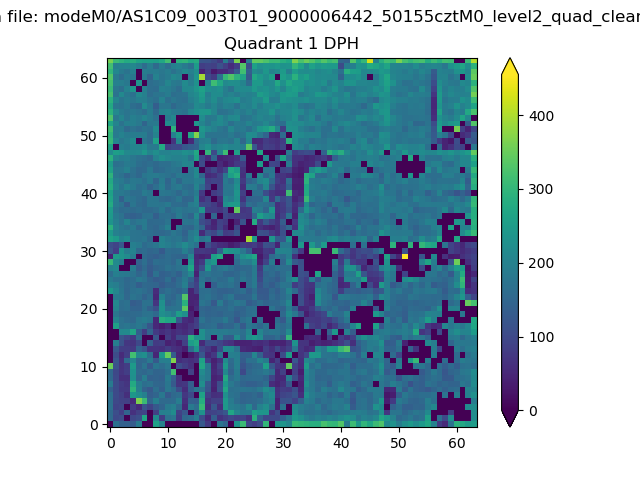 |
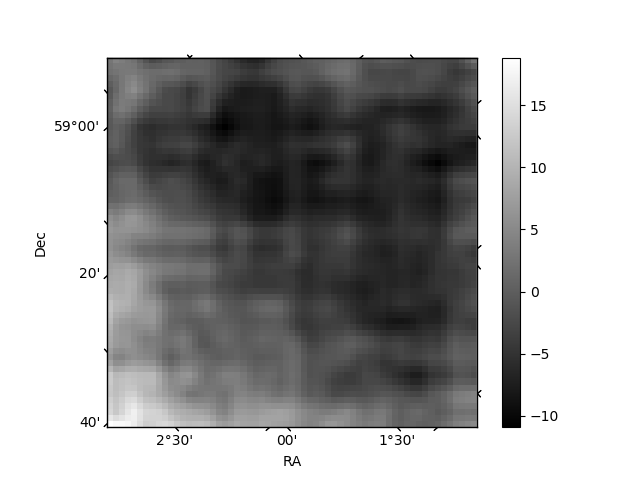
Quadrant B |
|---|---|---|---|
| Quadrant D | 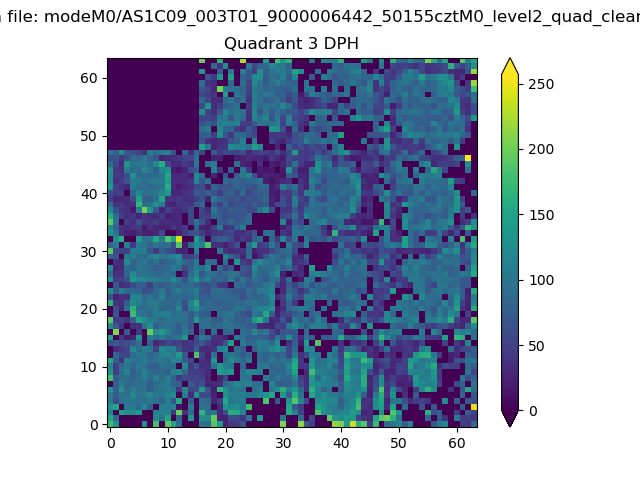 |
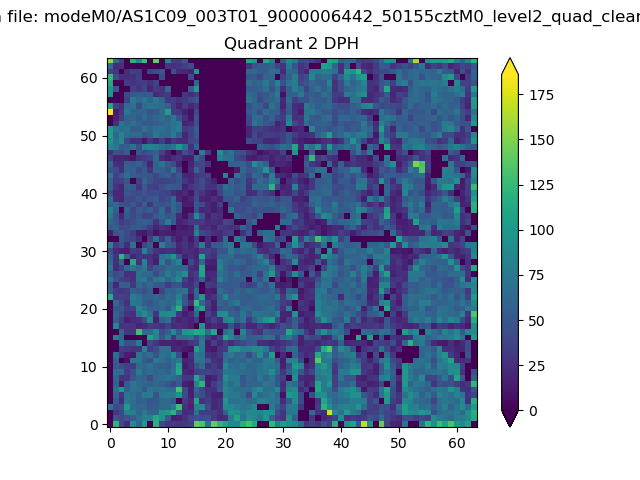 |
Quadrant C |
| Plot type | Count rate plots | Images |
|---|---|---|
| Comparison with Poisson distribution Blue bars denote a histogram of data divided into 1 sec bins. Red curve is a Poisson curve with rate = median count rate of data. |
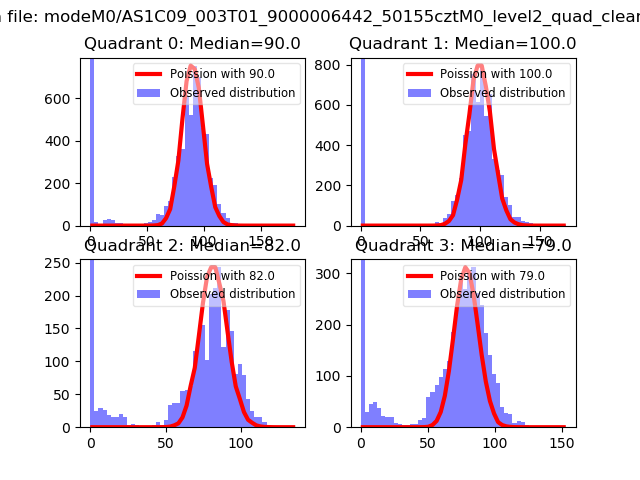 |
 |
| Quadrant-wise count rates Data is divided into 100 sec bins |
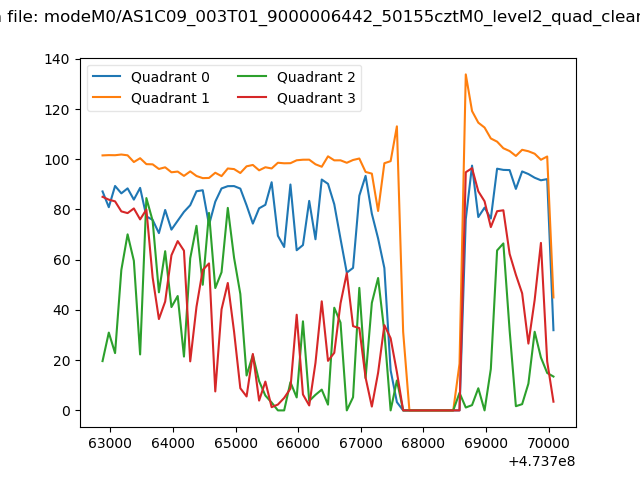 |
|
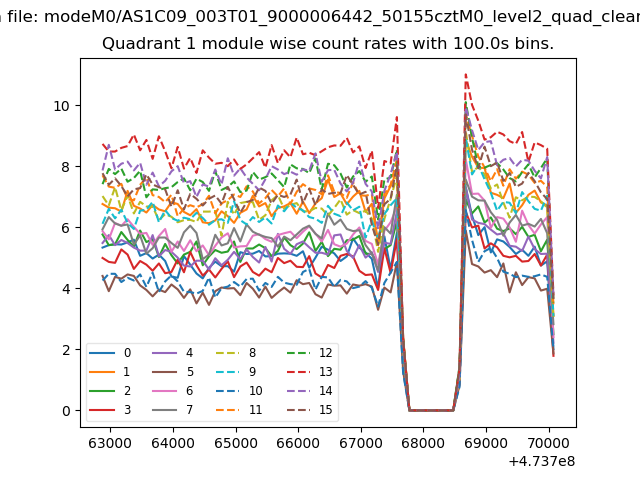
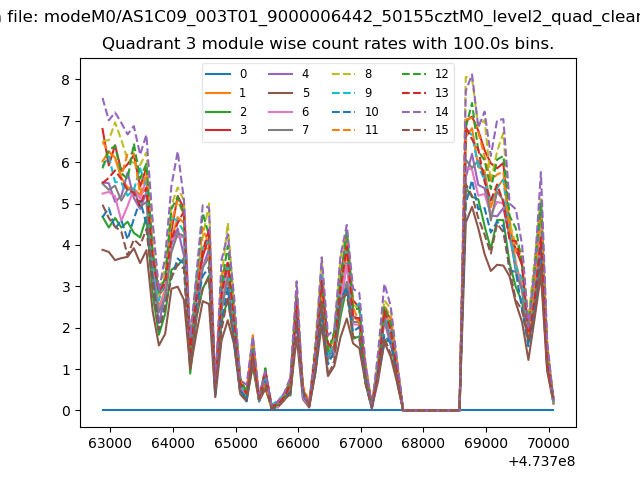
| Module-wise count rates for Quadrant A Data is divided into 100 sec bins |
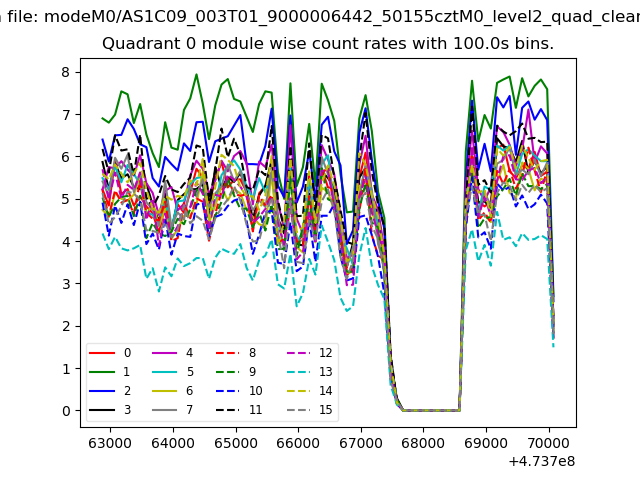 |
 |
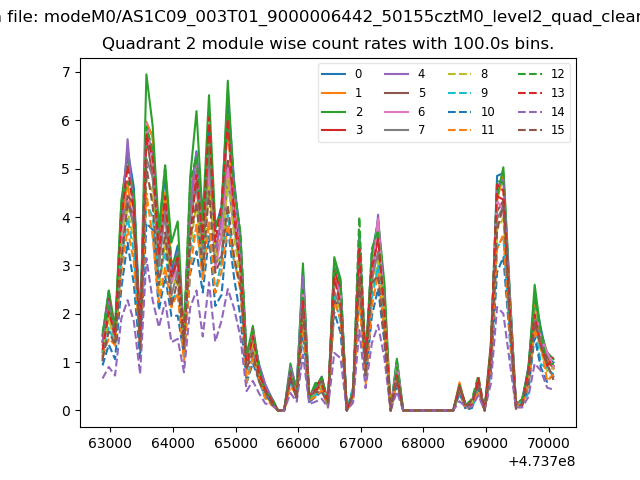
| Module-wise count rates for Quadrant B Data is divided into 100 sec bins |
 |
 |
| Module-wise count rates for Quadrant C Data is divided into 100 sec bins |
 |
 |
| Module-wise count rates for Quadrant D Data is divided into 100 sec bins |
 |
 |
| Parameter | Plot |
|---|---|
| CZT HV Monitor | 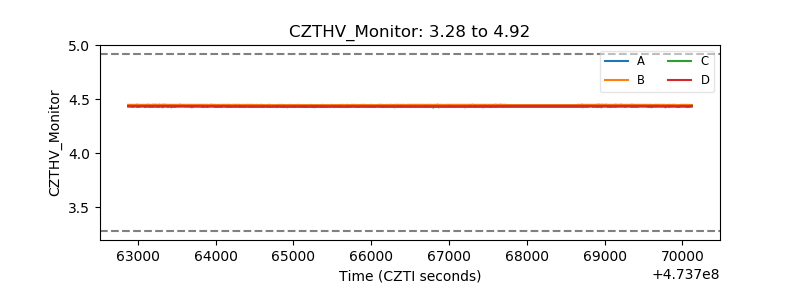 |
| D_VDD | 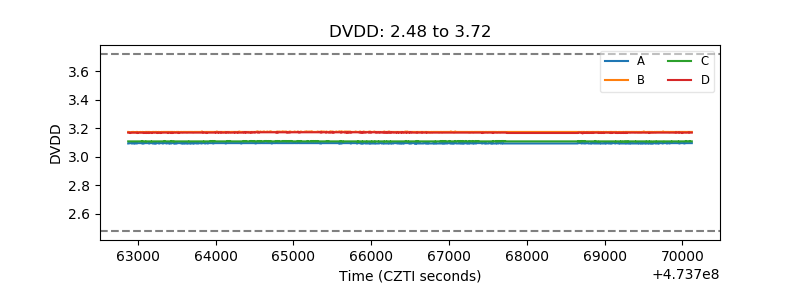 |
| Temperature 1 | 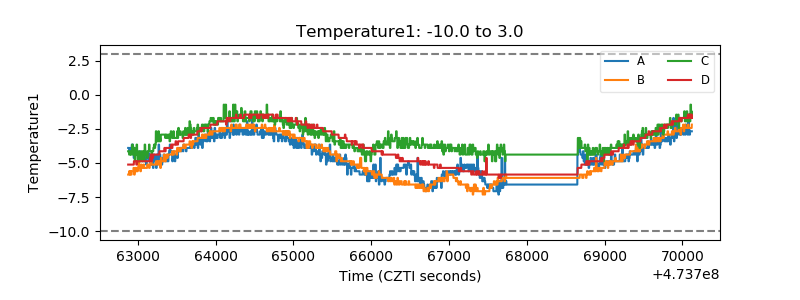 |
| Veto HV Monitor | 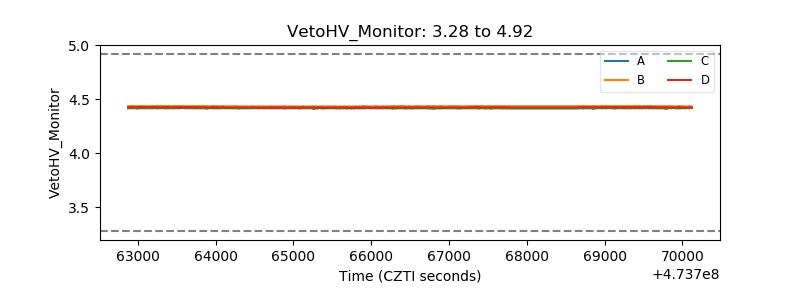 |
| Veto LLD | 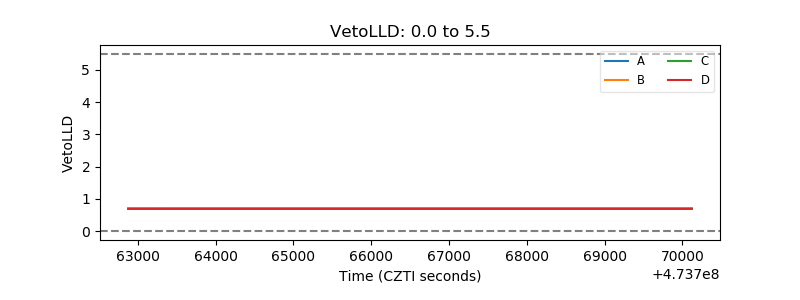 |
| Alpha Counter | 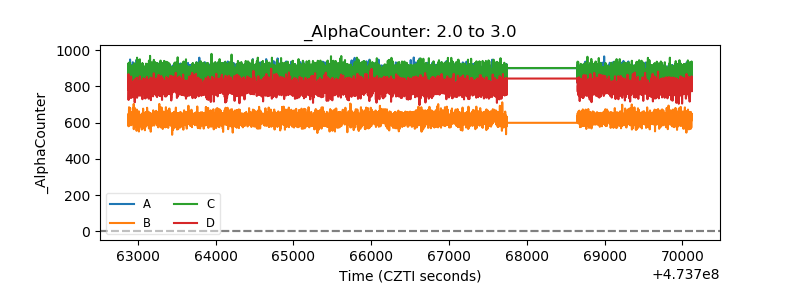 |
| _CPM_Rate | 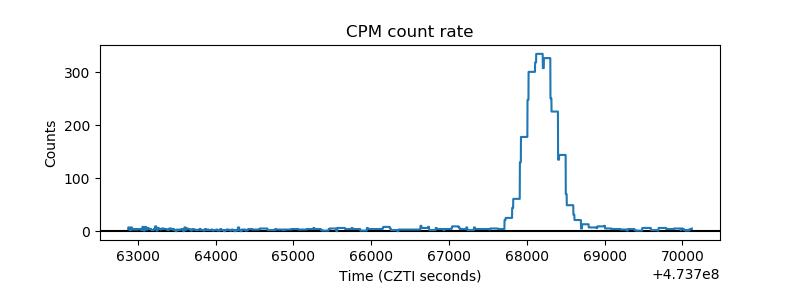 |
| CZT Counter | 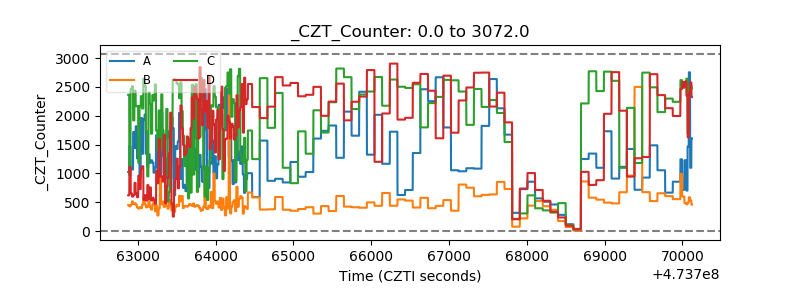 |
| +2.5 Volts monitor |  |
| +5 Volts monitor | 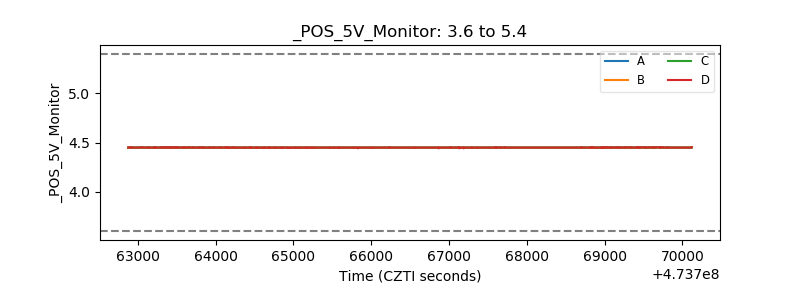 |
| _ROLL_ROT | 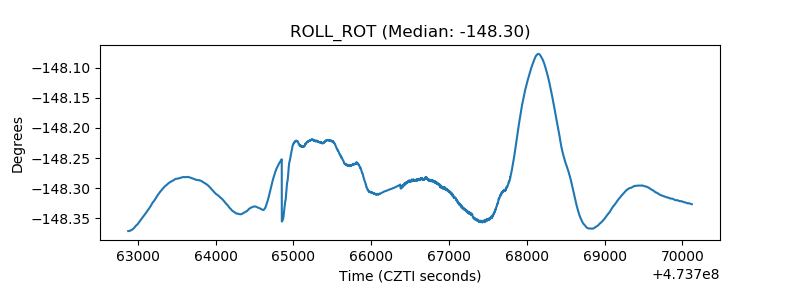 |
| _Roll_DEC | 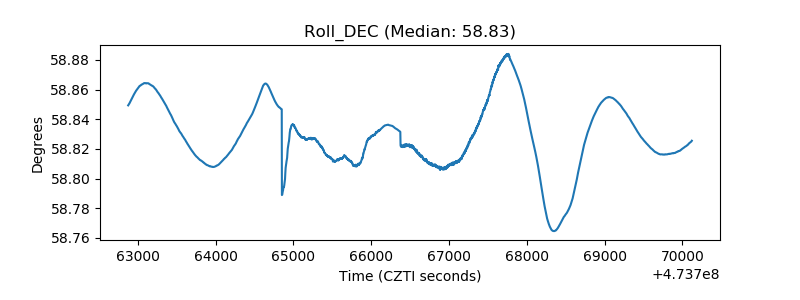 |
| _Roll_RA | 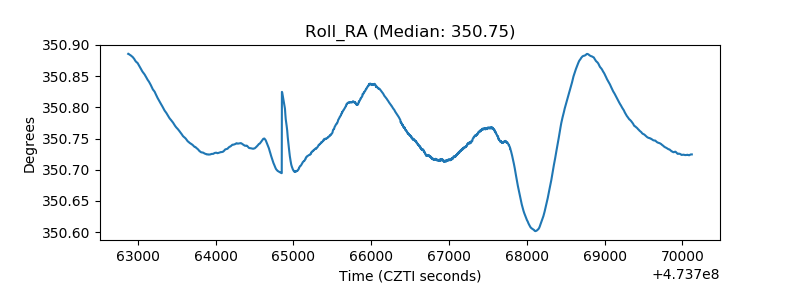 |
| Veto Counter | 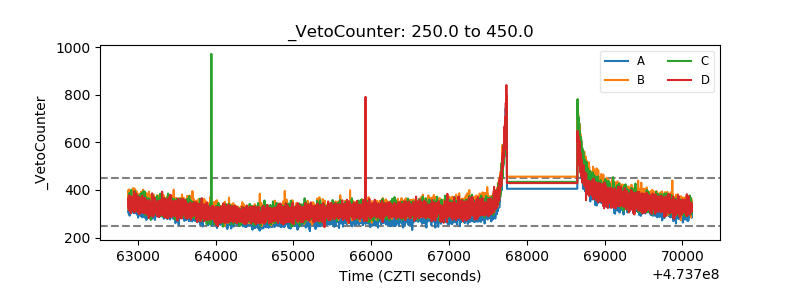 |