| Param | Original file | Final file |
|---|---|---|
| Filename | modeM0/AS1C09_003T01_9000006442_50157cztM0_level2.fits | modeM0/AS1C09_003T01_9000006442_50157cztM0_level2_quad_clean.evt |
| Size (bytes) | 996,203,520 | 61,721,280 |
| Size | 950.1 MB | 58.9 MB |
| Events in quadrant A | 9,416,800 | 374,668 |
| Events in quadrant B | 3,985,964 | 584,617 |
| Events in quadrant C | 11,096,615 | 241,541 |
| Events in quadrant D | 11,926,972 | 258,969 |
| Mode M9 | |||
|---|---|---|---|
| Quadrant | BADHDUFLAG | Total packets | Discarded packets |
| A | 0 | 10 | 0 |
| B | 0 | 10 | 0 |
| C | 0 | 10 | 0 |
| D | 0 | 10 | 0 |
| Mode M0 | |||
|---|---|---|---|
| Quadrant | BADHDUFLAG | Total packets | Discarded packets |
| A | 0 | 32066 | 1 |
| B | 0 | 15823 | 1 |
| C | 0 | 37005 | 1 |
| D | 0 | 39449 | 1 |
| Mode SS | |||
|---|---|---|---|
| Quadrant | BADHDUFLAG | Total packets | Discarded packets |
| A | 0 | 120 | 0 |
| B | 0 | 120 | 0 |
| C | 0 | 120 | 0 |
| D | 0 | 120 | 0 |
| Quadrant | Total seconds | Saturated seconds | Saturation percentage |
|---|---|---|---|
| A | 5840 | 2161 | 37.003425% |
| B | 5840 | 253 | 4.332192% |
| C | 5840 | 3407 | 58.339041% |
| D | 5839 | 3327 | 56.978935% |
Noise dominated data is calculated using 1-second bins in cleaned event files. If a bin has >2000 counts, and if more than 50% of those come from <1% of pixels, then it is considered to be noise-dominated and hence unusable.
| Quadrant | # 1 sec bins | Bins with >0 counts | Bins with >2000 counts | High rate bins dominated by noise | Noise dominated (total time) | Noise dominated (detector-on time) | Marked lightcurve |
|---|---|---|---|---|---|---|---|
| A | 6874 | 5839 | 1924 | 1924 | 27.99% | 32.95% | 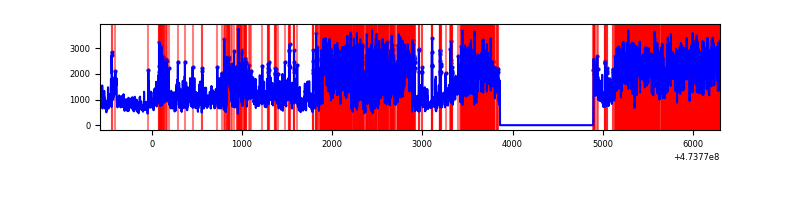 |
| B | 6875 | 5841 | 155 | 155 | 2.25% | 2.65% | 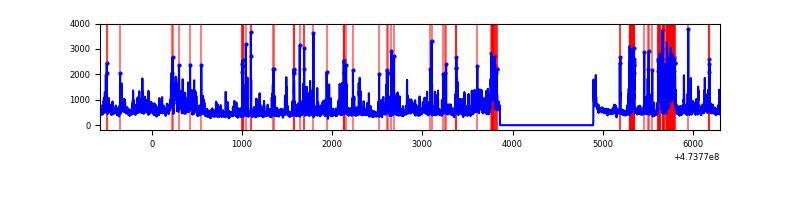 |
| C | 6875 | 5840 | 3166 | 3166 | 46.05% | 54.21% | 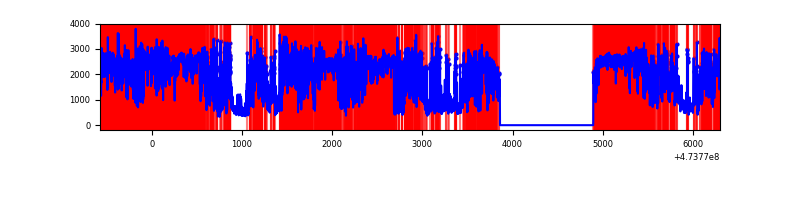 |
| D | 6874 | 5839 | 3392 | 3392 | 49.35% | 58.09% | 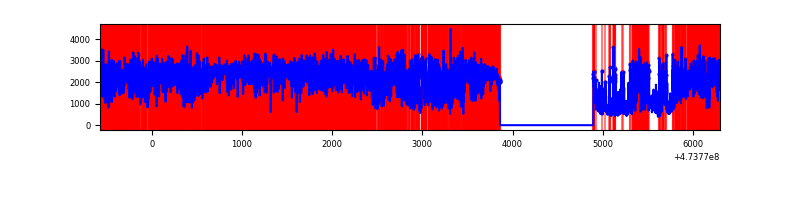 |
Top three noisy pixels from each quadrant. If the there are fewer than three noisy pixels in the level2.evt file, extra rows are filled as -1
| Pixel properties | Quadrant properties | ||||||
|---|---|---|---|---|---|---|---|
| Quadrant | DetID | PixID | Counts | Sigma | Mean | Median | Sigma |
| A | 8 | 8 | 2190619 | 16318.22 | 529 | 514 | 134.2 |
| A | 9 | 191 | 1677340 | 12493.84 | 529 | 514 | 134.2 |
| A | 0 | 98 | 1604233 | 11949.13 | 529 | 514 | 134.2 |
| B | 5 | 185 | 405390 | 3174.85 | 597 | 578 | 127.5 |
| B | 4 | 170 | 312085 | 2443.08 | 597 | 578 | 127.5 |
| B | 4 | 206 | 231335 | 1809.78 | 597 | 578 | 127.5 |
| C | 4 | 111 | 5761236 | 53036.51 | 394 | 393 | 108.6 |
| C | 15 | 230 | 840327 | 7732.75 | 394 | 393 | 108.6 |
| C | 15 | 147 | 673272 | 6194.78 | 394 | 393 | 108.6 |
| D | 15 | 185 | 2747429 | 20304.79 | 470 | 456 | 135.3 |
| D | 7 | 126 | 1399578 | 10341.88 | 470 | 456 | 135.3 |
| D | 8 | 176 | 1071352 | 7915.74 | 470 | 456 | 135.3 |
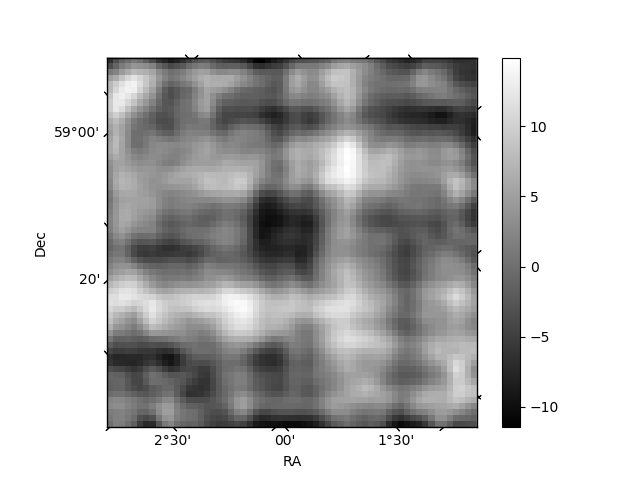
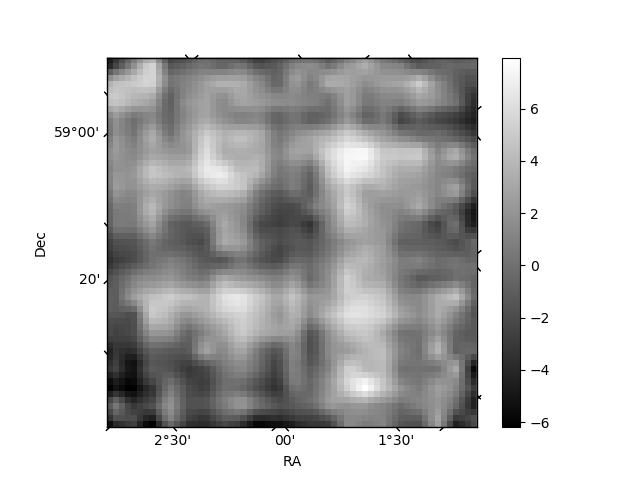
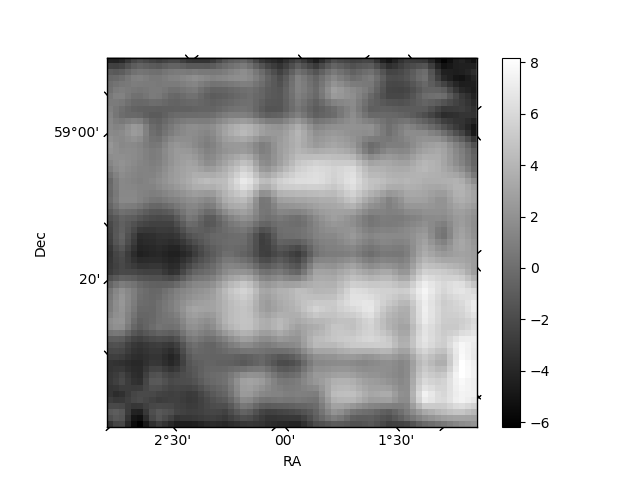
Histogram calculated using DETX and DETY for each event in the final _common_clean file
| Quadrant A | 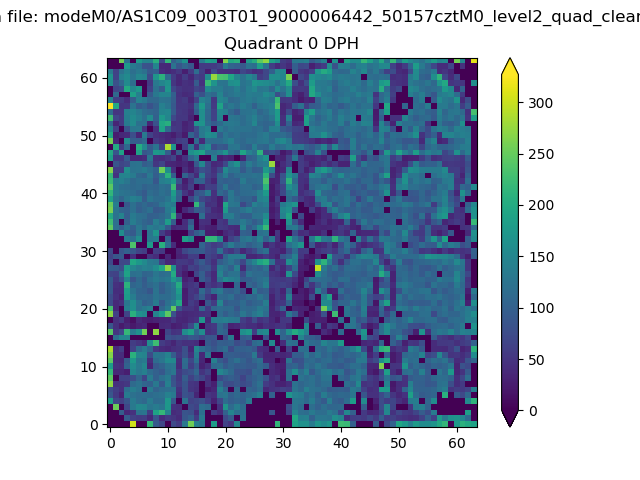 |
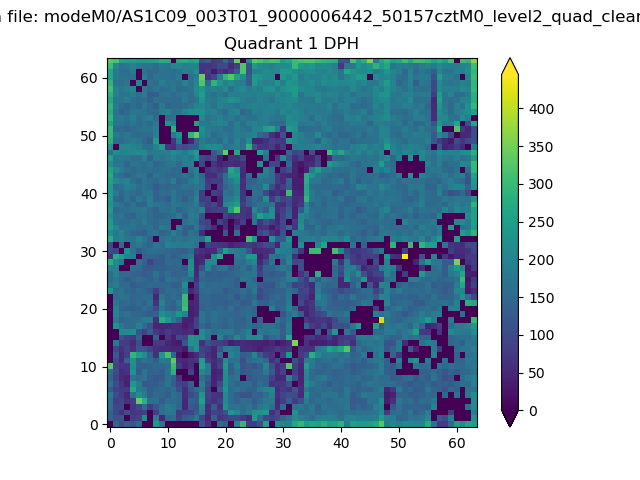 |
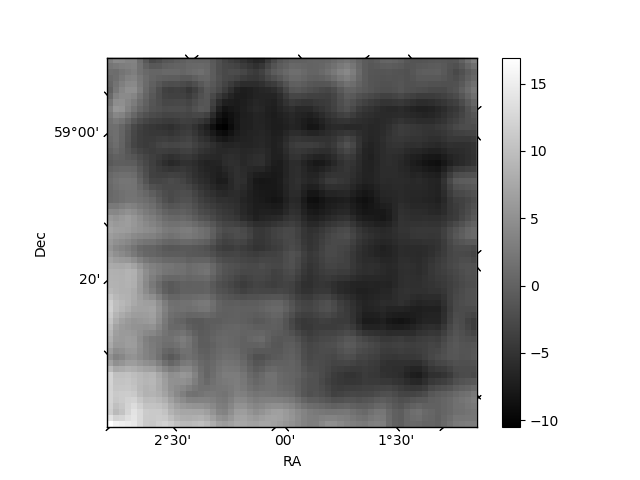
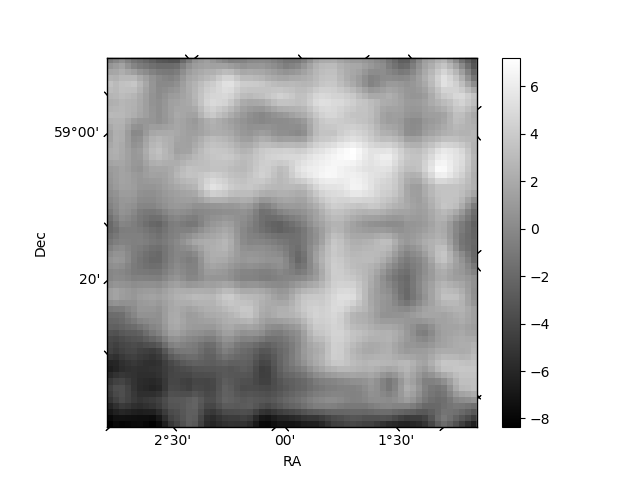
Quadrant B |
|---|---|---|---|
| Quadrant D | 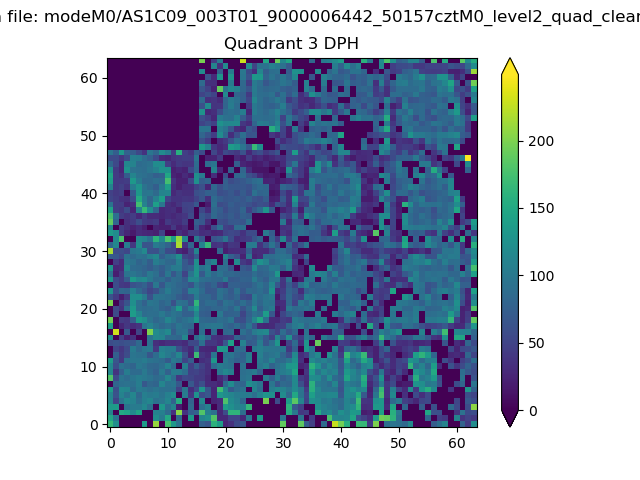 |
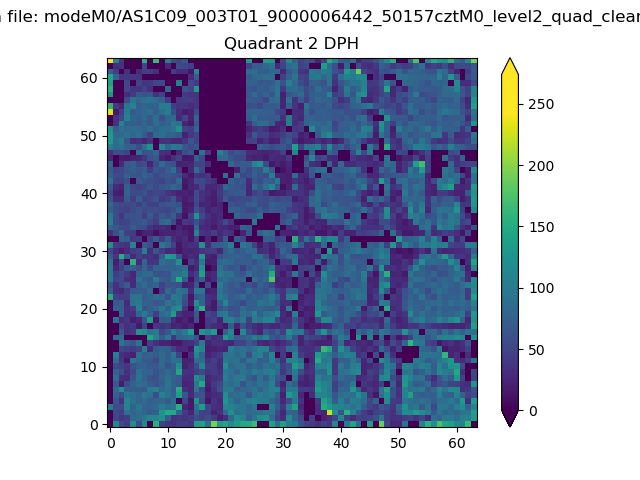 |
Quadrant C |
| Plot type | Count rate plots | Images |
|---|---|---|
| Comparison with Poisson distribution Blue bars denote a histogram of data divided into 1 sec bins. Red curve is a Poisson curve with rate = median count rate of data. |
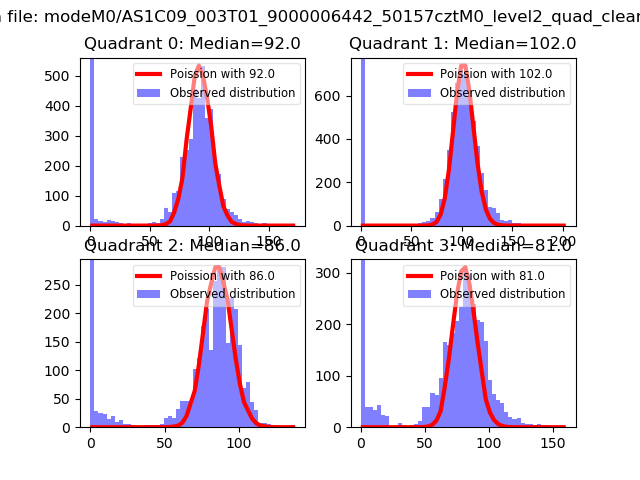 |
 |
| Quadrant-wise count rates Data is divided into 100 sec bins |
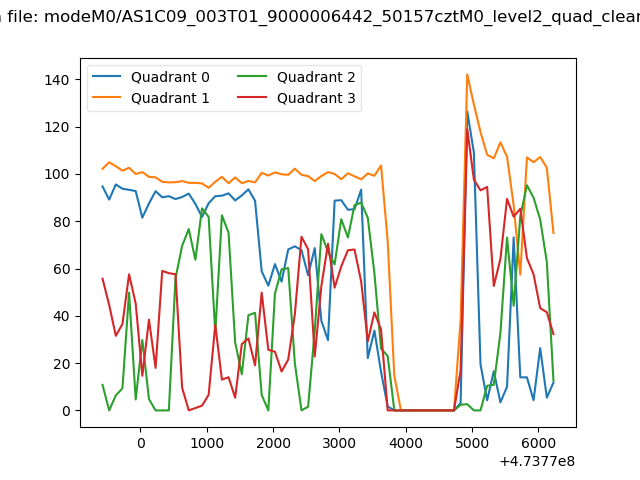 |
|
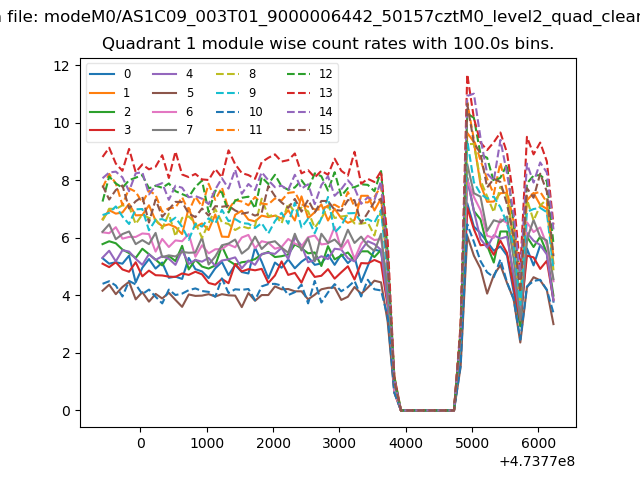
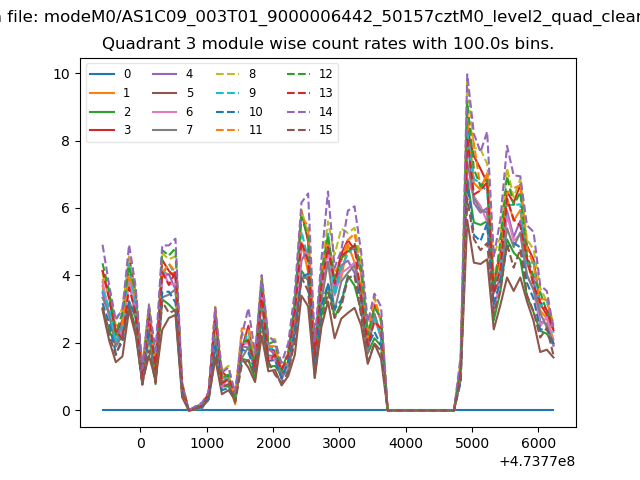
| Module-wise count rates for Quadrant A Data is divided into 100 sec bins |
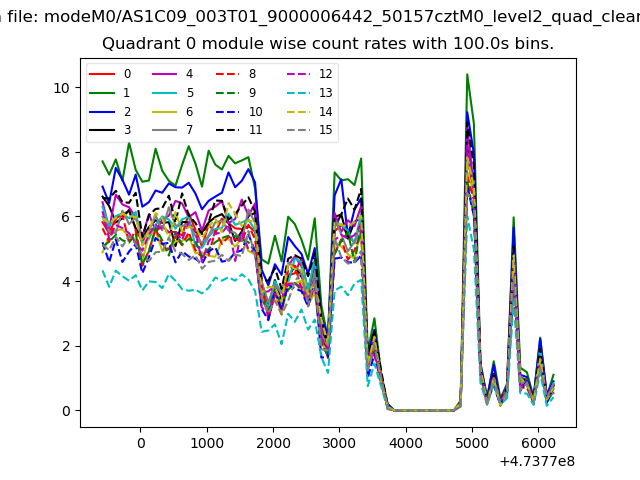 |
 |
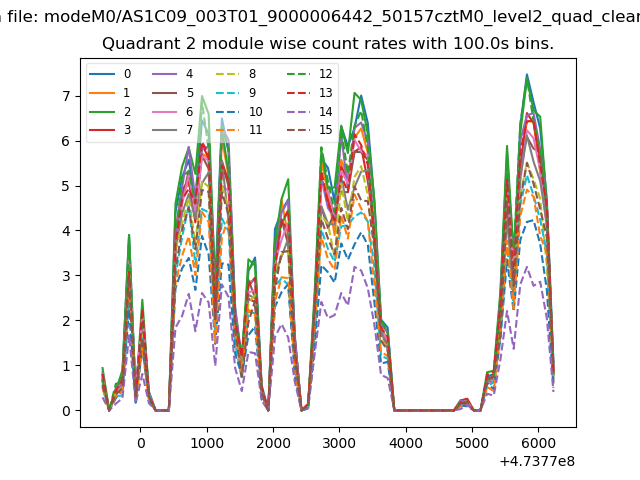
| Module-wise count rates for Quadrant B Data is divided into 100 sec bins |
 |
 |
| Module-wise count rates for Quadrant C Data is divided into 100 sec bins |
 |
 |
| Module-wise count rates for Quadrant D Data is divided into 100 sec bins |
 |
 |
| Parameter | Plot |
|---|---|
| CZT HV Monitor | 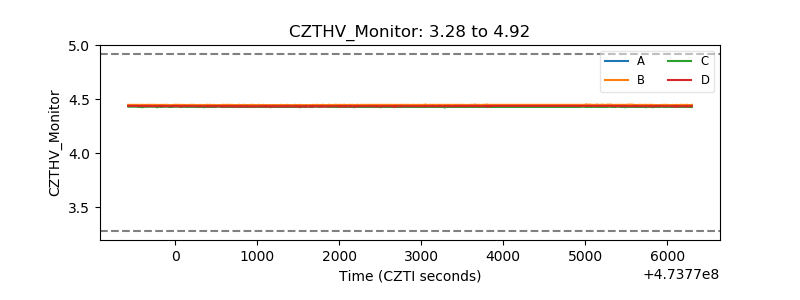 |
| D_VDD | 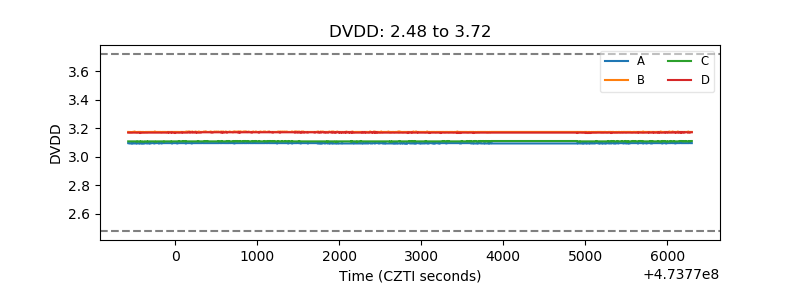 |
| Temperature 1 | 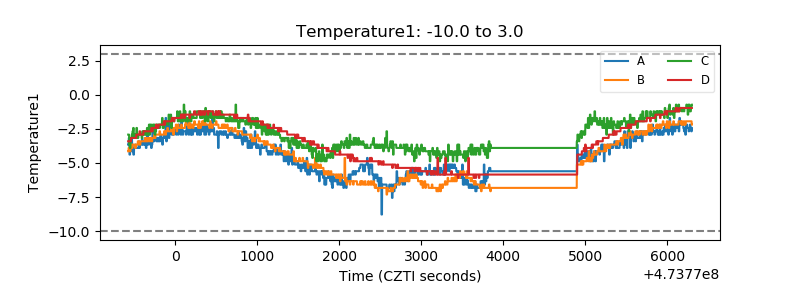 |
| Veto HV Monitor | 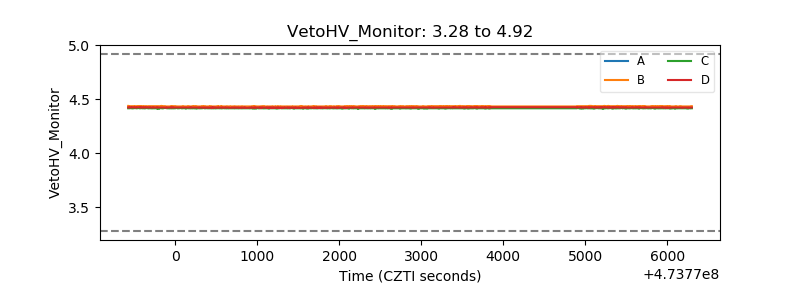 |
| Veto LLD | 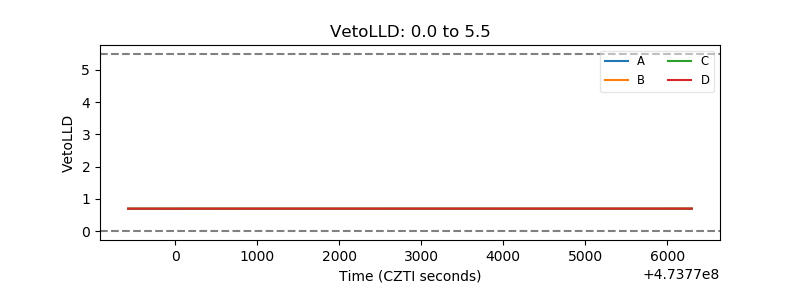 |
| Alpha Counter | 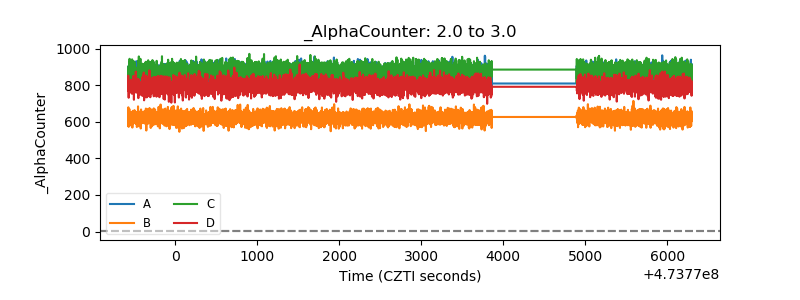 |
| _CPM_Rate | 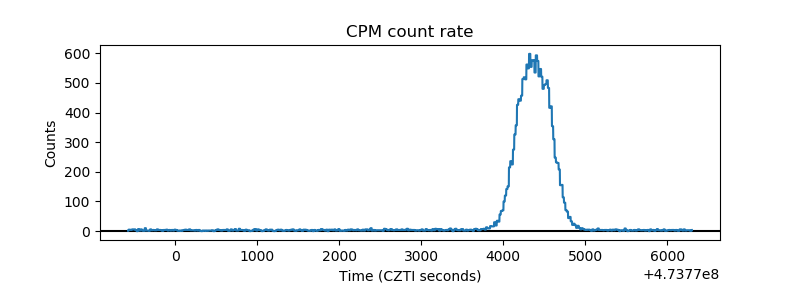 |
| CZT Counter | 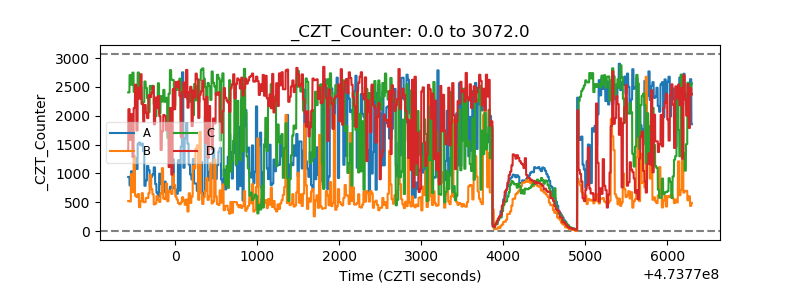 |
| +2.5 Volts monitor |  |
| +5 Volts monitor | 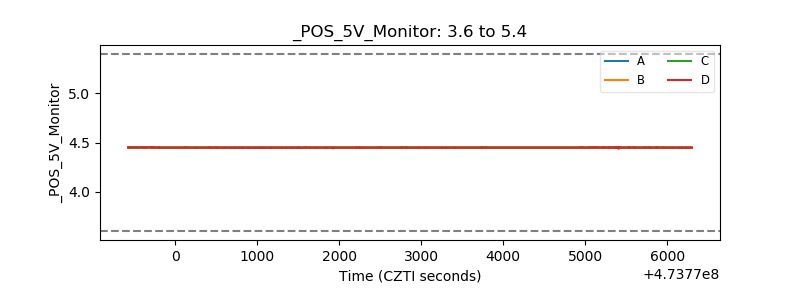 |
| _ROLL_ROT | 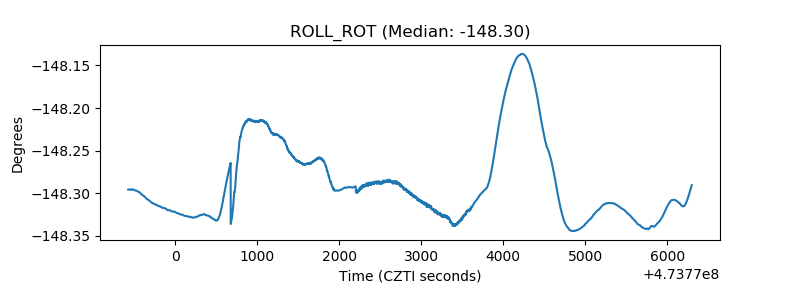 |
| _Roll_DEC | 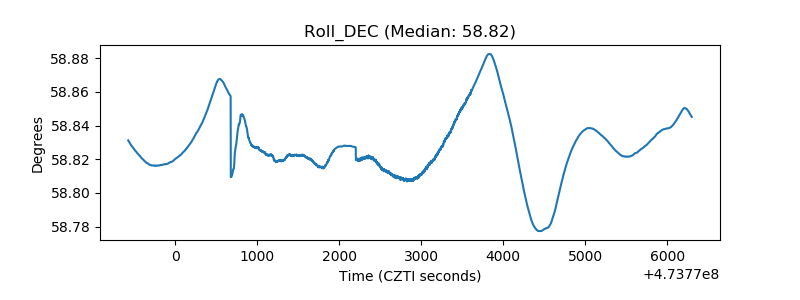 |
| _Roll_RA | 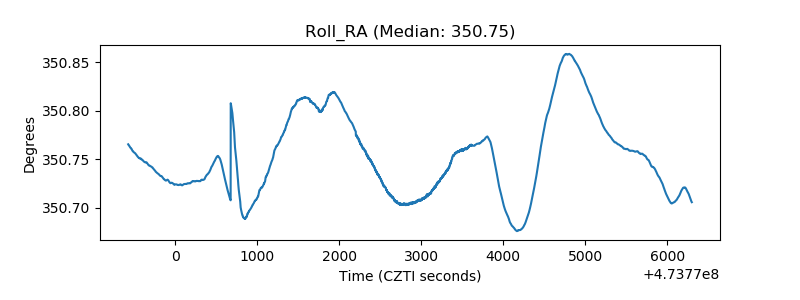 |
| Veto Counter | 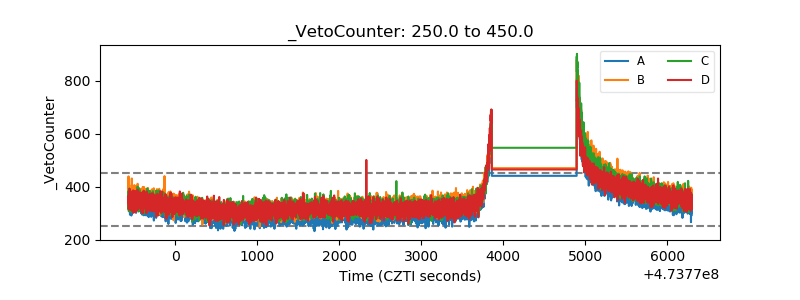 |