| Param | Original file | Final file |
|---|---|---|
| Filename | modeM0/AS1C09_003T01_9000006442_50158cztM0_level2.fits | modeM0/AS1C09_003T01_9000006442_50158cztM0_level2_quad_clean.evt |
| Size (bytes) | 1,208,459,520 | 55,232,640 |
| Size | 1.1 GB | 52.7 MB |
| Events in quadrant A | 12,874,568 | 257,849 |
| Events in quadrant B | 4,785,142 | 633,360 |
| Events in quadrant C | 12,364,082 | 222,529 |
| Events in quadrant D | 14,228,053 | 121,028 |
| Mode M9 | |||
|---|---|---|---|
| Quadrant | BADHDUFLAG | Total packets | Discarded packets |
| A | 0 | 11 | 0 |
| B | 0 | 11 | 0 |
| C | 0 | 11 | 0 |
| D | 0 | 11 | 0 |
| Mode M0 | |||
|---|---|---|---|
| Quadrant | BADHDUFLAG | Total packets | Discarded packets |
| A | 0 | 42546 | 1 |
| B | 0 | 18495 | 1 |
| C | 0 | 41031 | 1 |
| D | 0 | 46567 | 8 |
| Mode SS | |||
|---|---|---|---|
| Quadrant | BADHDUFLAG | Total packets | Discarded packets |
| A | 0 | 128 | 0 |
| B | 0 | 128 | 0 |
| C | 0 | 128 | 0 |
| D | 0 | 128 | 0 |
| Quadrant | Total seconds | Saturated seconds | Saturation percentage |
|---|---|---|---|
| A | 6257 | 4069 | 65.031165% |
| B | 6257 | 416 | 6.648554% |
| C | 6257 | 4174 | 66.709286% |
| D | 6257 | 5138 | 82.116030% |
Noise dominated data is calculated using 1-second bins in cleaned event files. If a bin has >2000 counts, and if more than 50% of those come from <1% of pixels, then it is considered to be noise-dominated and hence unusable.
| Quadrant | # 1 sec bins | Bins with >0 counts | Bins with >2000 counts | High rate bins dominated by noise | Noise dominated (total time) | Noise dominated (detector-on time) | Marked lightcurve |
|---|---|---|---|---|---|---|---|
| A | 7373 | 6257 | 3692 | 3692 | 50.07% | 59.01% | 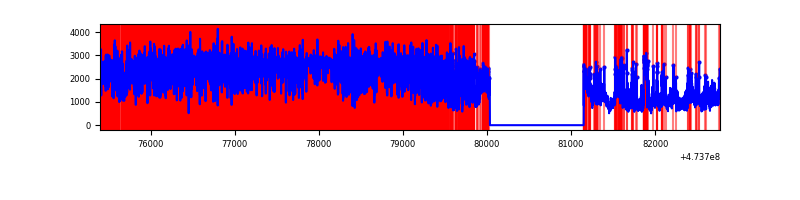 |
| B | 7373 | 6257 | 277 | 277 | 3.76% | 4.43% | 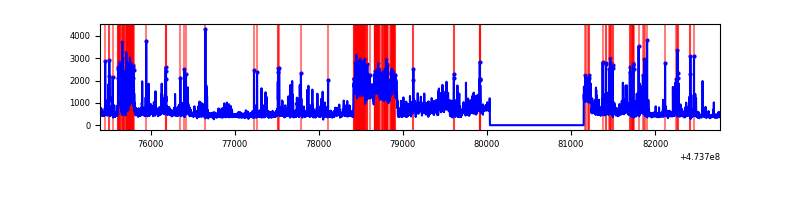 |
| C | 7372 | 6256 | 3658 | 3658 | 49.62% | 58.47% | 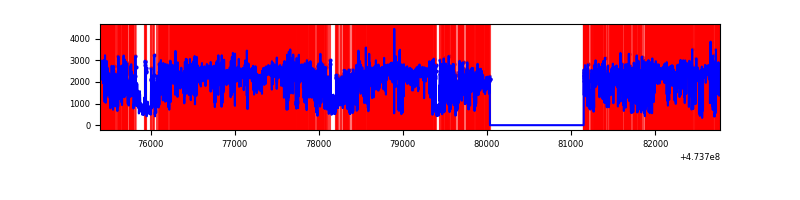 |
| D | 7372 | 6256 | 4800 | 4800 | 65.11% | 76.73% | 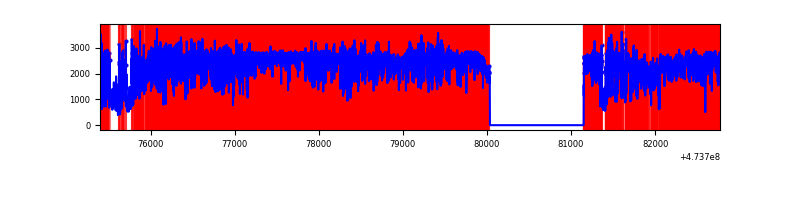 |
Top three noisy pixels from each quadrant. If the there are fewer than three noisy pixels in the level2.evt file, extra rows are filled as -1
| Pixel properties | Quadrant properties | ||||||
|---|---|---|---|---|---|---|---|
| Quadrant | DetID | PixID | Counts | Sigma | Mean | Median | Sigma |
| A | 8 | 8 | 5839180 | 44869.25 | 506 | 493 | 130.1 |
| A | 9 | 191 | 2032207 | 15613.35 | 506 | 493 | 130.1 |
| A | 6 | 250 | 1064374 | 8175.73 | 506 | 493 | 130.1 |
| B | 5 | 185 | 658012 | 4781.43 | 647 | 625 | 137.5 |
| B | 4 | 170 | 591629 | 4298.6 | 647 | 625 | 137.5 |
| B | 5 | 172 | 254361 | 1845.52 | 647 | 625 | 137.5 |
| C | 4 | 111 | 5582608 | 49657.44 | 404 | 401 | 112.4 |
| C | 15 | 230 | 1035347 | 9206.53 | 404 | 401 | 112.4 |
| C | 15 | 147 | 784709 | 6976.94 | 404 | 401 | 112.4 |
| D | 15 | 142 | 2981284 | 28475.1 | 358 | 345 | 104.7 |
| D | 15 | 185 | 2301275 | 21979.39 | 358 | 345 | 104.7 |
| D | 7 | 126 | 1547150 | 14775.69 | 358 | 345 | 104.7 |
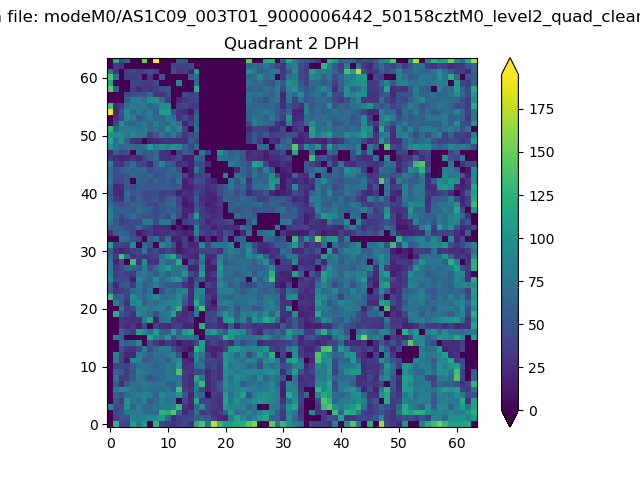
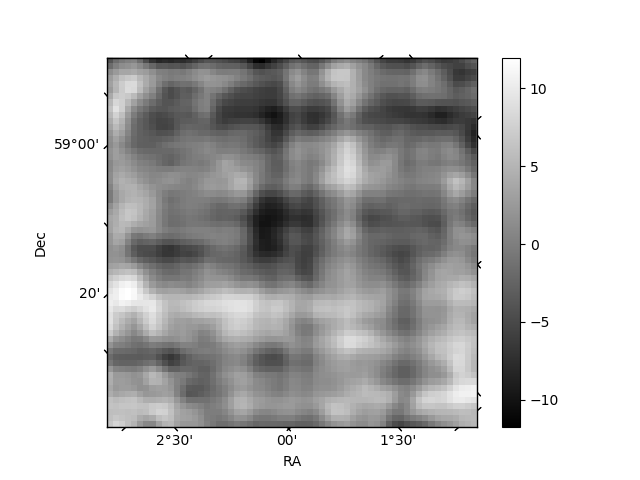
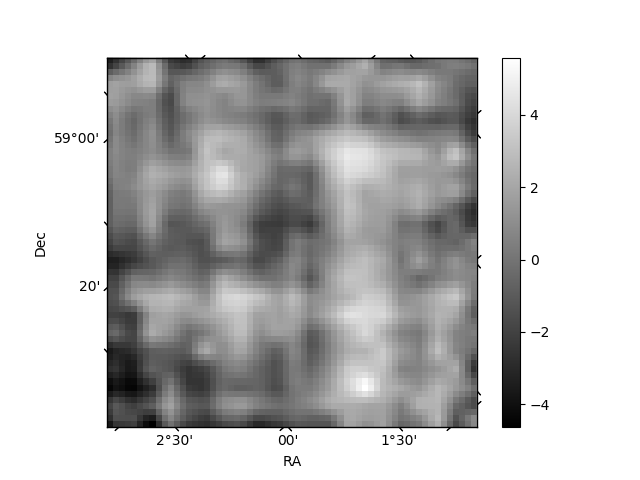
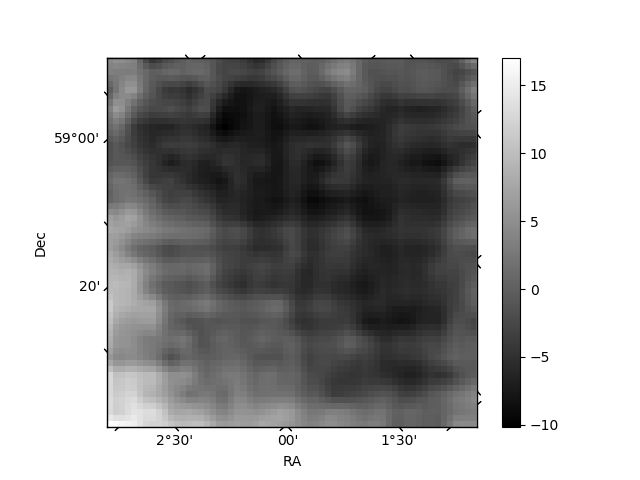
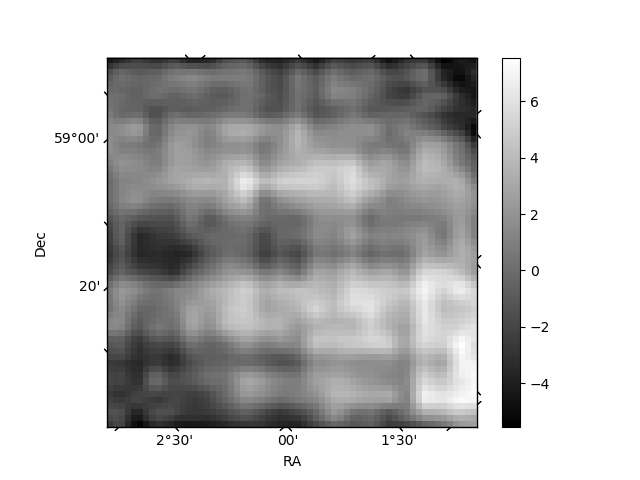
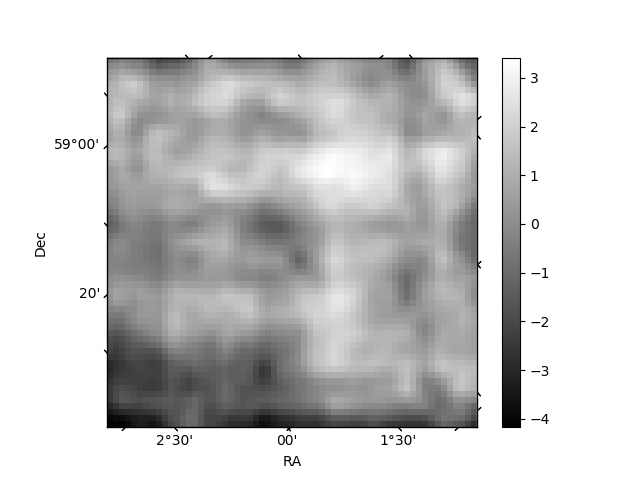
Histogram calculated using DETX and DETY for each event in the final _common_clean file
| Quadrant A | 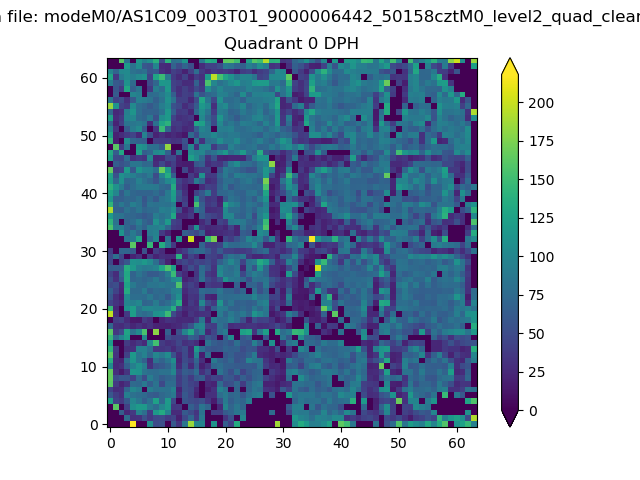 |
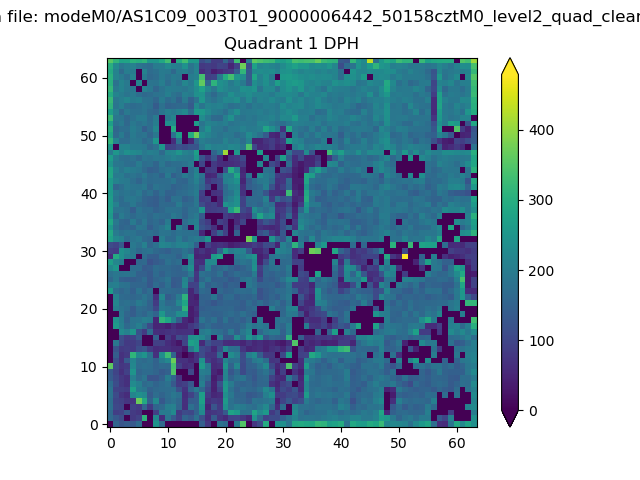 |
Quadrant B |
|---|---|---|---|
| Quadrant D | 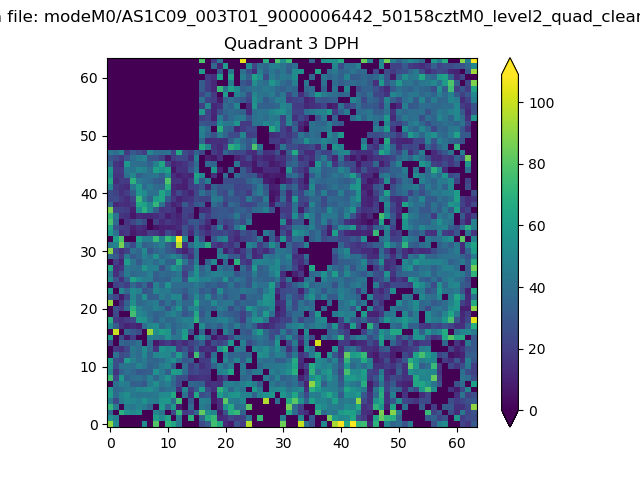 |
 |
Quadrant C |
| Plot type | Count rate plots | Images |
|---|---|---|
| Comparison with Poisson distribution Blue bars denote a histogram of data divided into 1 sec bins. Red curve is a Poisson curve with rate = median count rate of data. |
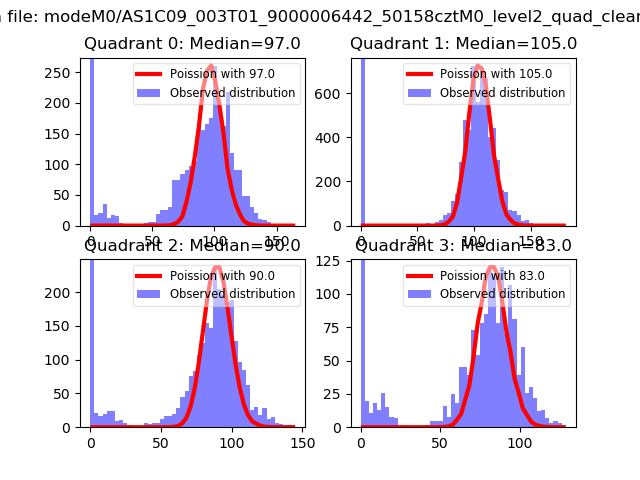 |
 |
| Quadrant-wise count rates Data is divided into 100 sec bins |
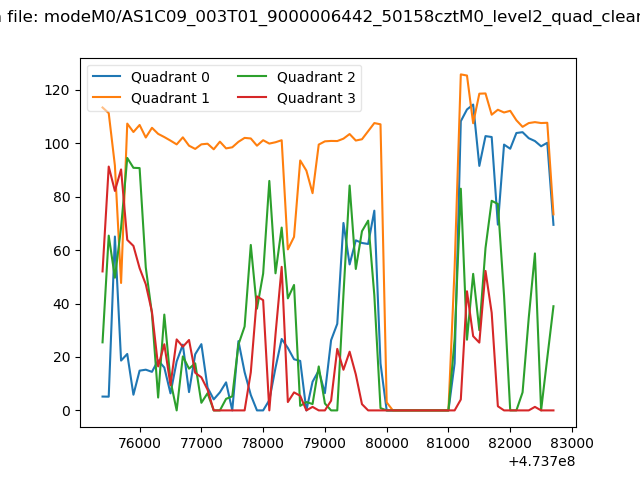 |
|
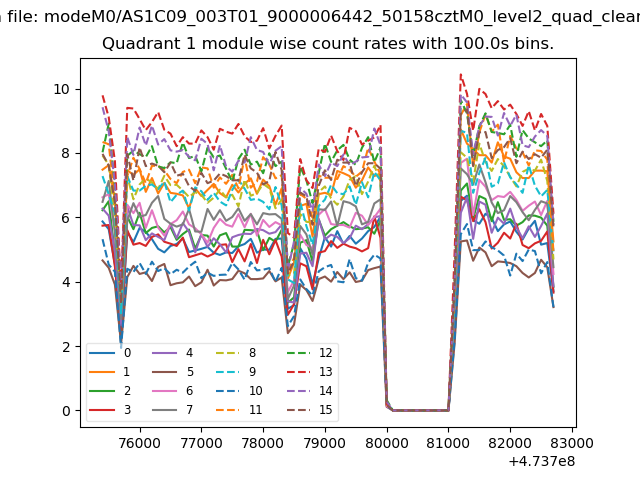
| Module-wise count rates for Quadrant A Data is divided into 100 sec bins |
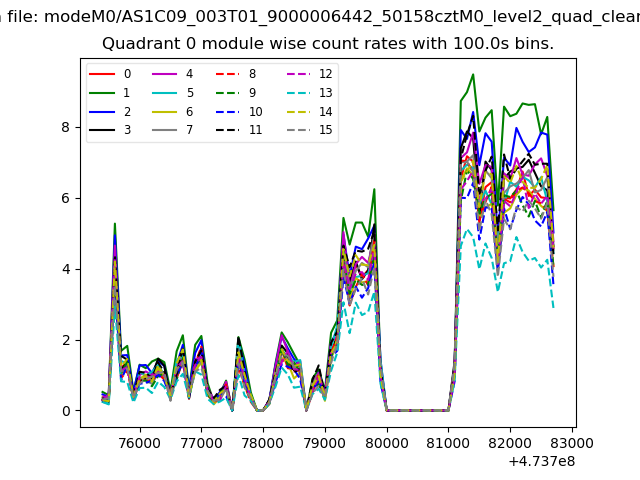 |
 |
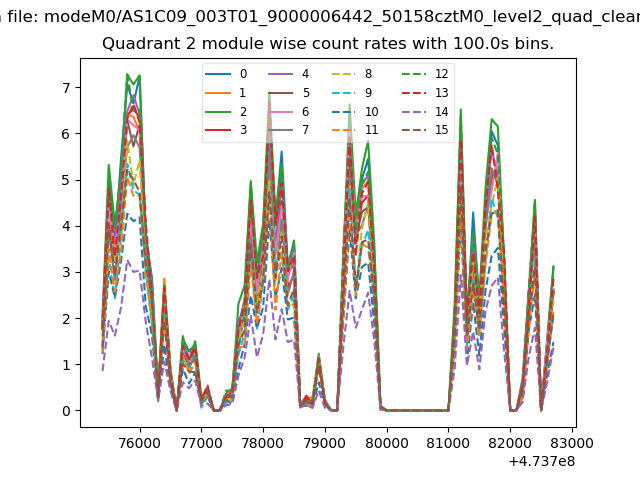
| Module-wise count rates for Quadrant B Data is divided into 100 sec bins |
 |
 |
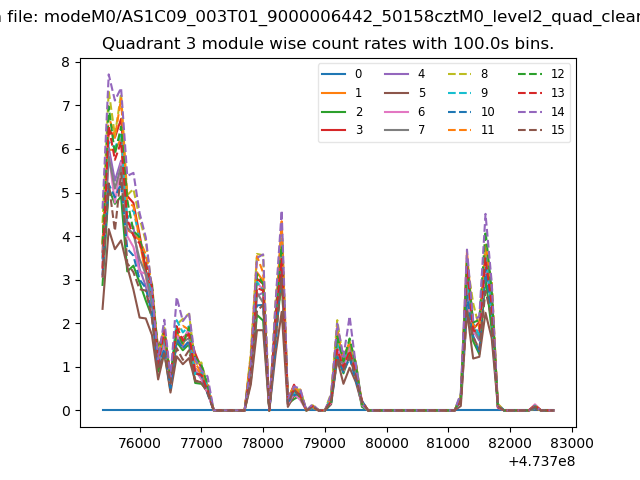
| Module-wise count rates for Quadrant C Data is divided into 100 sec bins |
 |
 |
| Module-wise count rates for Quadrant D Data is divided into 100 sec bins |
 |
 |
| Parameter | Plot |
|---|---|
| CZT HV Monitor |  |
| D_VDD | 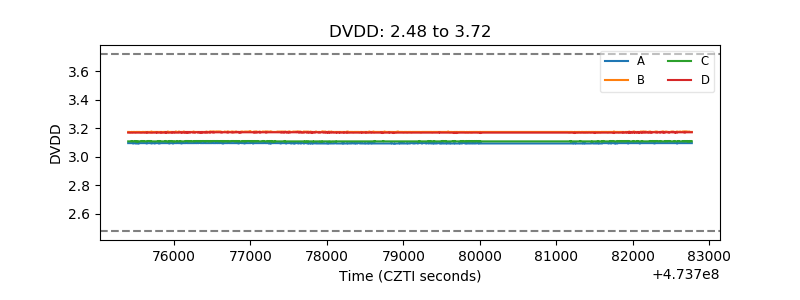 |
| Temperature 1 | 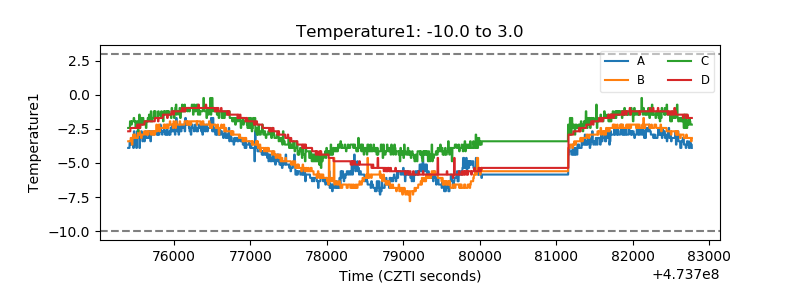 |
| Veto HV Monitor | 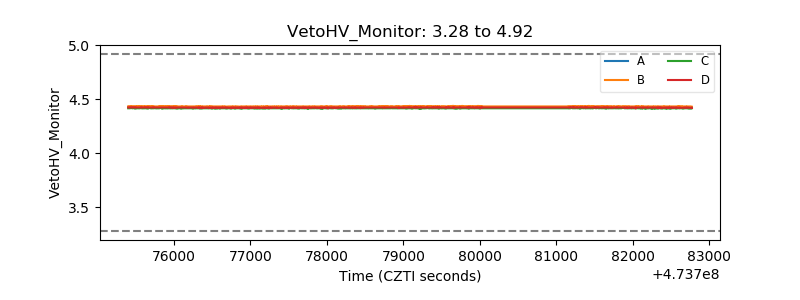 |
| Veto LLD |  |
| Alpha Counter | 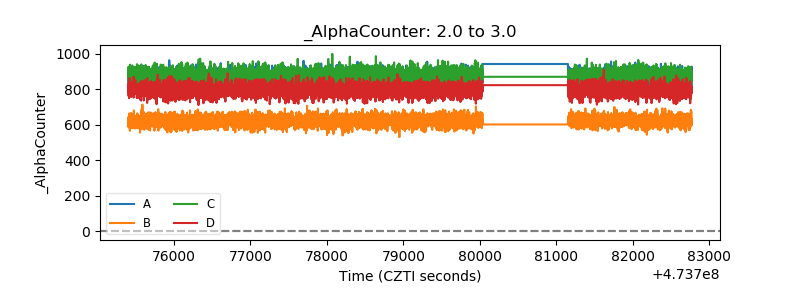 |
| _CPM_Rate | 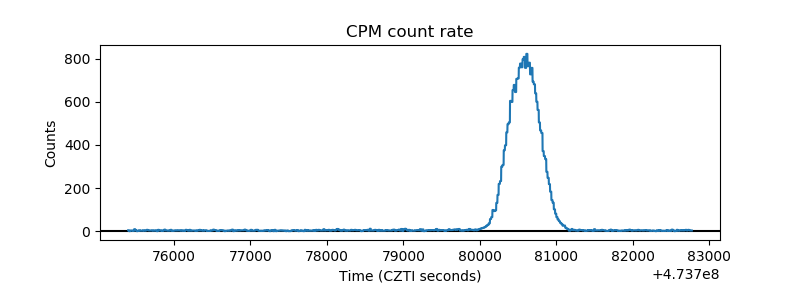 |
| CZT Counter | 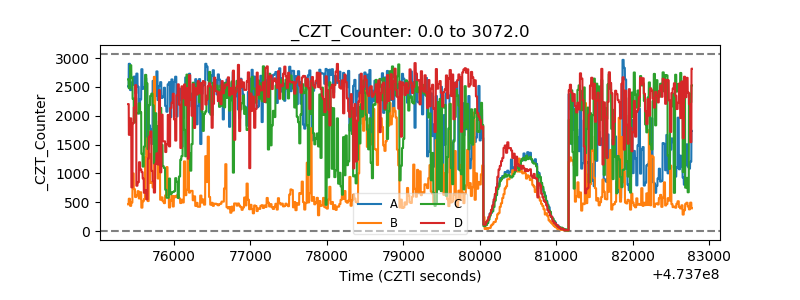 |
| +2.5 Volts monitor | 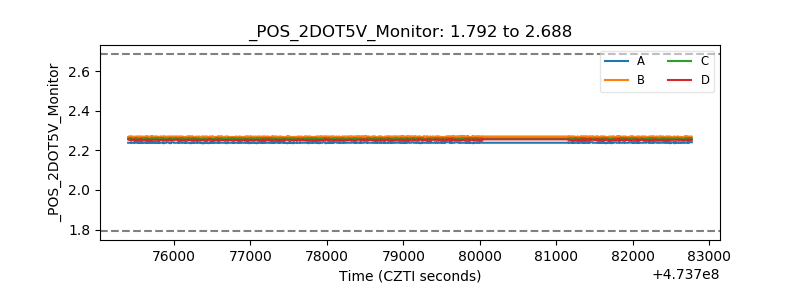 |
| +5 Volts monitor | 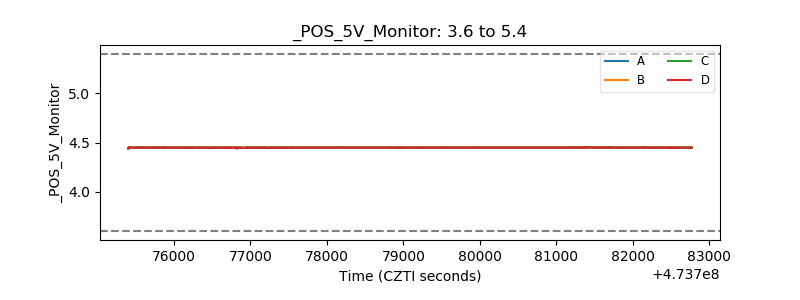 |
| _ROLL_ROT | 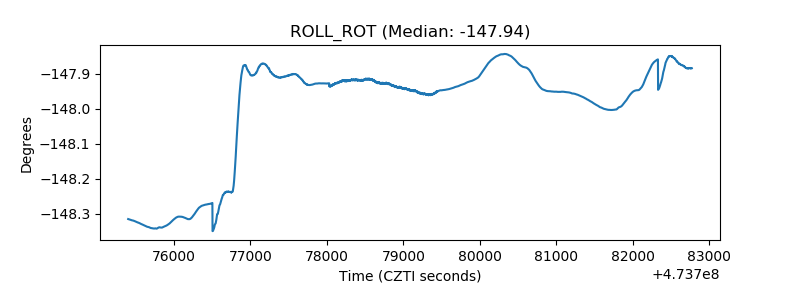 |
| _Roll_DEC | 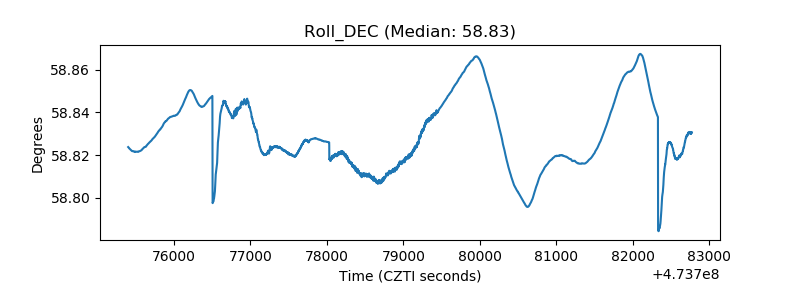 |
| _Roll_RA | 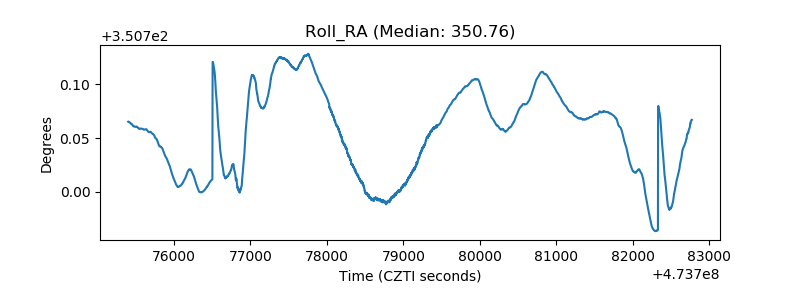 |
| Veto Counter | 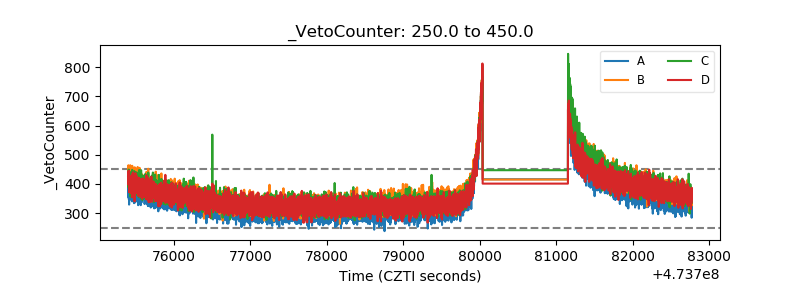 |