| Param | Original file | Final file |
|---|---|---|
| Filename | modeM0/AS1C09_003T01_9000006442_50159cztM0_level2.fits | modeM0/AS1C09_003T01_9000006442_50159cztM0_level2_quad_clean.evt |
| Size (bytes) | 991,546,560 | 67,956,480 |
| Size | 945.6 MB | 64.8 MB |
| Events in quadrant A | 8,336,202 | 536,418 |
| Events in quadrant B | 4,171,445 | 618,132 |
| Events in quadrant C | 10,519,359 | 326,038 |
| Events in quadrant D | 13,207,121 | 151,440 |
| Mode M9 | |||
|---|---|---|---|
| Quadrant | BADHDUFLAG | Total packets | Discarded packets |
| A | 0 | 12 | 0 |
| B | 0 | 12 | 0 |
| C | 0 | 12 | 0 |
| D | 0 | 12 | 0 |
| Mode M0 | |||
|---|---|---|---|
| Quadrant | BADHDUFLAG | Total packets | Discarded packets |
| A | 0 | 29066 | 7 |
| B | 0 | 16585 | 1 |
| C | 0 | 35492 | 1 |
| D | 0 | 43408 | 1 |
| Mode SS | |||
|---|---|---|---|
| Quadrant | BADHDUFLAG | Total packets | Discarded packets |
| A | 0 | 122 | 0 |
| B | 0 | 122 | 0 |
| C | 0 | 122 | 0 |
| D | 0 | 122 | 0 |
| Quadrant | Total seconds | Saturated seconds | Saturation percentage |
|---|---|---|---|
| A | 6095 | 928 | 15.225595% |
| B | 6095 | 406 | 6.661198% |
| C | 6095 | 2978 | 48.859721% |
| D | 6095 | 4597 | 75.422477% |
Noise dominated data is calculated using 1-second bins in cleaned event files. If a bin has >2000 counts, and if more than 50% of those come from <1% of pixels, then it is considered to be noise-dominated and hence unusable.
| Quadrant | # 1 sec bins | Bins with >0 counts | Bins with >2000 counts | High rate bins dominated by noise | Noise dominated (total time) | Noise dominated (detector-on time) | Marked lightcurve |
|---|---|---|---|---|---|---|---|
| A | 7230 | 6095 | 843 | 843 | 11.66% | 13.83% | 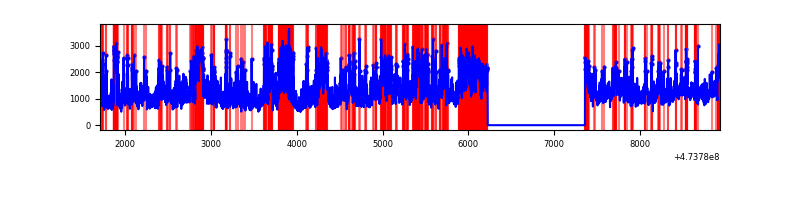 |
| B | 7230 | 6095 | 240 | 240 | 3.32% | 3.94% | 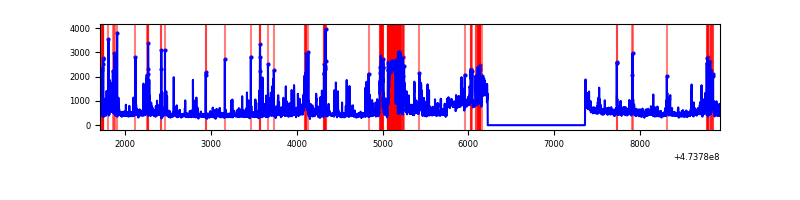 |
| C | 7229 | 6094 | 2631 | 2631 | 36.40% | 43.17% | 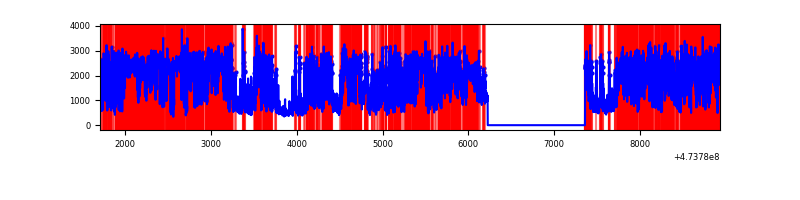 |
| D | 7229 | 6094 | 4222 | 4222 | 58.40% | 69.28% | 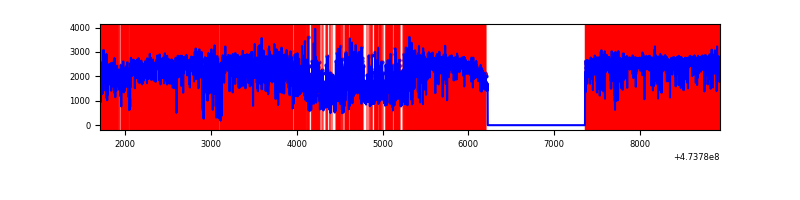 |
Top three noisy pixels from each quadrant. If the there are fewer than three noisy pixels in the level2.evt file, extra rows are filled as -1
| Pixel properties | Quadrant properties | ||||||
|---|---|---|---|---|---|---|---|
| Quadrant | DetID | PixID | Counts | Sigma | Mean | Median | Sigma |
| A | 6 | 250 | 1883932 | 11966.9 | 618 | 602 | 157.4 |
| A | 9 | 191 | 1560392 | 9911.09 | 618 | 602 | 157.4 |
| A | 0 | 98 | 528635 | 3355.18 | 618 | 602 | 157.4 |
| B | 5 | 185 | 808960 | 6177.87 | 627 | 607 | 130.8 |
| B | 3 | 249 | 159003 | 1210.55 | 627 | 607 | 130.8 |
| B | 4 | 170 | 154184 | 1173.72 | 627 | 607 | 130.8 |
| C | 4 | 111 | 2959525 | 22054.22 | 488 | 485 | 134.2 |
| C | 15 | 213 | 1180281 | 8793.22 | 488 | 485 | 134.2 |
| C | 15 | 147 | 763599 | 5687.62 | 488 | 485 | 134.2 |
| D | 15 | 142 | 2560926 | 23200.38 | 373 | 359 | 110.4 |
| D | 15 | 185 | 1306021 | 11830.14 | 373 | 359 | 110.4 |
| D | 12 | 6 | 1283878 | 11629.51 | 373 | 359 | 110.4 |
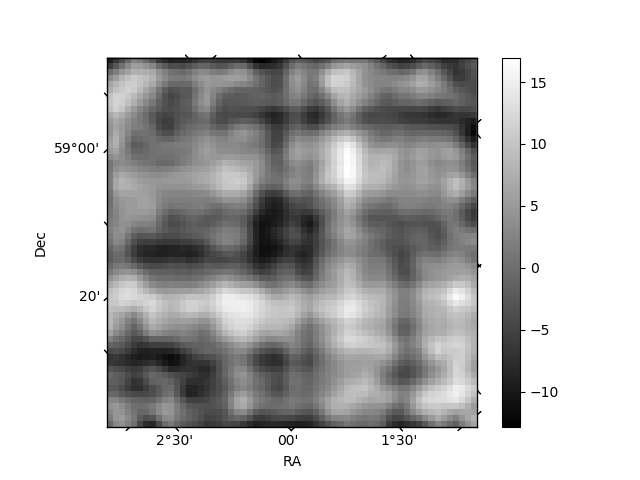
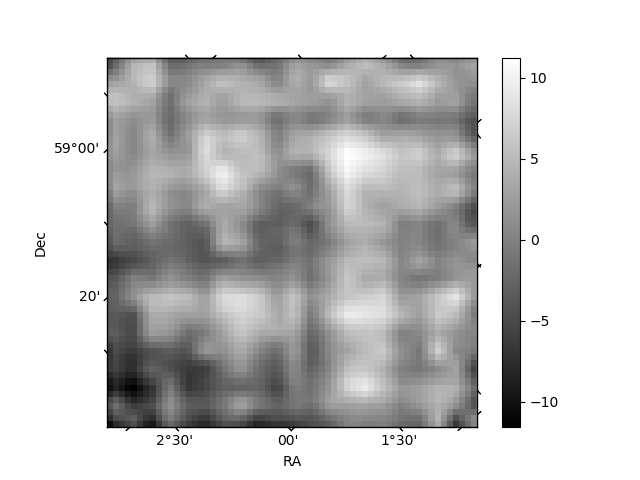
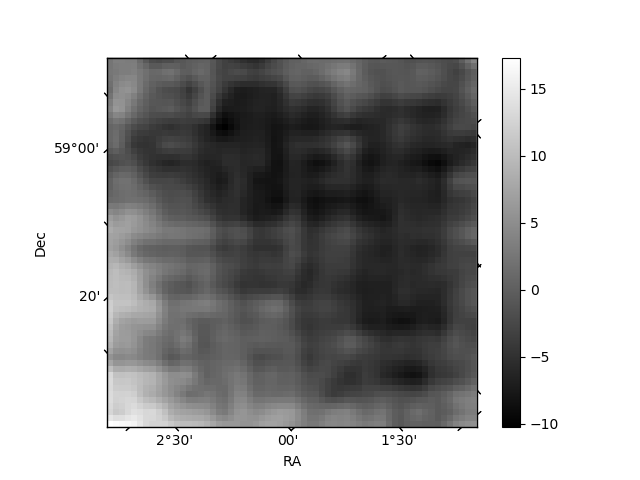
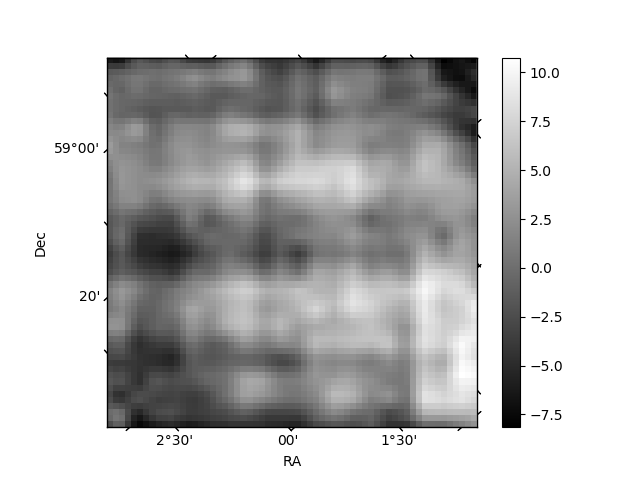
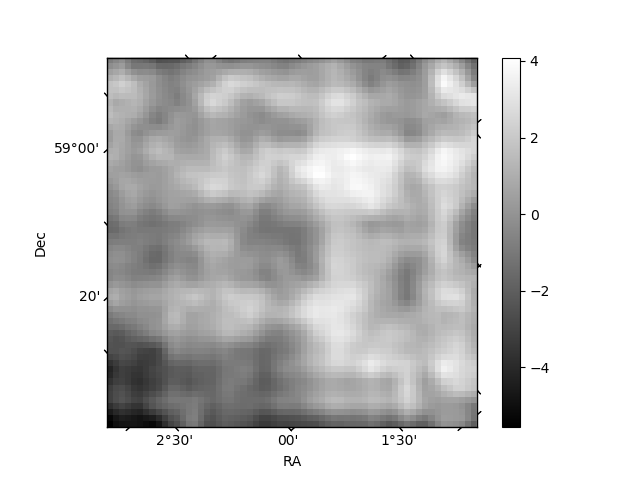
Histogram calculated using DETX and DETY for each event in the final _common_clean file
| Quadrant A | 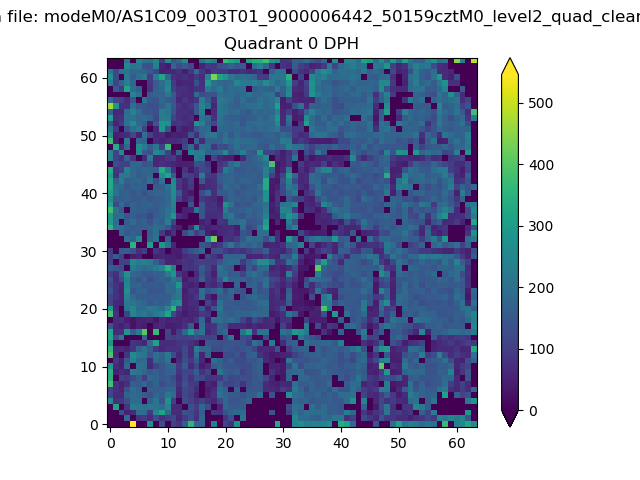 |
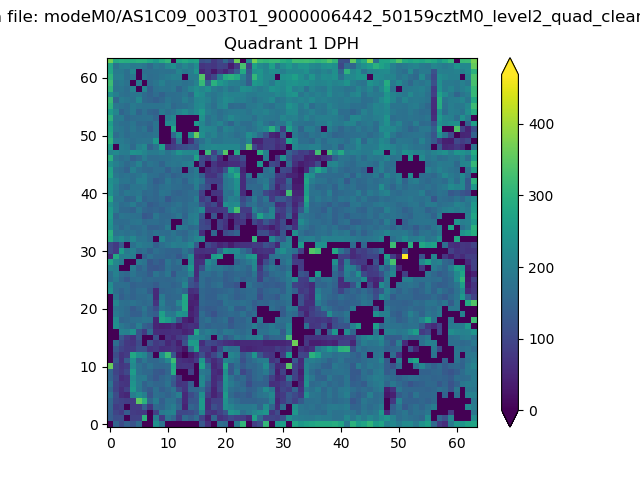 |
Quadrant B |
|---|---|---|---|
| Quadrant D | 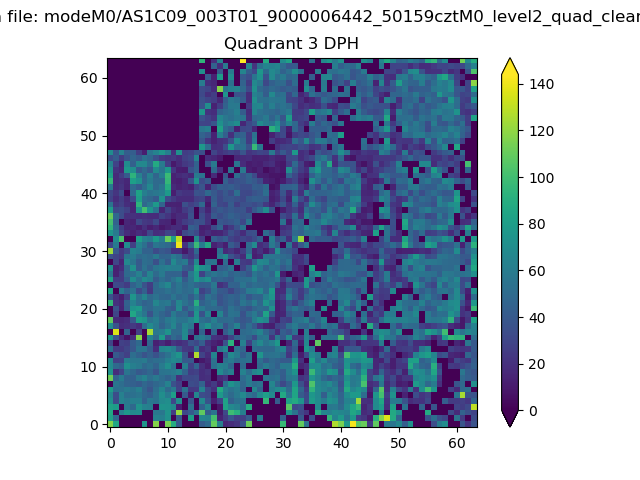 |
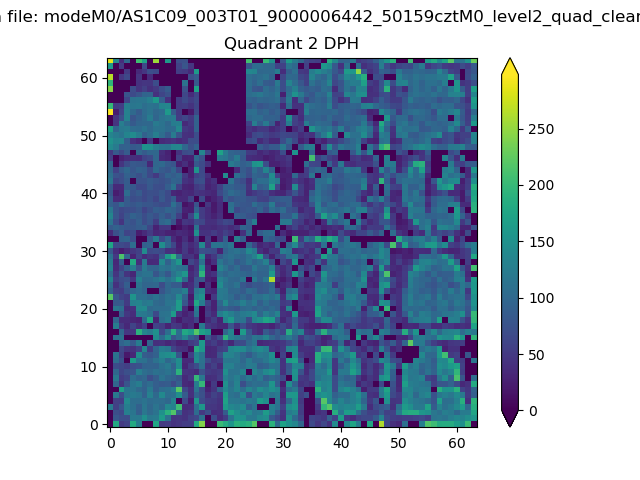 |
Quadrant C |
| Plot type | Count rate plots | Images |
|---|---|---|
| Comparison with Poisson distribution Blue bars denote a histogram of data divided into 1 sec bins. Red curve is a Poisson curve with rate = median count rate of data. |
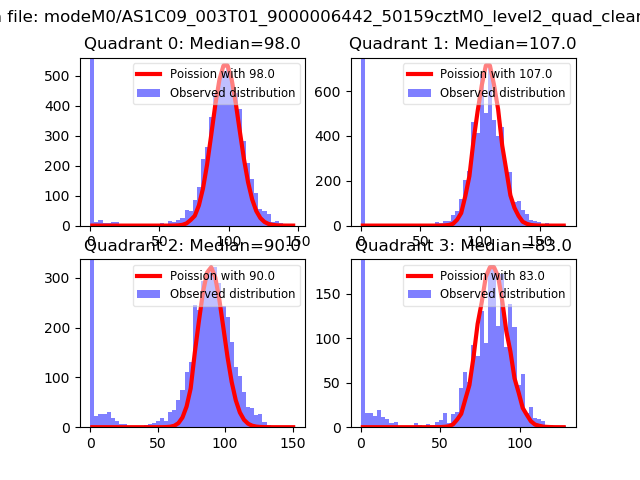 |
 |
| Quadrant-wise count rates Data is divided into 100 sec bins |
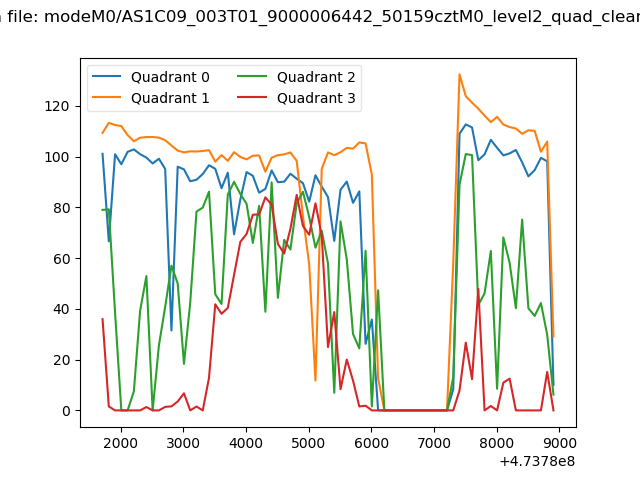 |
|
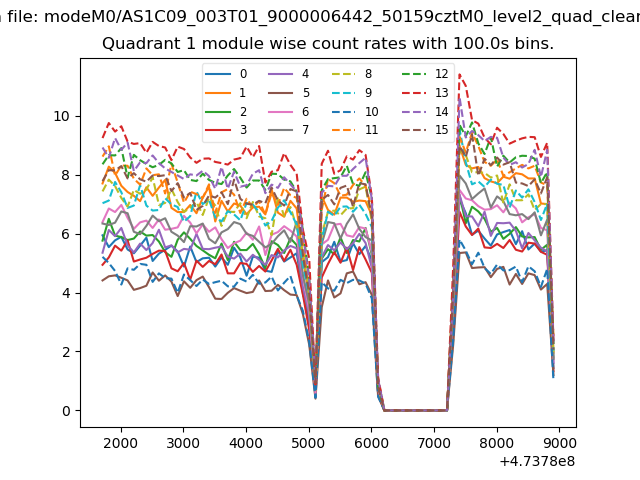
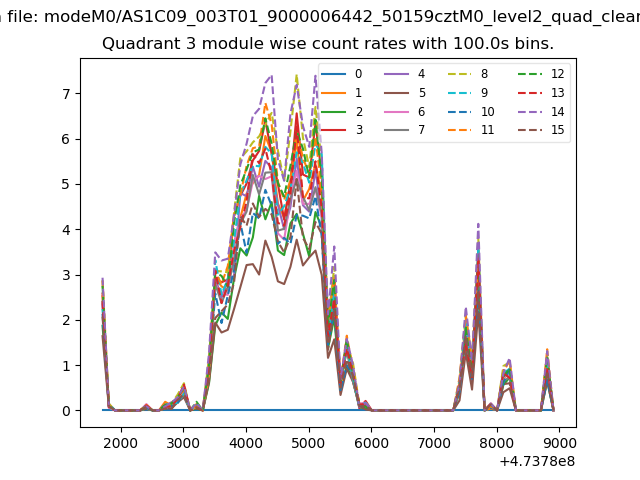
| Module-wise count rates for Quadrant A Data is divided into 100 sec bins |
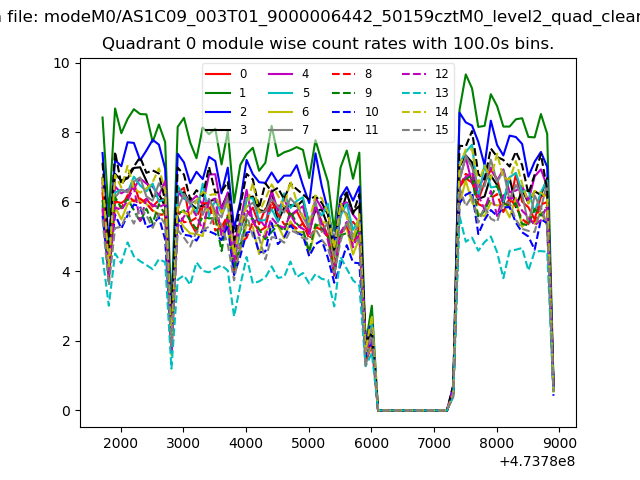 |
 |
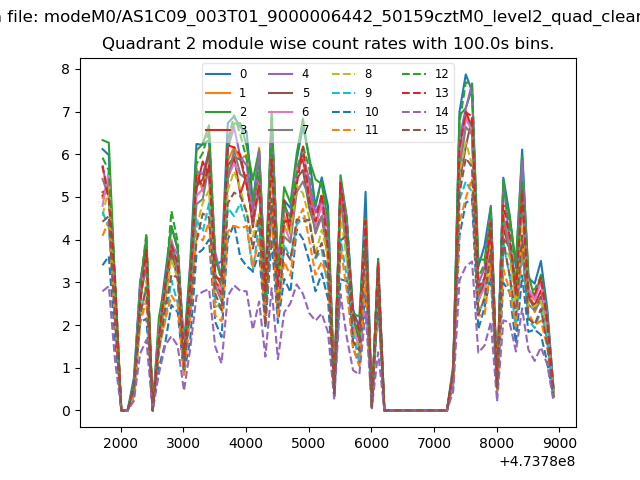
| Module-wise count rates for Quadrant B Data is divided into 100 sec bins |
 |
 |
| Module-wise count rates for Quadrant C Data is divided into 100 sec bins |
 |
 |
| Module-wise count rates for Quadrant D Data is divided into 100 sec bins |
 |
 |
| Parameter | Plot |
|---|---|
| CZT HV Monitor |  |
| D_VDD | 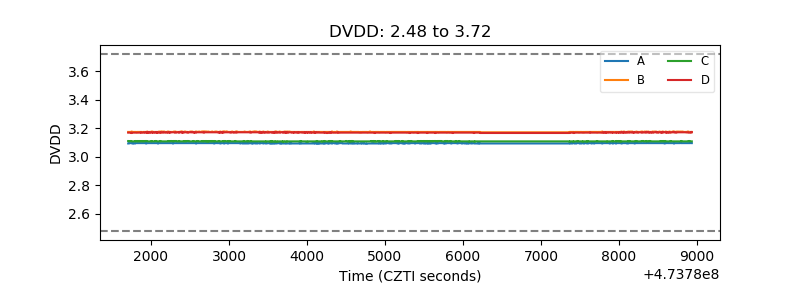 |
| Temperature 1 | 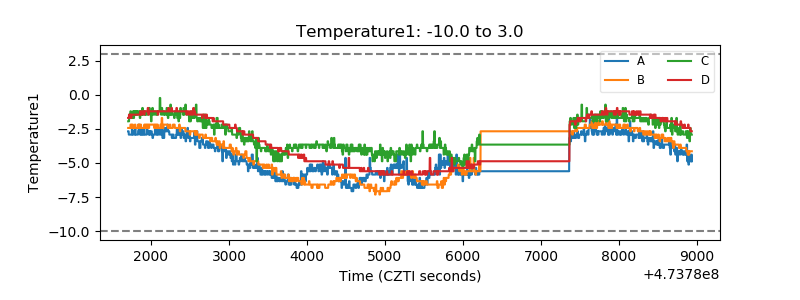 |
| Veto HV Monitor | 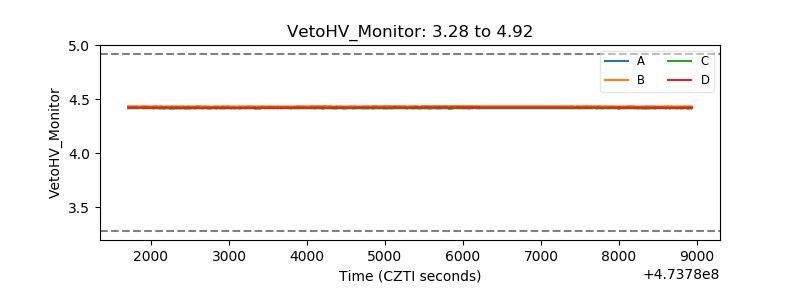 |
| Veto LLD | 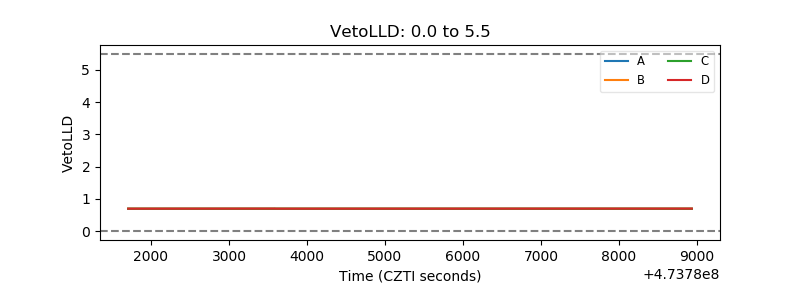 |
| Alpha Counter | 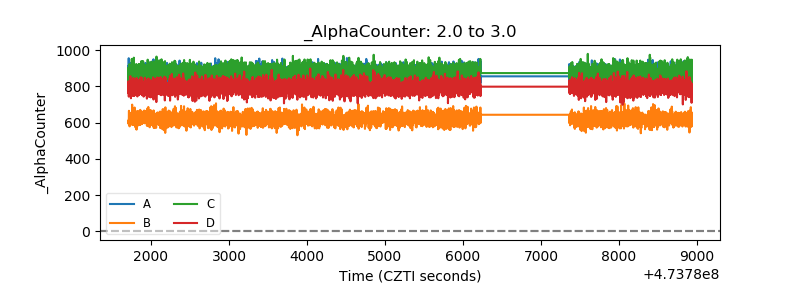 |
| _CPM_Rate | 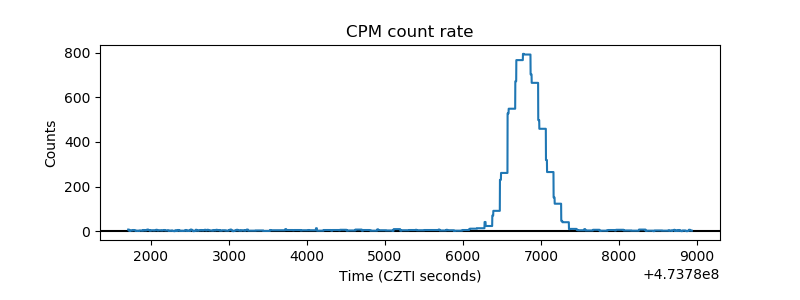 |
| CZT Counter | 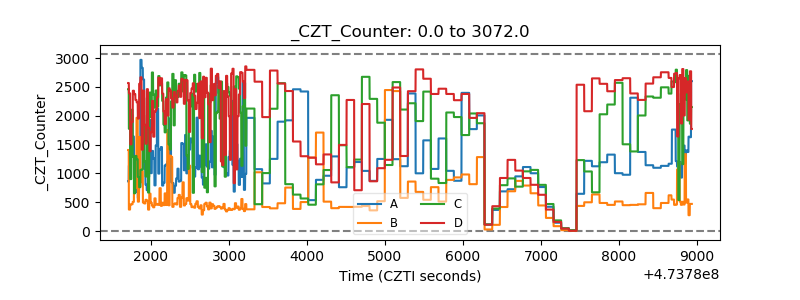 |
| +2.5 Volts monitor |  |
| +5 Volts monitor |  |
| _ROLL_ROT | 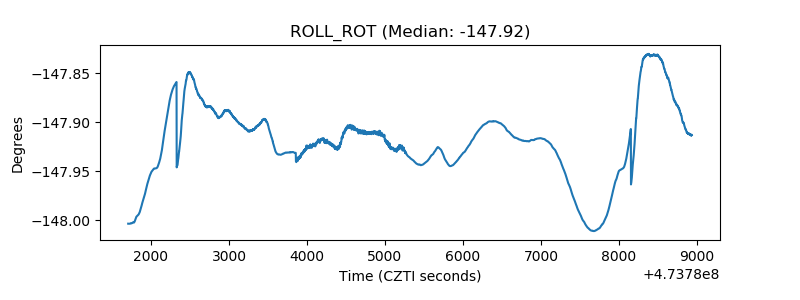 |
| _Roll_DEC | 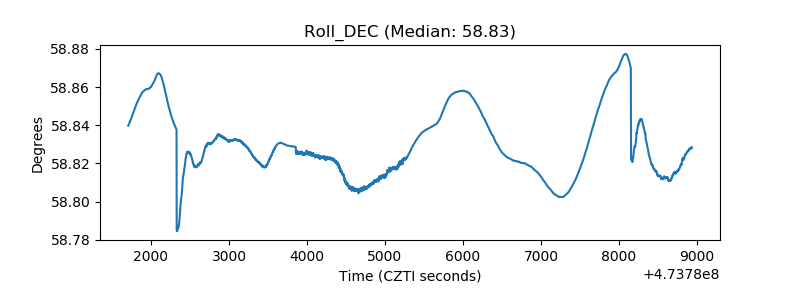 |
| _Roll_RA | 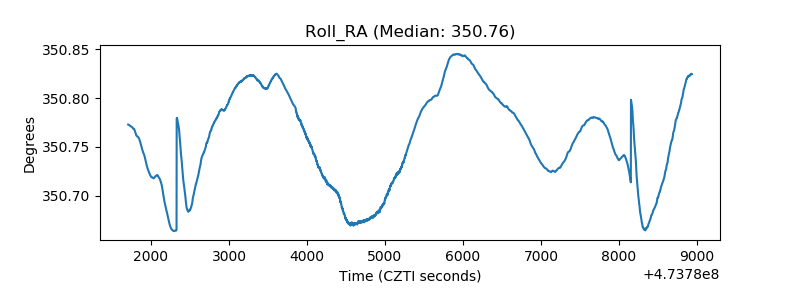 |
| Veto Counter | 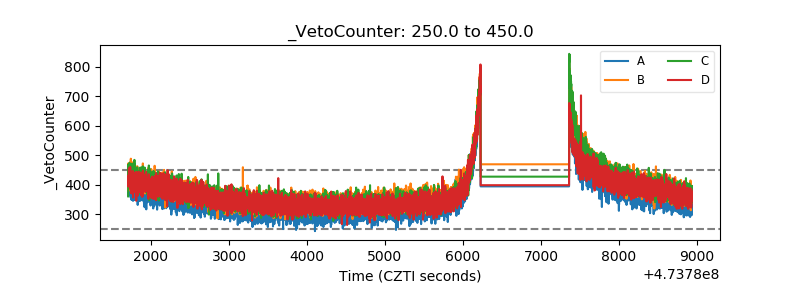 |