| Param | Original file | Final file |
|---|---|---|
| Filename | modeM0/AS1C09_003T01_9000006442_50160cztM0_level2.fits | modeM0/AS1C09_003T01_9000006442_50160cztM0_level2_quad_clean.evt |
| Size (bytes) | 1,149,788,160 | 53,562,240 |
| Size | 1.1 GB | 51.1 MB |
| Events in quadrant A | 11,638,123 | 300,354 |
| Events in quadrant B | 3,477,717 | 644,108 |
| Events in quadrant C | 12,326,290 | 202,951 |
| Events in quadrant D | 14,644,433 | 43,637 |
| Mode M9 | |||
|---|---|---|---|
| Quadrant | BADHDUFLAG | Total packets | Discarded packets |
| A | 0 | 11 | 0 |
| B | 0 | 11 | 0 |
| C | 0 | 11 | 0 |
| D | 0 | 11 | 0 |
| Mode M0 | |||
|---|---|---|---|
| Quadrant | BADHDUFLAG | Total packets | Discarded packets |
| A | 0 | 38845 | 2 |
| B | 0 | 14533 | 1 |
| C | 0 | 40842 | 1 |
| D | 0 | 47679 | 1 |
| Mode SS | |||
|---|---|---|---|
| Quadrant | BADHDUFLAG | Total packets | Discarded packets |
| A | 0 | 126 | 0 |
| B | 0 | 126 | 0 |
| C | 0 | 126 | 0 |
| D | 0 | 126 | 0 |
| Quadrant | Total seconds | Saturated seconds | Saturation percentage |
|---|---|---|---|
| A | 6162 | 3271 | 53.083414% |
| B | 6162 | 168 | 2.726388% |
| C | 6163 | 4272 | 69.316891% |
| D | 6163 | 5749 | 93.282492% |
Noise dominated data is calculated using 1-second bins in cleaned event files. If a bin has >2000 counts, and if more than 50% of those come from <1% of pixels, then it is considered to be noise-dominated and hence unusable.
| Quadrant | # 1 sec bins | Bins with >0 counts | Bins with >2000 counts | High rate bins dominated by noise | Noise dominated (total time) | Noise dominated (detector-on time) | Marked lightcurve |
|---|---|---|---|---|---|---|---|
| A | 7246 | 6161 | 3238 | 3238 | 44.69% | 52.56% | 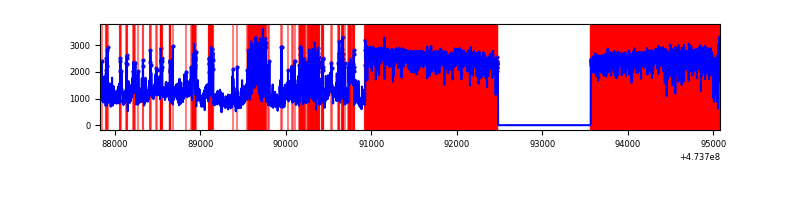 |
| B | 7247 | 6162 | 88 | 88 | 1.21% | 1.43% | 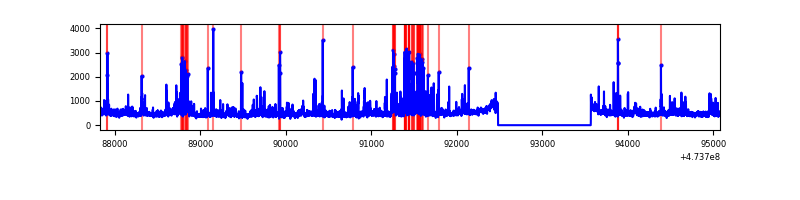 |
| C | 7248 | 6163 | 3693 | 3693 | 50.95% | 59.92% | 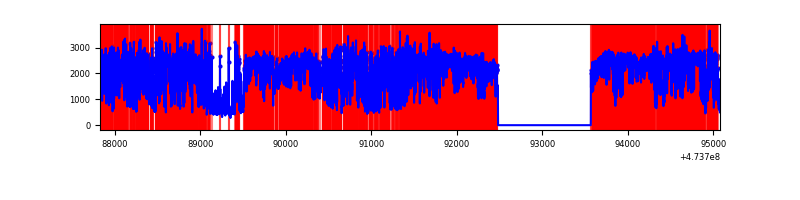 |
| D | 7247 | 6162 | 5298 | 5298 | 73.11% | 85.98% | 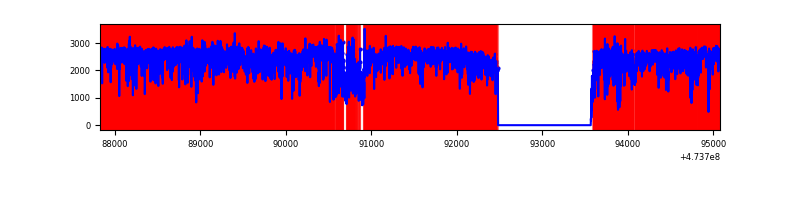 |
Top three noisy pixels from each quadrant. If the there are fewer than three noisy pixels in the level2.evt file, extra rows are filled as -1
| Pixel properties | Quadrant properties | ||||||
|---|---|---|---|---|---|---|---|
| Quadrant | DetID | PixID | Counts | Sigma | Mean | Median | Sigma |
| A | 6 | 250 | 6429428 | 49587.21 | 500 | 487 | 129.6 |
| A | 0 | 98 | 741985 | 5719.27 | 500 | 487 | 129.6 |
| A | 9 | 191 | 657097 | 5064.51 | 500 | 487 | 129.6 |
| B | 5 | 185 | 354390 | 2604.43 | 649 | 628 | 135.8 |
| B | 0 | 155 | 112223 | 821.57 | 649 | 628 | 135.8 |
| B | 4 | 216 | 44937 | 326.21 | 649 | 628 | 135.8 |
| C | 4 | 111 | 5897764 | 53561.12 | 390 | 388 | 110.1 |
| C | 15 | 147 | 1059497 | 9619.03 | 390 | 388 | 110.1 |
| C | 15 | 213 | 687453 | 6240.06 | 390 | 388 | 110.1 |
| D | 15 | 142 | 7318324 | 94359.75 | 249 | 239 | 77.6 |
| D | 7 | 204 | 1430072 | 18436.34 | 249 | 239 | 77.6 |
| D | 7 | 126 | 888975 | 11459.41 | 249 | 239 | 77.6 |
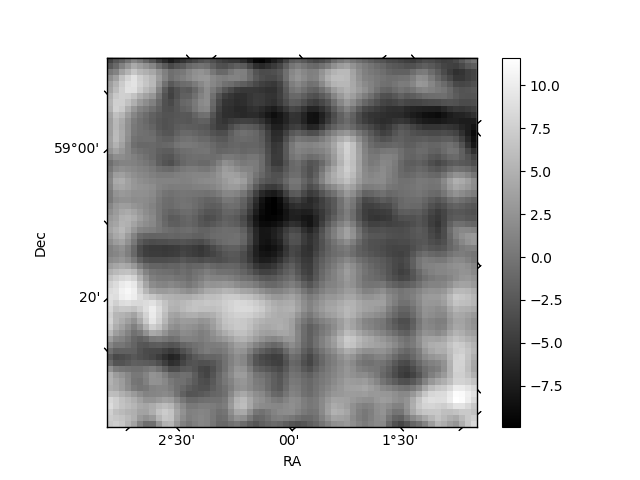
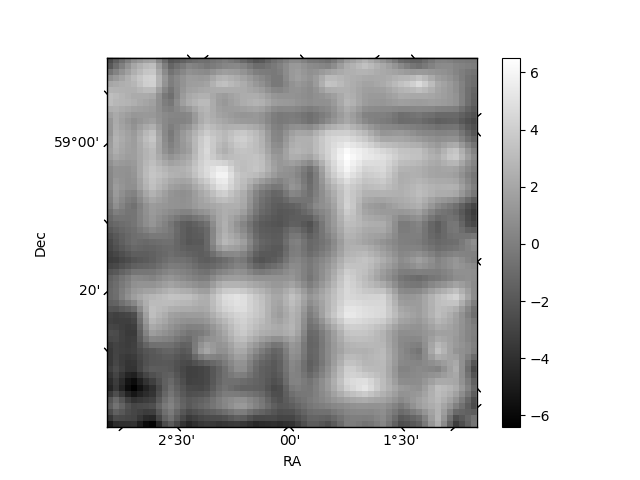
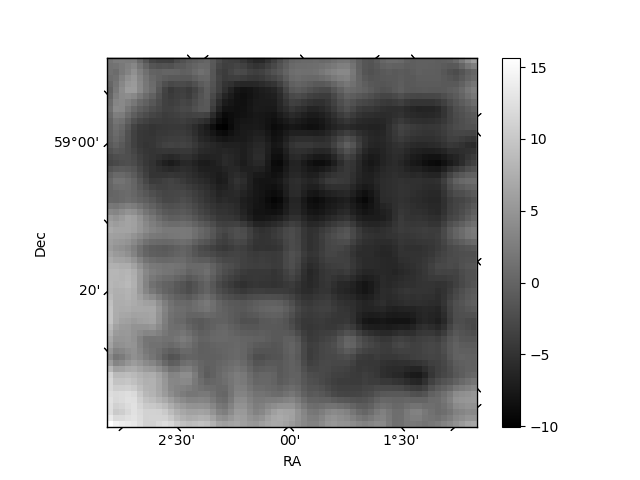
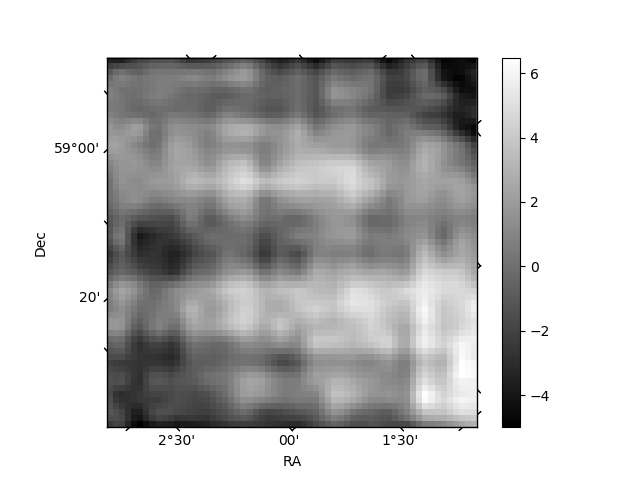
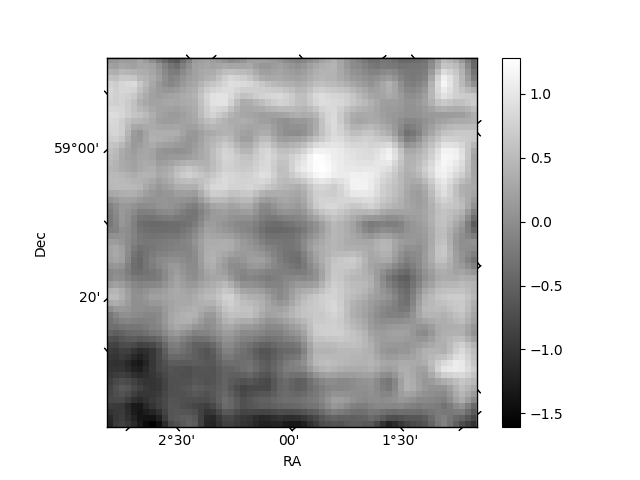
Histogram calculated using DETX and DETY for each event in the final _common_clean file
| Quadrant A | 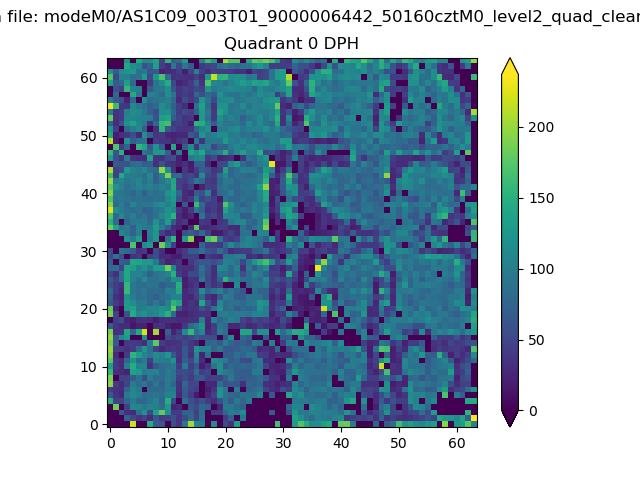 |
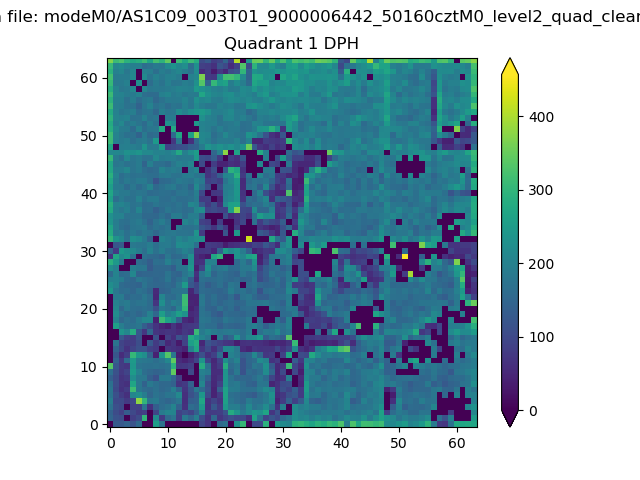 |
Quadrant B |
|---|---|---|---|
| Quadrant D | 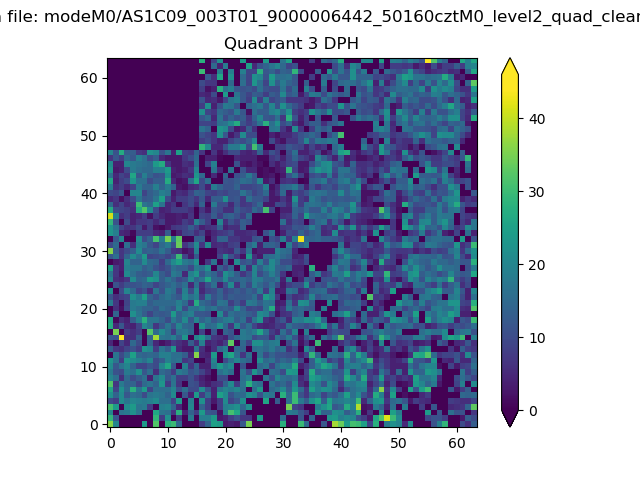 |
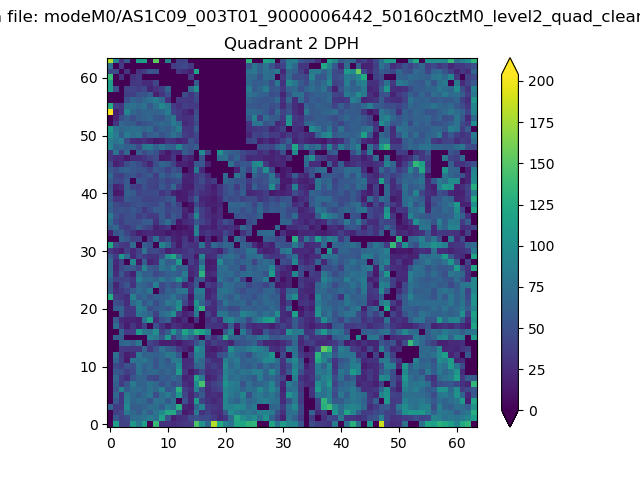 |
Quadrant C |
| Plot type | Count rate plots | Images |
|---|---|---|
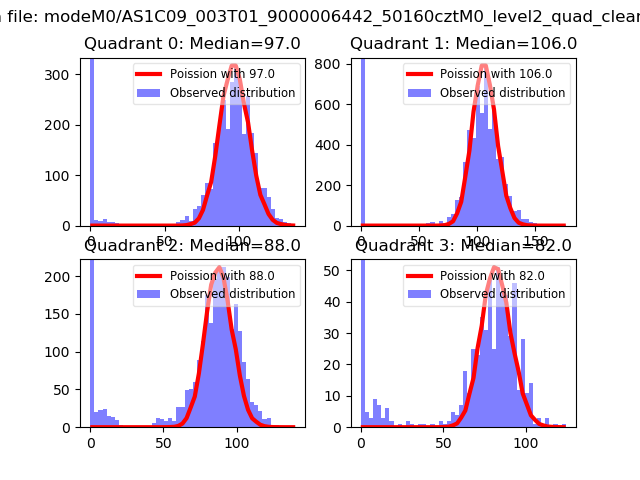
| Comparison with Poisson distribution Blue bars denote a histogram of data divided into 1 sec bins. Red curve is a Poisson curve with rate = median count rate of data. |
 |
 |
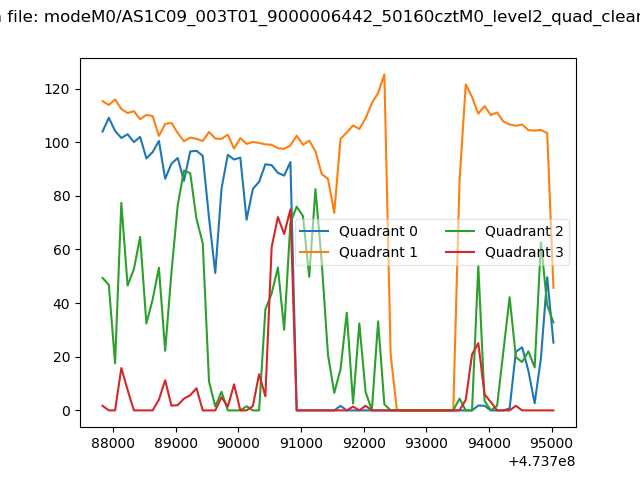
| Quadrant-wise count rates Data is divided into 100 sec bins |
 |
|
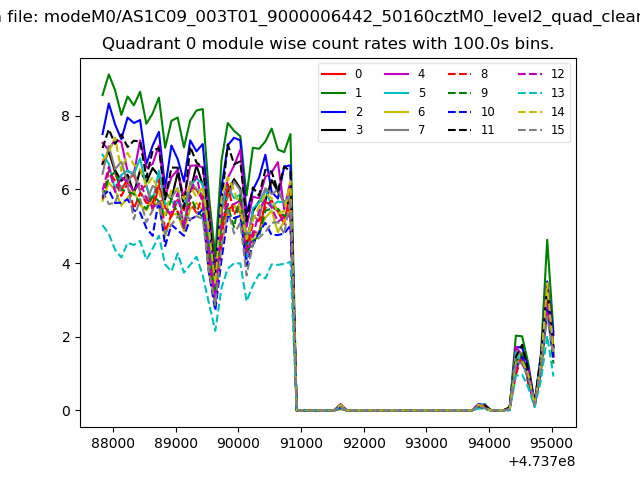
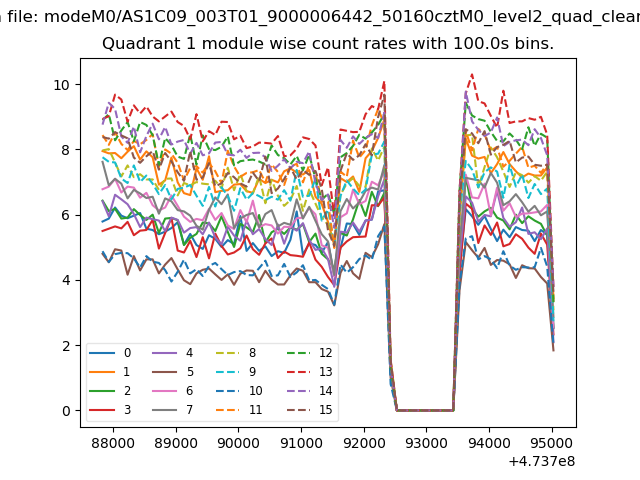
| Module-wise count rates for Quadrant A Data is divided into 100 sec bins |
 |
 |
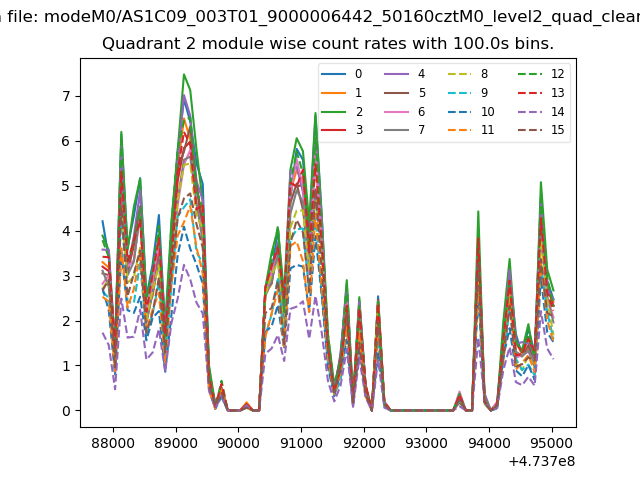
| Module-wise count rates for Quadrant B Data is divided into 100 sec bins |
 |
 |
| Module-wise count rates for Quadrant C Data is divided into 100 sec bins |
 |
 |
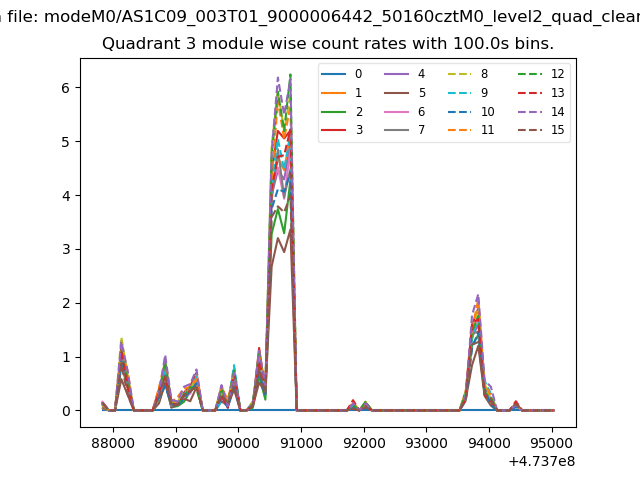
| Module-wise count rates for Quadrant D Data is divided into 100 sec bins |
 |
 |
| Parameter | Plot |
|---|---|
| CZT HV Monitor | 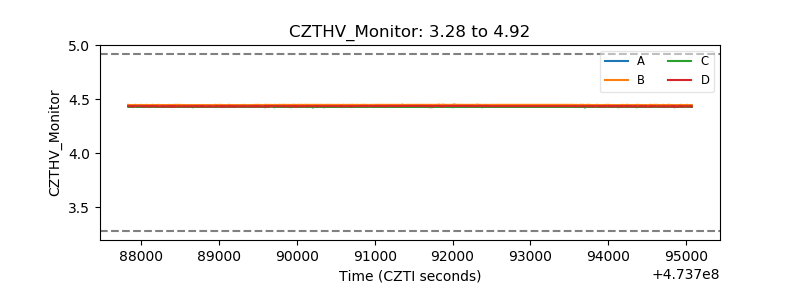 |
| D_VDD | 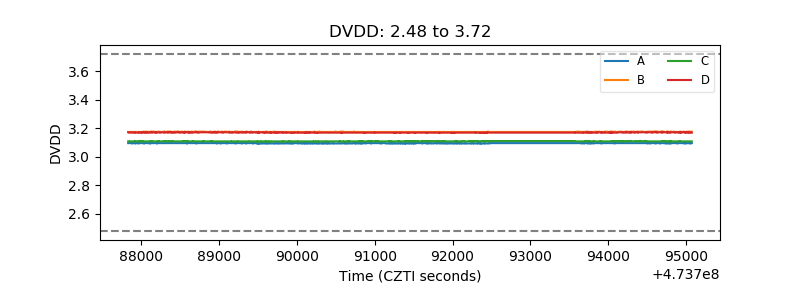 |
| Temperature 1 | 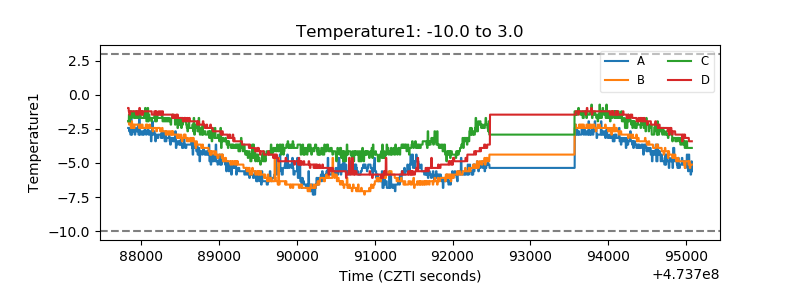 |
| Veto HV Monitor | 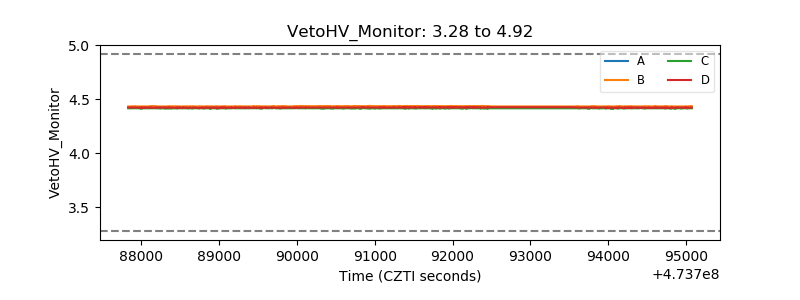 |
| Veto LLD | 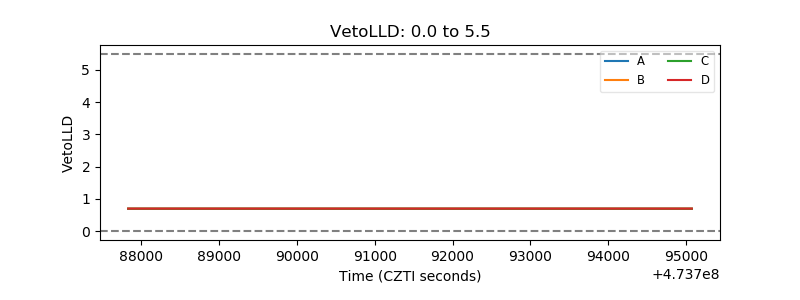 |
| Alpha Counter | 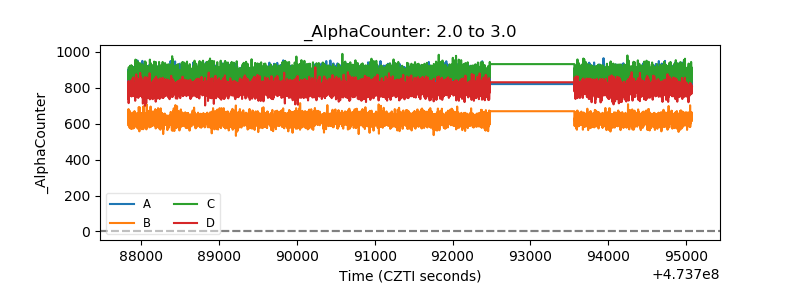 |
| _CPM_Rate | 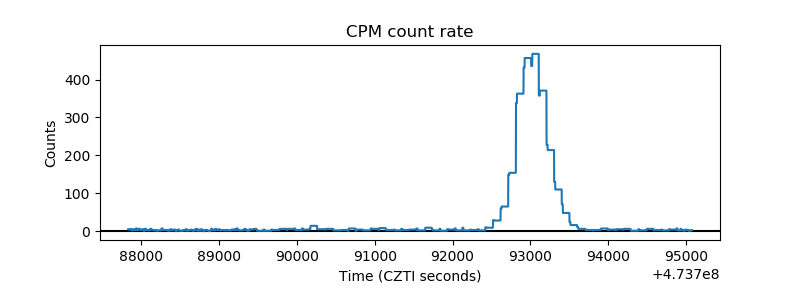 |
| CZT Counter | 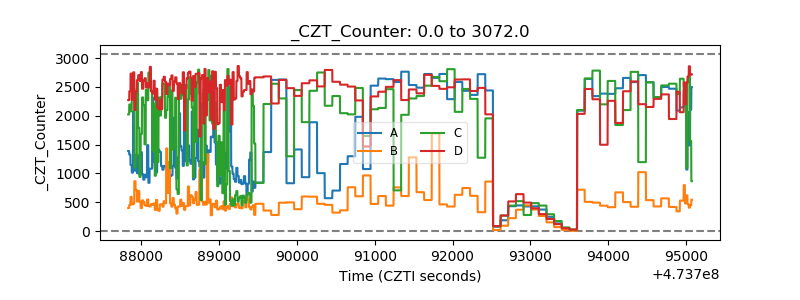 |
| +2.5 Volts monitor |  |
| +5 Volts monitor |  |
| _ROLL_ROT | 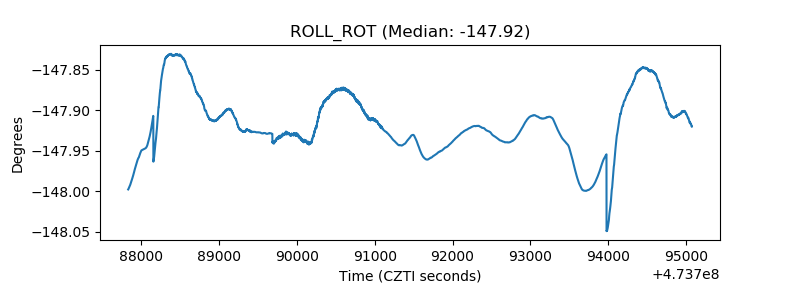 |
| _Roll_DEC | 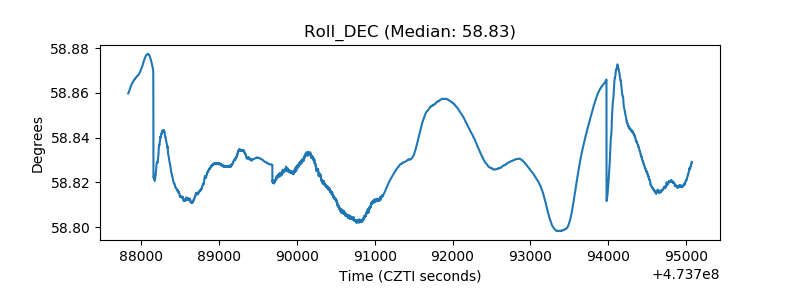 |
| _Roll_RA | 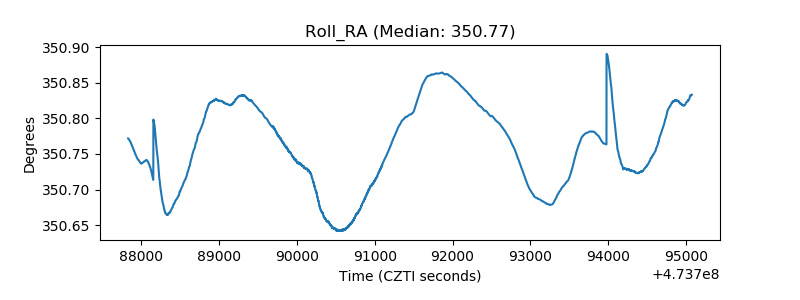 |
| Veto Counter | 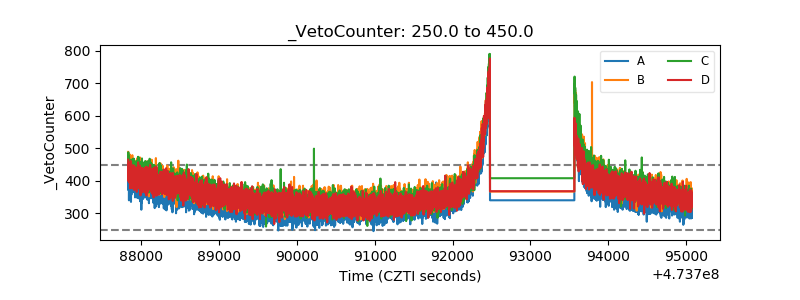 |