| Param | Original file | Final file |
|---|---|---|
| Filename | modeM0/AS1C09_003T01_9000006442_50164cztM0_level2.fits | modeM0/AS1C09_003T01_9000006442_50164cztM0_level2_quad_clean.evt |
| Size (bytes) | 1,460,283,840 | 61,706,880 |
| Size | 1.4 GB | 58.8 MB |
| Events in quadrant A | 16,723,712 | 191,450 |
| Events in quadrant B | 4,574,773 | 724,341 |
| Events in quadrant C | 14,391,669 | 300,732 |
| Events in quadrant D | 17,788,990 | 129,413 |
| Mode M0 | |||
|---|---|---|---|
| Quadrant | BADHDUFLAG | Total packets | Discarded packets |
| A | 0 | 54799 | 0 |
| B | 0 | 18857 | 0 |
| C | 0 | 47896 | 0 |
| D | 0 | 57940 | 0 |
| Mode SS | |||
|---|---|---|---|
| Quadrant | BADHDUFLAG | Total packets | Discarded packets |
| A | 0 | 150 | 0 |
| B | 0 | 150 | 0 |
| C | 0 | 150 | 0 |
| D | 0 | 150 | 0 |
| Quadrant | Total seconds | Saturated seconds | Saturation percentage |
|---|---|---|---|
| A | 7499 | 5734 | 76.463528% |
| B | 7499 | 244 | 3.253767% |
| C | 7499 | 4386 | 58.487798% |
| D | 7498 | 6275 | 83.688984% |
Noise dominated data is calculated using 1-second bins in cleaned event files. If a bin has >2000 counts, and if more than 50% of those come from <1% of pixels, then it is considered to be noise-dominated and hence unusable.
| Quadrant | # 1 sec bins | Bins with >0 counts | Bins with >2000 counts | High rate bins dominated by noise | Noise dominated (total time) | Noise dominated (detector-on time) | Marked lightcurve |
|---|---|---|---|---|---|---|---|
| A | 7498 | 7498 | 5768 | 5768 | 76.93% | 76.93% | 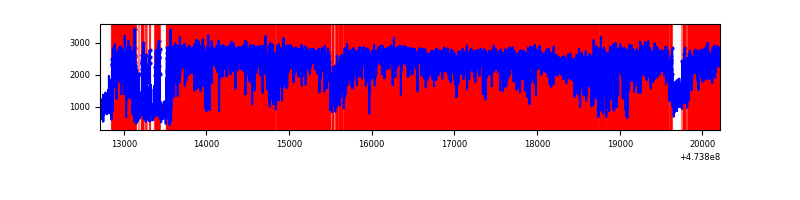 |
| B | 7499 | 7499 | 202 | 202 | 2.69% | 2.69% | 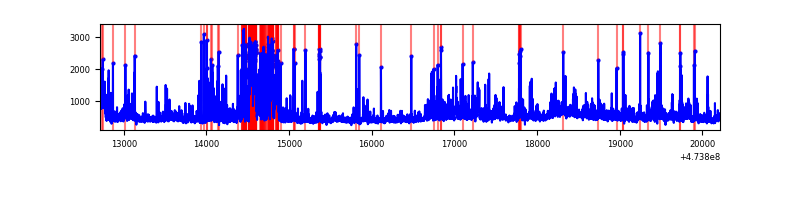 |
| C | 7499 | 7499 | 4195 | 4195 | 55.94% | 55.94% | 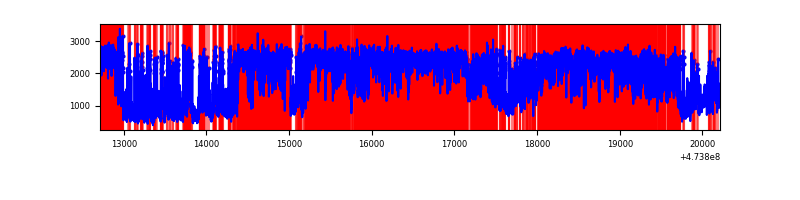 |
| D | 7497 | 7497 | 6344 | 6344 | 84.62% | 84.62% | 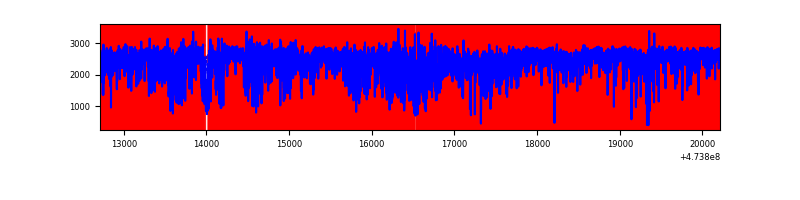 |
Top three noisy pixels from each quadrant. If the there are fewer than three noisy pixels in the level2.evt file, extra rows are filled as -1
| Pixel properties | Quadrant properties | ||||||
|---|---|---|---|---|---|---|---|
| Quadrant | DetID | PixID | Counts | Sigma | Mean | Median | Sigma |
| A | 0 | 98 | 9574073 | 66749.51 | 559 | 543 | 143.4 |
| A | 6 | 250 | 1992172 | 13886.23 | 559 | 543 | 143.4 |
| A | 8 | 8 | 744481 | 5186.95 | 559 | 543 | 143.4 |
| B | 3 | 249 | 474892 | 2948.65 | 755 | 728 | 160.8 |
| B | 5 | 185 | 335369 | 2081.01 | 755 | 728 | 160.8 |
| B | 10 | 247 | 125556 | 776.26 | 755 | 728 | 160.8 |
| C | 1 | 60 | 1734279 | 11925.45 | 523 | 521 | 145.4 |
| C | 15 | 213 | 1468839 | 10099.66 | 523 | 521 | 145.4 |
| C | 15 | 197 | 1306485 | 8982.92 | 523 | 521 | 145.4 |
| D | 15 | 185 | 2041540 | 15909.43 | 435 | 421 | 128.3 |
| D | 15 | 142 | 1806003 | 14073.55 | 435 | 421 | 128.3 |
| D | 15 | 168 | 1533356 | 11948.41 | 435 | 421 | 128.3 |
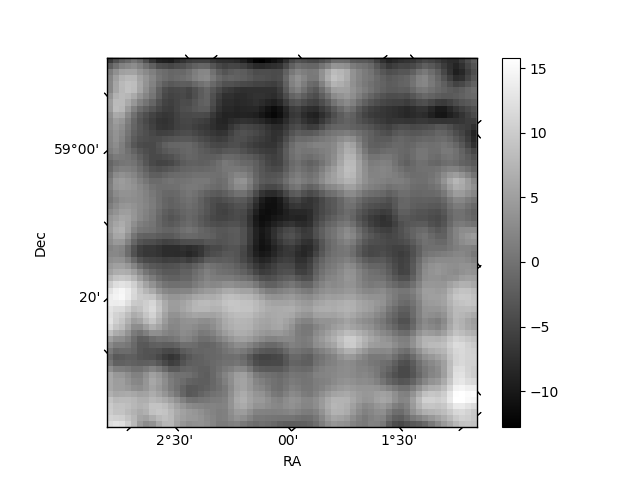
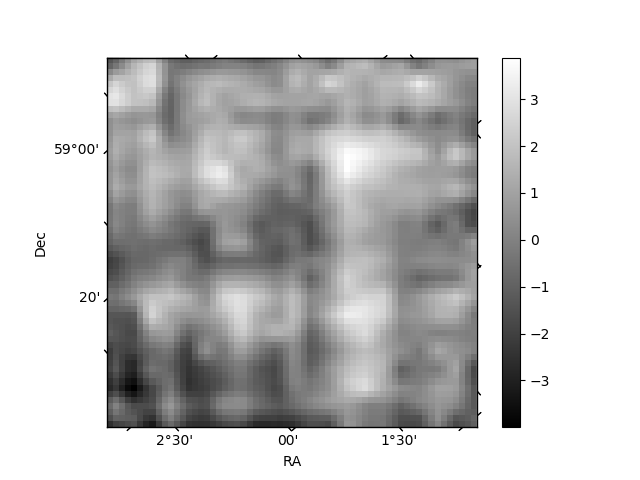
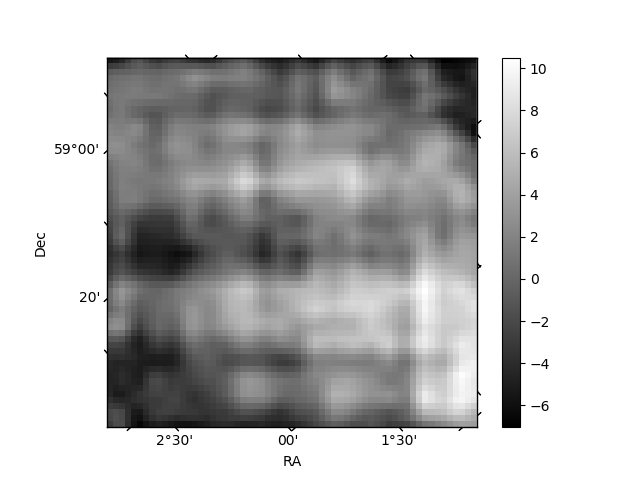
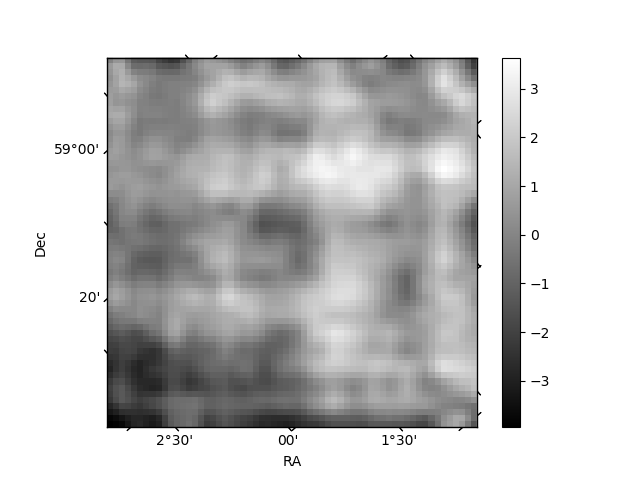
Histogram calculated using DETX and DETY for each event in the final _common_clean file
| Quadrant A | 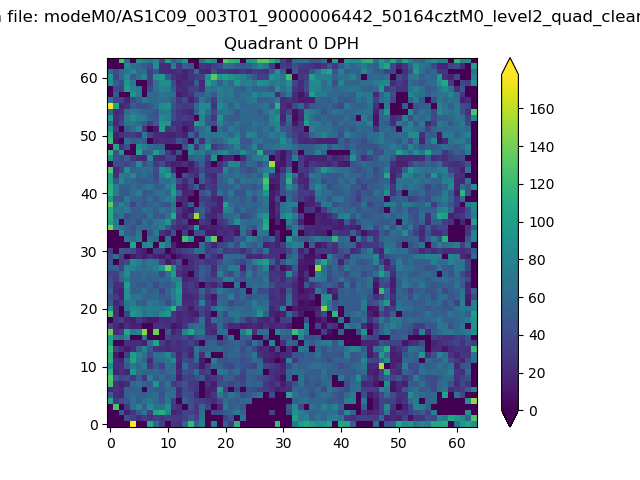 |
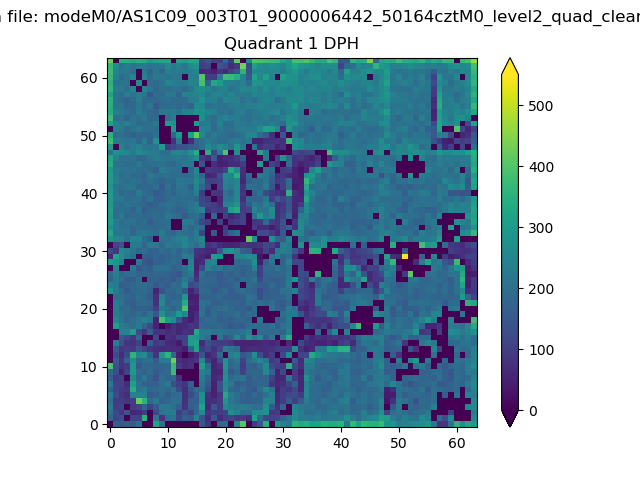 |
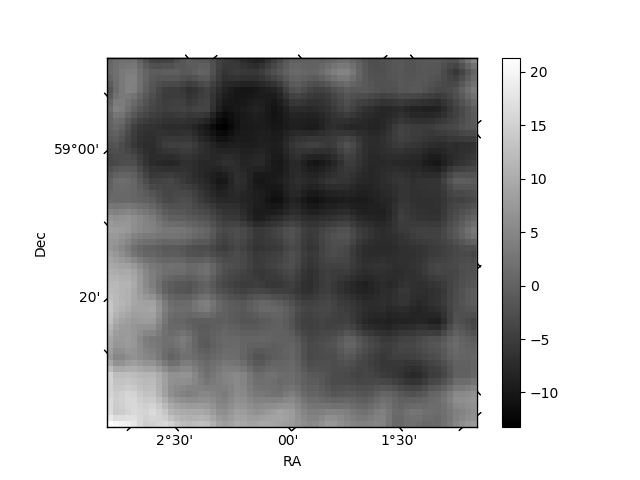
Quadrant B |
|---|---|---|---|
| Quadrant D | 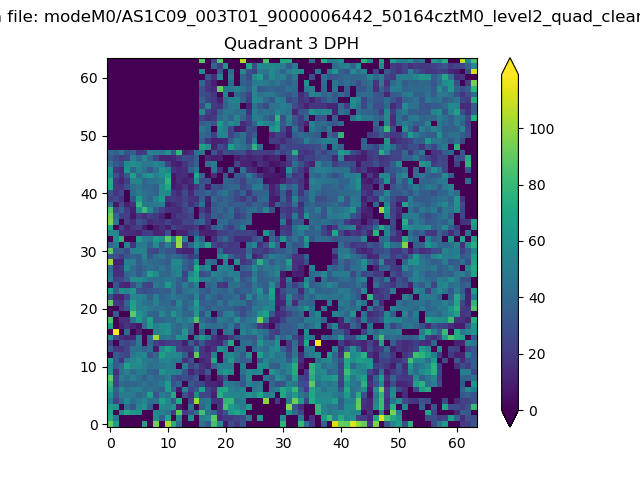 |
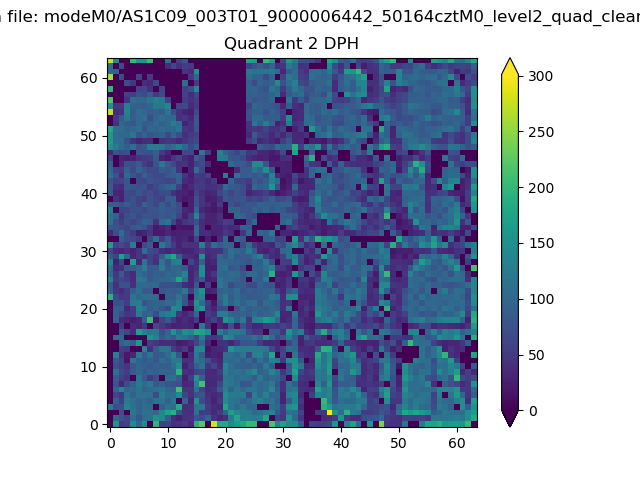 |
Quadrant C |
| Plot type | Count rate plots | Images |
|---|---|---|
| Comparison with Poisson distribution Blue bars denote a histogram of data divided into 1 sec bins. Red curve is a Poisson curve with rate = median count rate of data. |
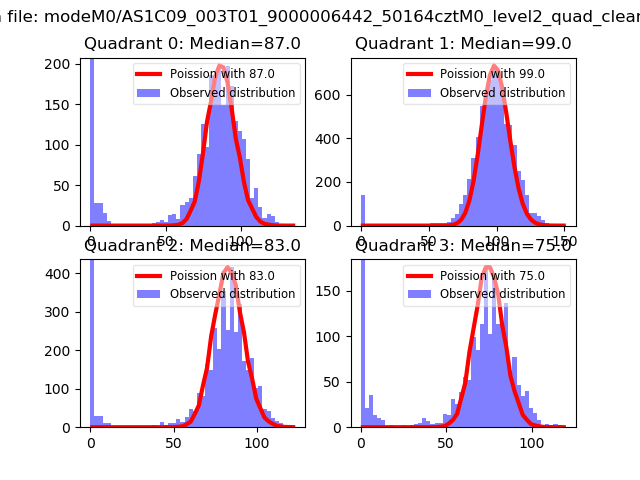 |
 |
| Quadrant-wise count rates Data is divided into 100 sec bins |
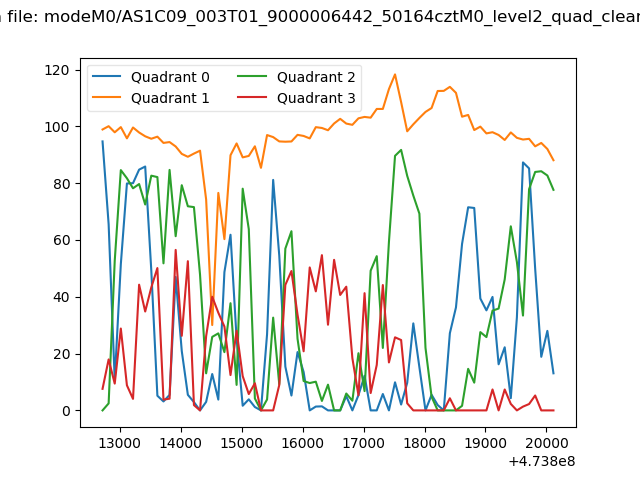 |
|
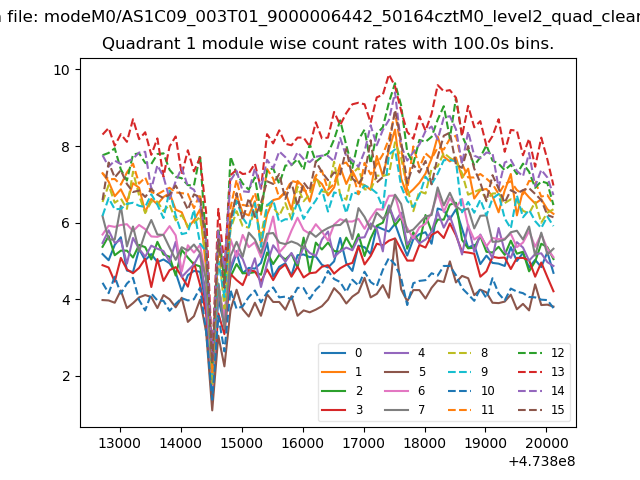
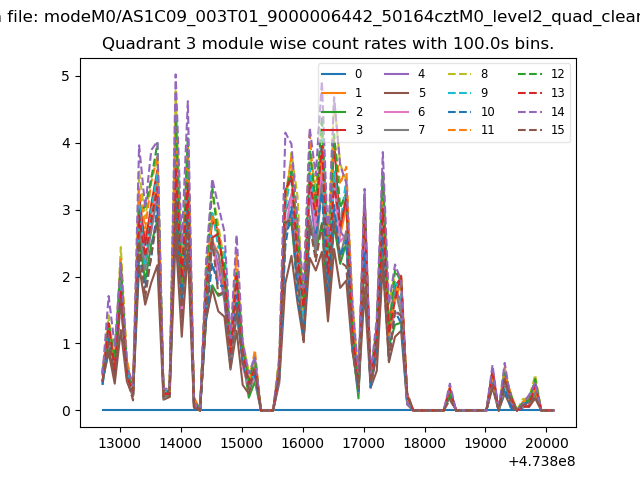
| Module-wise count rates for Quadrant A Data is divided into 100 sec bins |
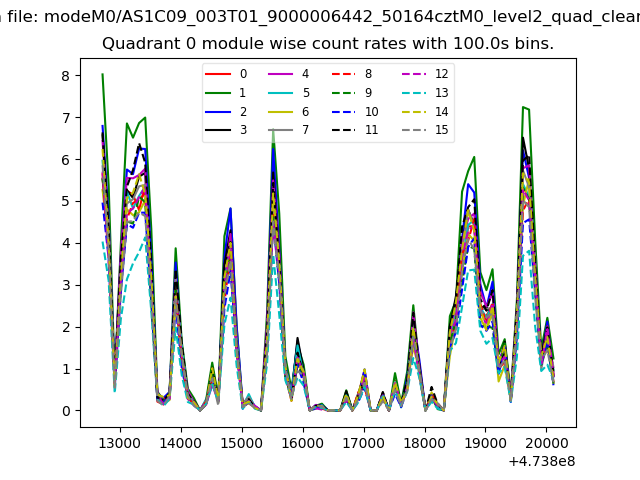 |
 |
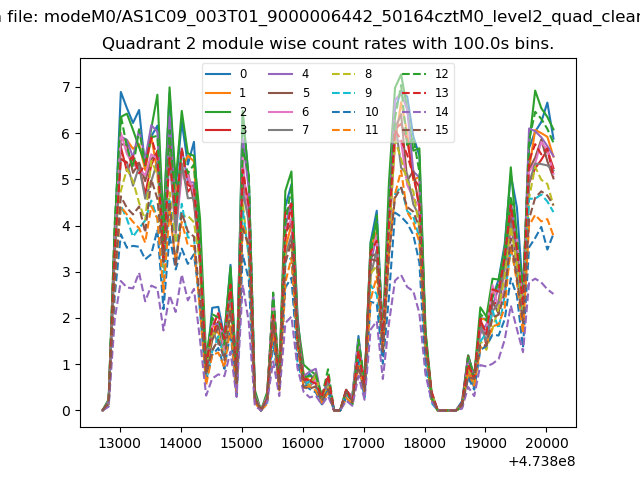
| Module-wise count rates for Quadrant B Data is divided into 100 sec bins |
 |
 |
| Module-wise count rates for Quadrant C Data is divided into 100 sec bins |
 |
 |
| Module-wise count rates for Quadrant D Data is divided into 100 sec bins |
 |
 |
| Parameter | Plot |
|---|---|
| CZT HV Monitor | 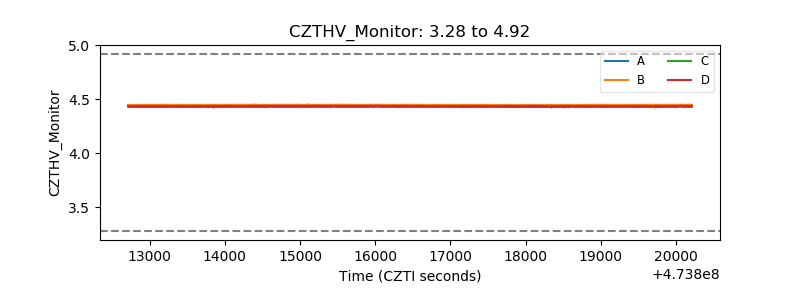 |
| D_VDD | 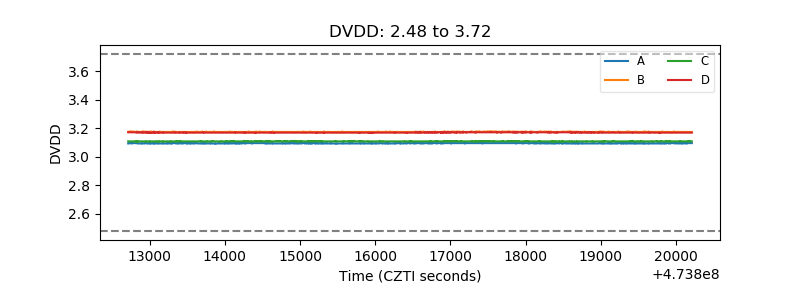 |
| Temperature 1 | 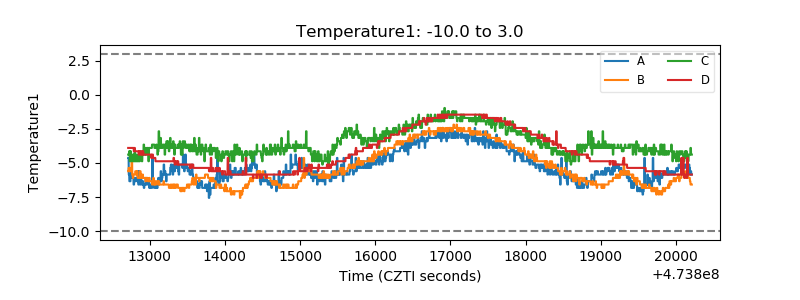 |
| Veto HV Monitor | 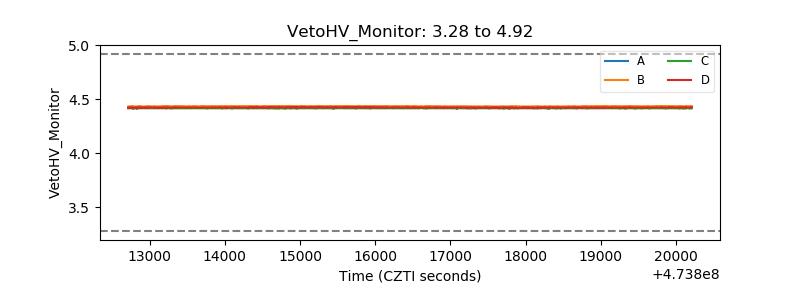 |
| Veto LLD | 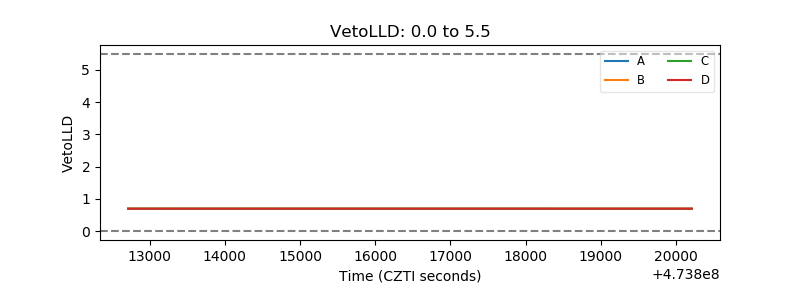 |
| Alpha Counter | 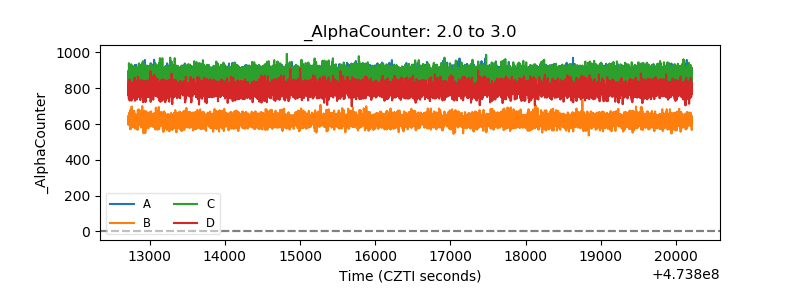 |
| _CPM_Rate | 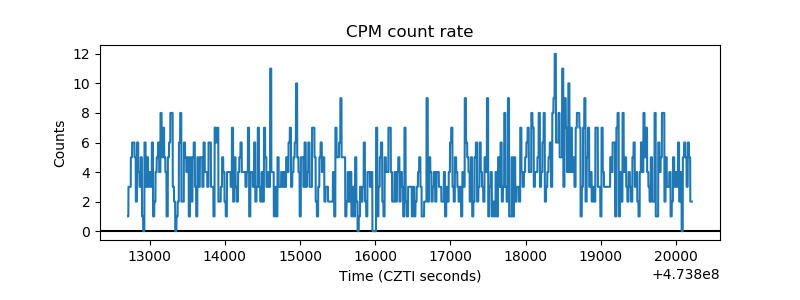 |
| CZT Counter | 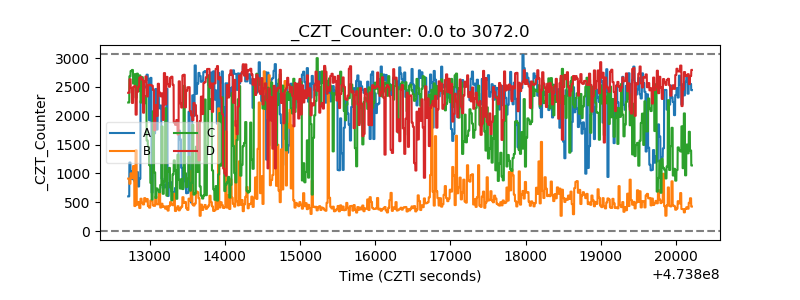 |
| +2.5 Volts monitor |  |
| +5 Volts monitor | 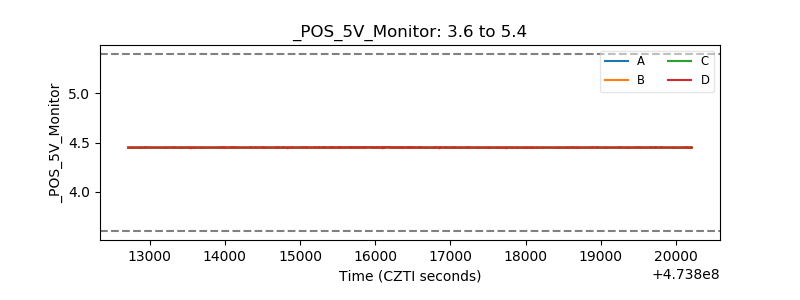 |
| _ROLL_ROT | 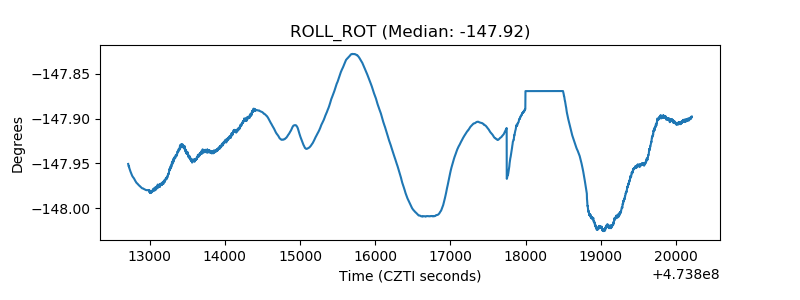 |
| _Roll_DEC | 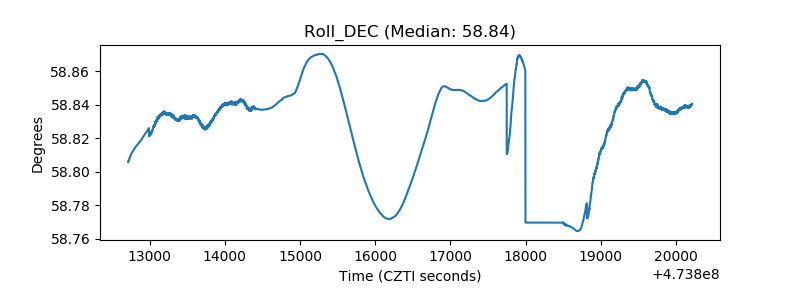 |
| _Roll_RA | 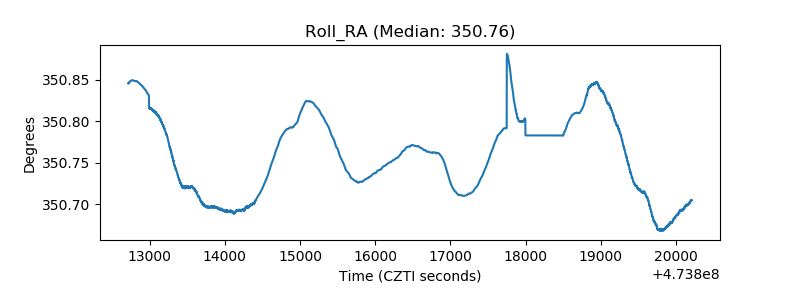 |
| Veto Counter | 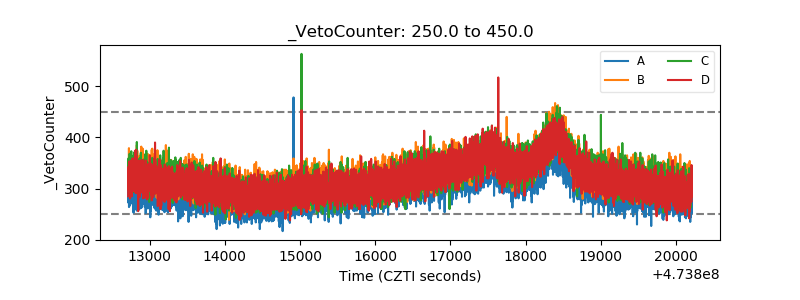 |