| Param | Original file | Final file |
|---|---|---|
| Filename | modeM0/AS1C09_003T01_9000006442_50168cztM0_level2.fits | modeM0/AS1C09_003T01_9000006442_50168cztM0_level2_quad_clean.evt |
| Size (bytes) | 3,448,172,160 | 150,030,720 |
| Size | 3.2 GB | 143.1 MB |
| Events in quadrant A | 31,101,006 | 975,670 |
| Events in quadrant B | 10,378,980 | 1,817,312 |
| Events in quadrant C | 40,186,030 | 179,136 |
| Events in quadrant D | 44,516,799 | 260,230 |
| Mode M9 | |||
|---|---|---|---|
| Quadrant | BADHDUFLAG | Total packets | Discarded packets |
| A | 0 | 10 | 0 |
| B | 0 | 10 | 0 |
| C | 0 | 10 | 0 |
| D | 0 | 10 | 0 |
| Mode M0 | |||
|---|---|---|---|
| Quadrant | BADHDUFLAG | Total packets | Discarded packets |
| A | 0 | 105693 | 2 |
| B | 0 | 44146 | 2 |
| C | 0 | 132312 | 2 |
| D | 0 | 145243 | 2 |
| Mode SS | |||
|---|---|---|---|
| Quadrant | BADHDUFLAG | Total packets | Discarded packets |
| A | 0 | 386 | 0 |
| B | 0 | 386 | 0 |
| C | 0 | 386 | 0 |
| D | 0 | 386 | 0 |
| Quadrant | Total seconds | Saturated seconds | Saturation percentage |
|---|---|---|---|
| A | 18984 | 8311 | 43.778972% |
| B | 18984 | 532 | 2.802360% |
| C | 18984 | 17170 | 90.444585% |
| D | 18984 | 16288 | 85.798567% |
Noise dominated data is calculated using 1-second bins in cleaned event files. If a bin has >2000 counts, and if more than 50% of those come from <1% of pixels, then it is considered to be noise-dominated and hence unusable.
| Quadrant | # 1 sec bins | Bins with >0 counts | Bins with >2000 counts | High rate bins dominated by noise | Noise dominated (total time) | Noise dominated (detector-on time) | Marked lightcurve |
|---|---|---|---|---|---|---|---|
| A | 20099 | 18984 | 7965 | 7965 | 39.63% | 41.96% | 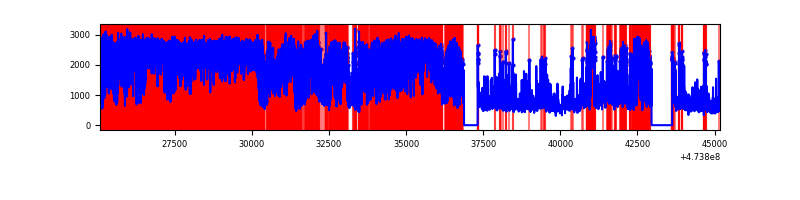 |
| B | 20099 | 18984 | 156 | 156 | 0.78% | 0.82% | 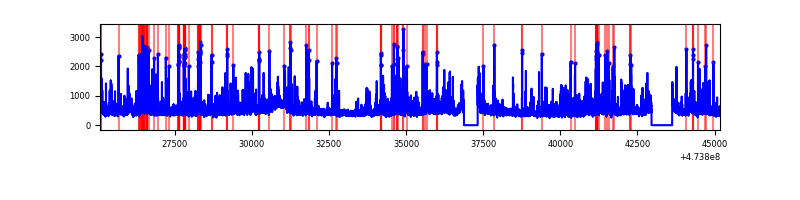 |
| C | 20099 | 18984 | 12898 | 12898 | 64.17% | 67.94% | 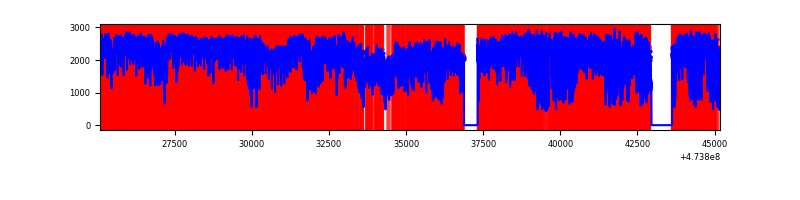 |
| D | 20099 | 18984 | 15766 | 15766 | 78.44% | 83.05% | 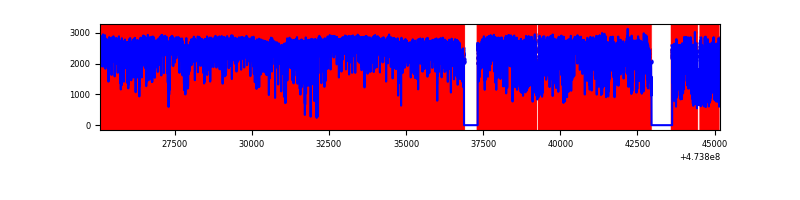 |
Top three noisy pixels from each quadrant. If the there are fewer than three noisy pixels in the level2.evt file, extra rows are filled as -1
| Pixel properties | Quadrant properties | ||||||
|---|---|---|---|---|---|---|---|
| Quadrant | DetID | PixID | Counts | Sigma | Mean | Median | Sigma |
| A | 0 | 98 | 16507788 | 38594.28 | 1702 | 1658 | 427.7 |
| A | 8 | 8 | 2368198 | 5533.39 | 1702 | 1658 | 427.7 |
| A | 6 | 250 | 779388 | 1818.47 | 1702 | 1658 | 427.7 |
| B | 5 | 185 | 310940 | 748.42 | 1961 | 1894 | 412.9 |
| B | 9 | 218 | 254135 | 610.85 | 1961 | 1894 | 412.9 |
| B | 3 | 249 | 234265 | 562.73 | 1961 | 1894 | 412.9 |
| C | 4 | 111 | 11442393 | 67648.22 | 584 | 579 | 169.1 |
| C | 15 | 197 | 6703007 | 39627.22 | 584 | 579 | 169.1 |
| C | 15 | 164 | 2466818 | 14581.31 | 584 | 579 | 169.1 |
| D | 15 | 142 | 7640747 | 26057.69 | 854 | 813 | 293.2 |
| D | 15 | 168 | 7004679 | 23888.24 | 854 | 813 | 293.2 |
| D | 7 | 61 | 5147550 | 17554.09 | 854 | 813 | 293.2 |
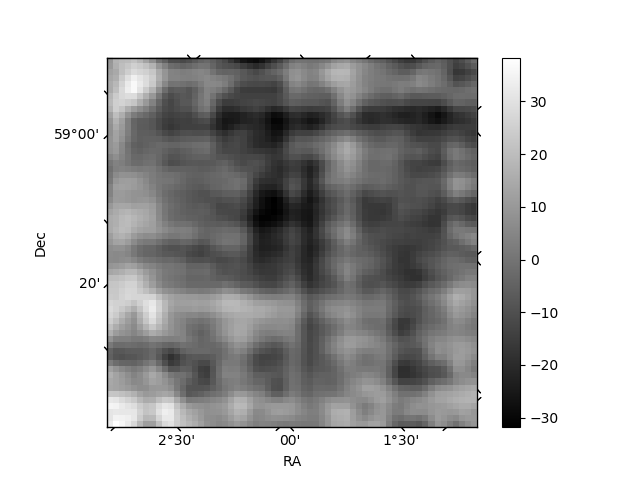
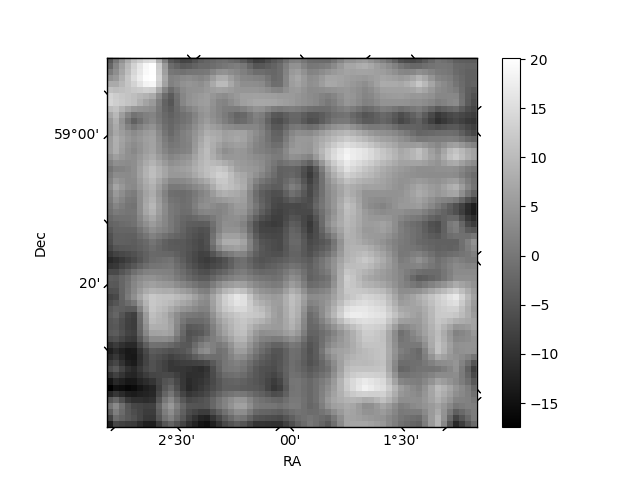
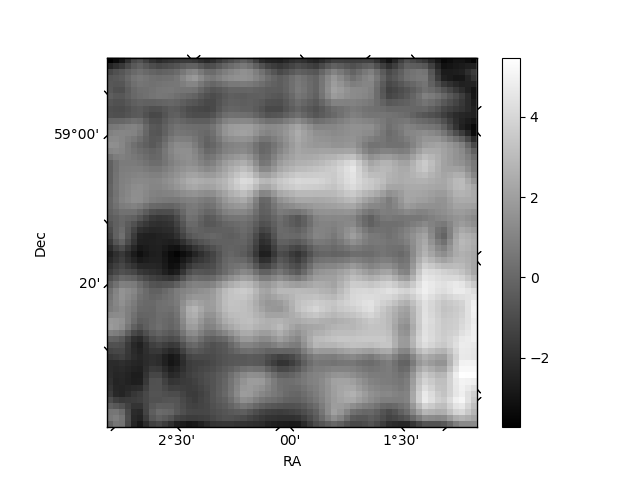
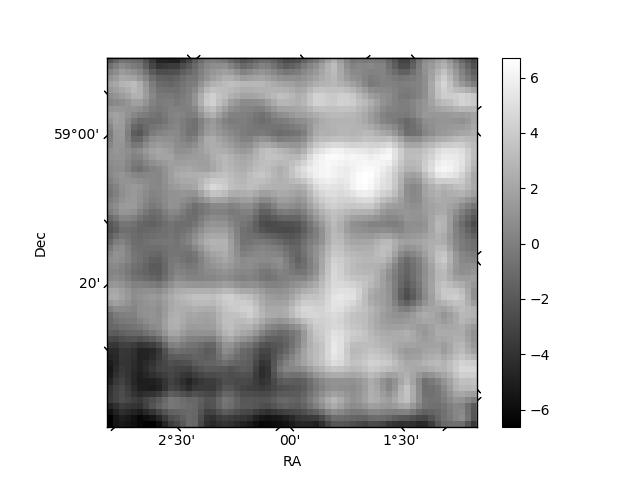
Histogram calculated using DETX and DETY for each event in the final _common_clean file
| Quadrant A | 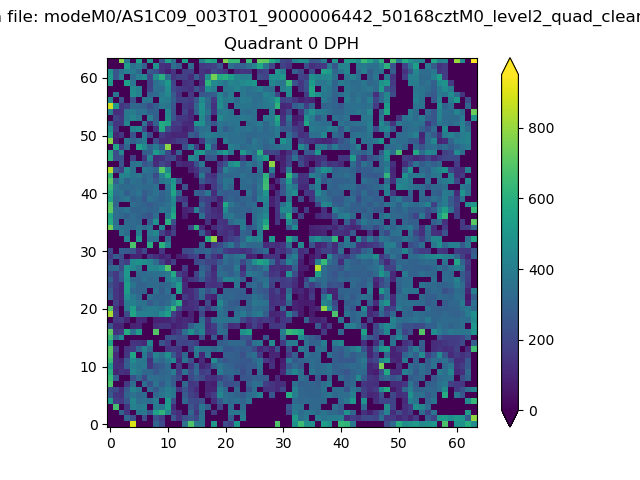 |
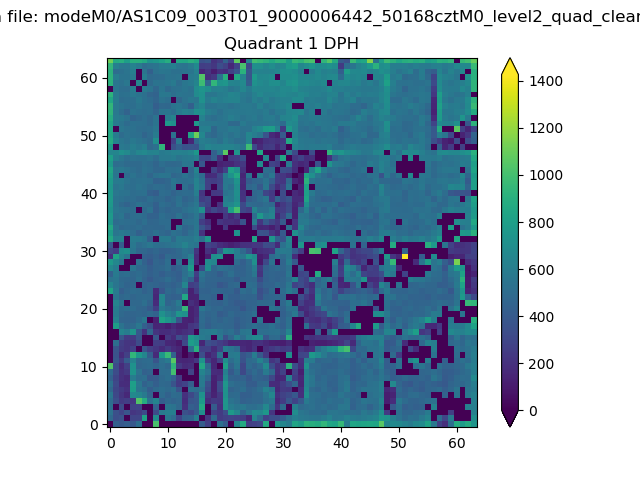 |
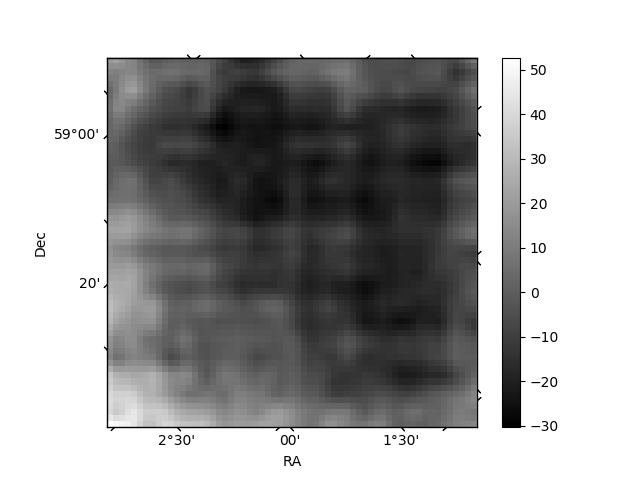
Quadrant B |
|---|---|---|---|
| Quadrant D | 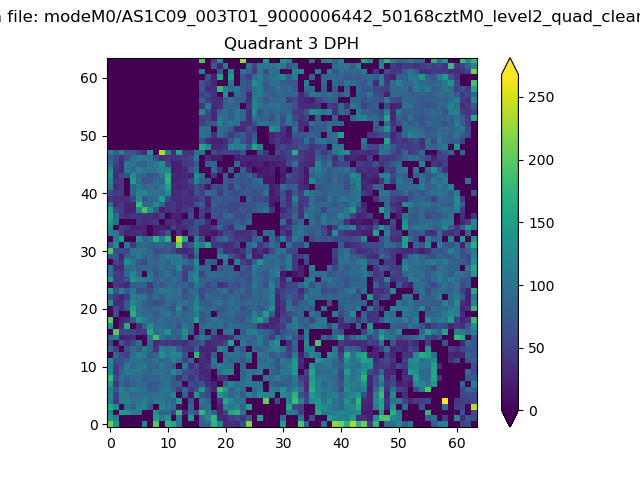 |
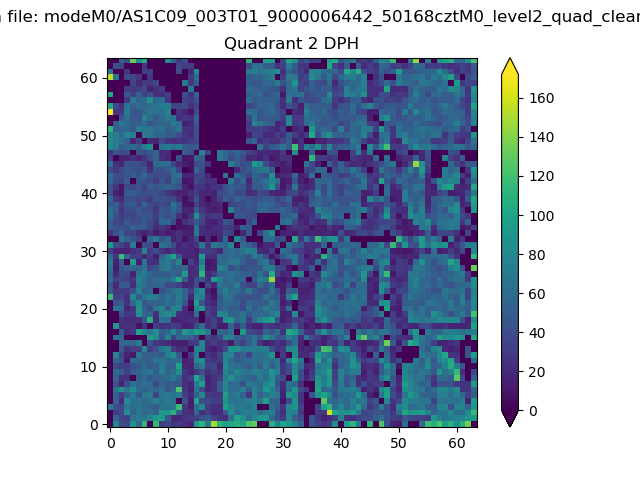 |
Quadrant C |
| Plot type | Count rate plots | Images |
|---|---|---|
| Comparison with Poisson distribution Blue bars denote a histogram of data divided into 1 sec bins. Red curve is a Poisson curve with rate = median count rate of data. |
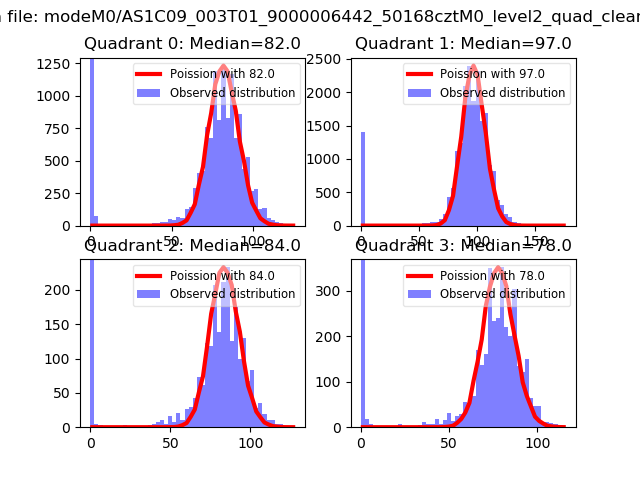 |
 |
| Quadrant-wise count rates Data is divided into 100 sec bins |
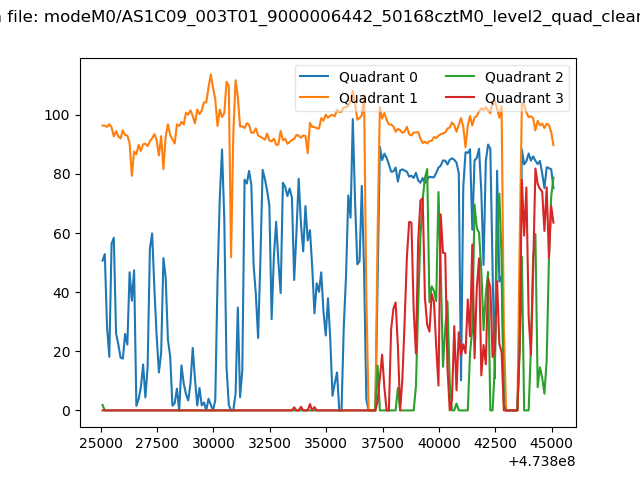 |
|
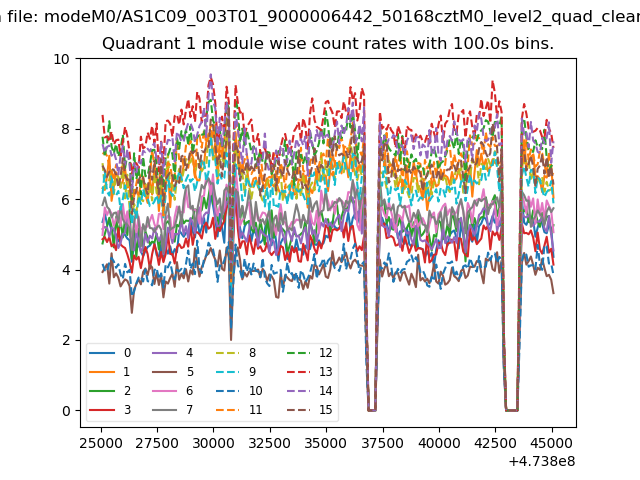
| Module-wise count rates for Quadrant A Data is divided into 100 sec bins |
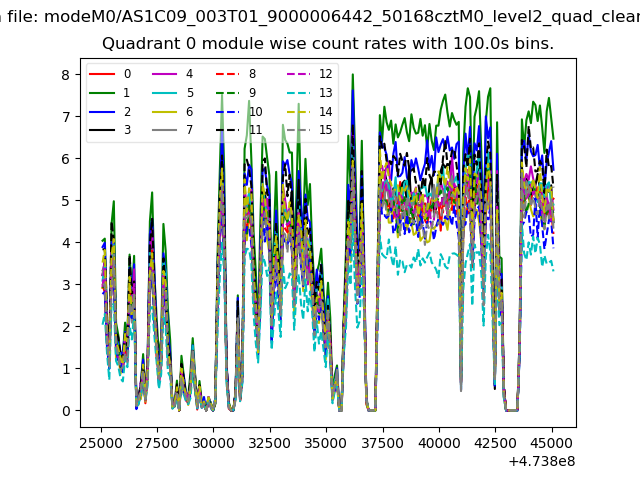 |
 |
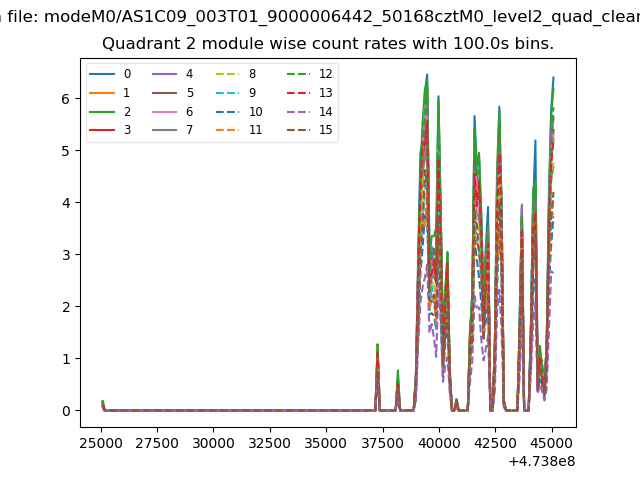
| Module-wise count rates for Quadrant B Data is divided into 100 sec bins |
 |
 |
| Module-wise count rates for Quadrant C Data is divided into 100 sec bins |
 |
 |
| Module-wise count rates for Quadrant D Data is divided into 100 sec bins |
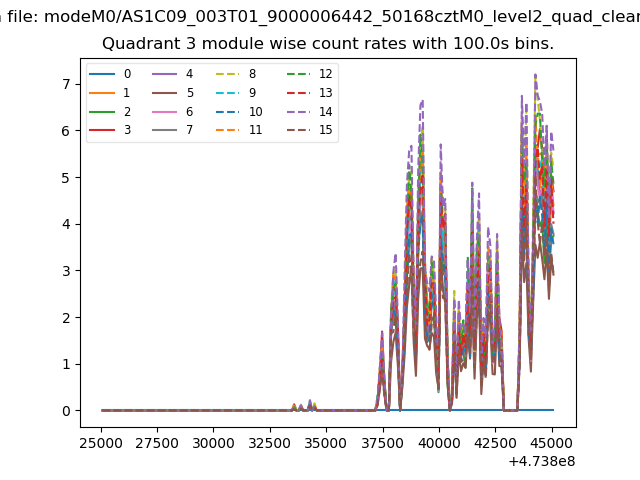 |
 |
| Parameter | Plot |
|---|---|
| CZT HV Monitor | 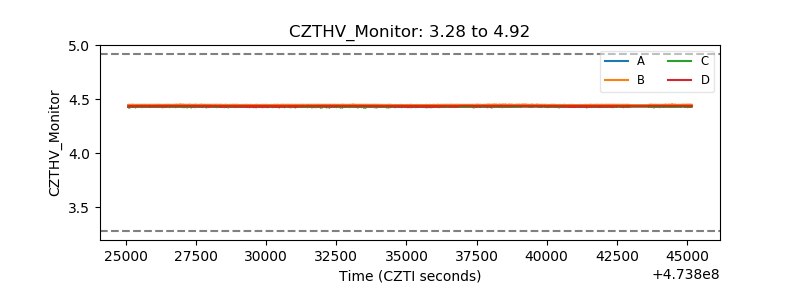 |
| D_VDD | 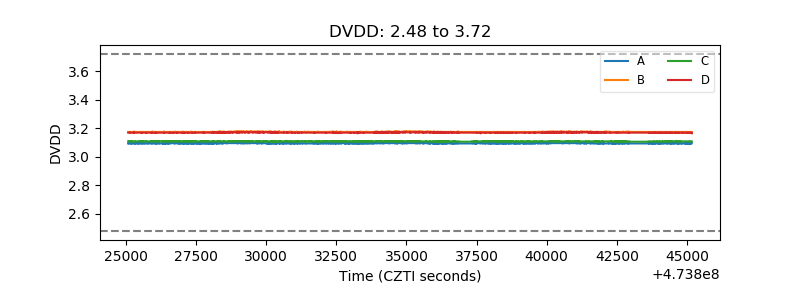 |
| Temperature 1 | 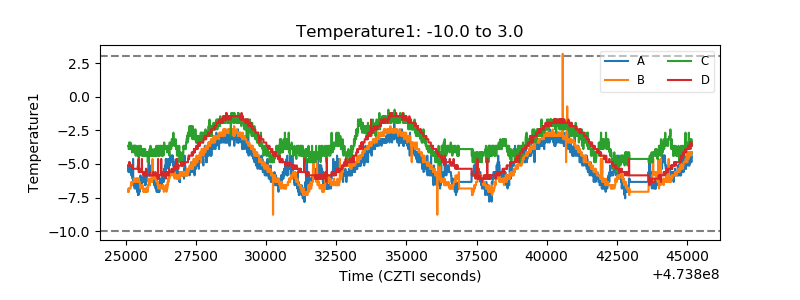 |
| Veto HV Monitor | 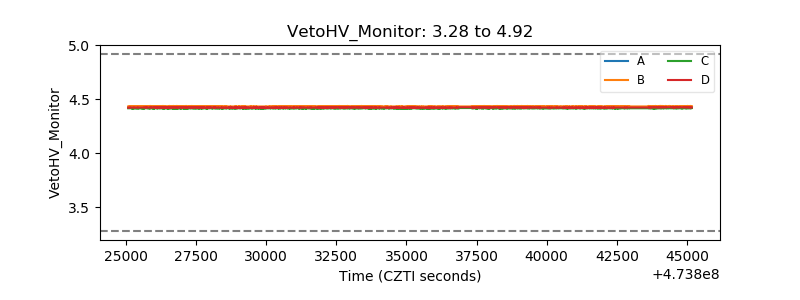 |
| Veto LLD | 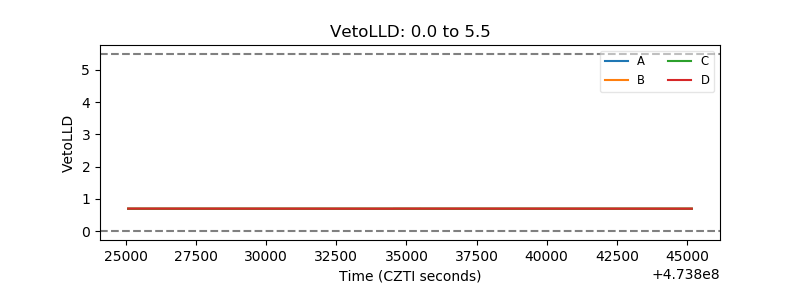 |
| Alpha Counter | 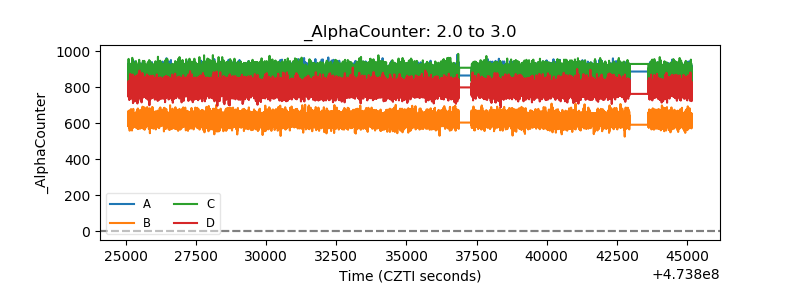 |
| _CPM_Rate | 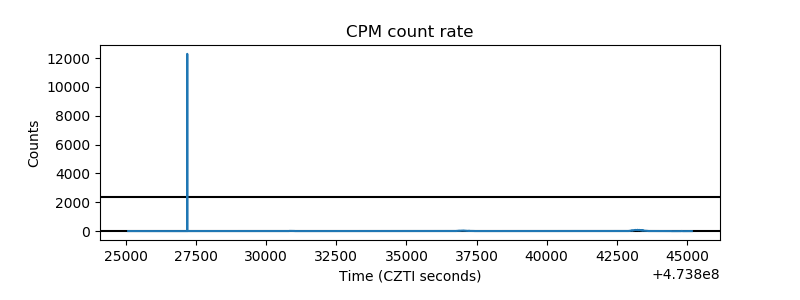 |
| CZT Counter | 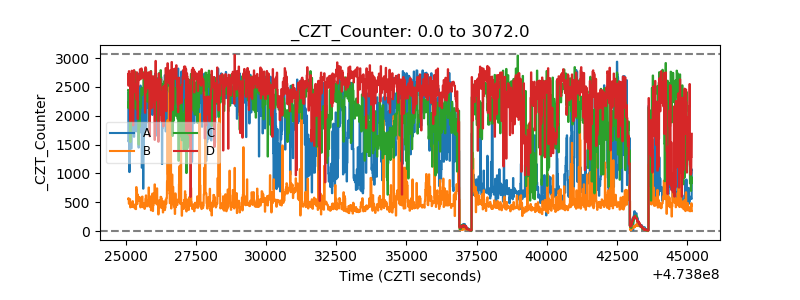 |
| +2.5 Volts monitor |  |
| +5 Volts monitor | 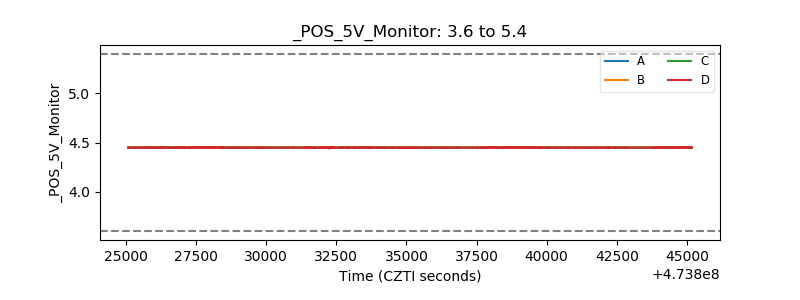 |
| _ROLL_ROT | 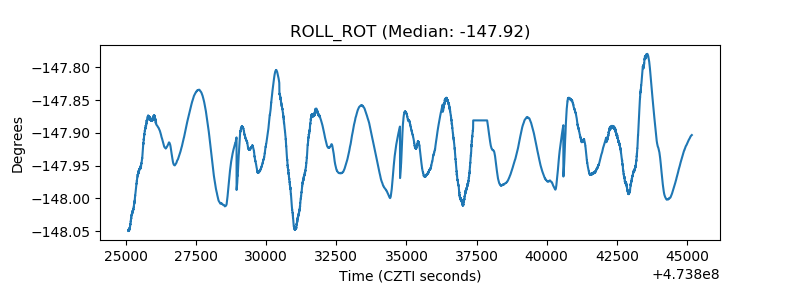 |
| _Roll_DEC | 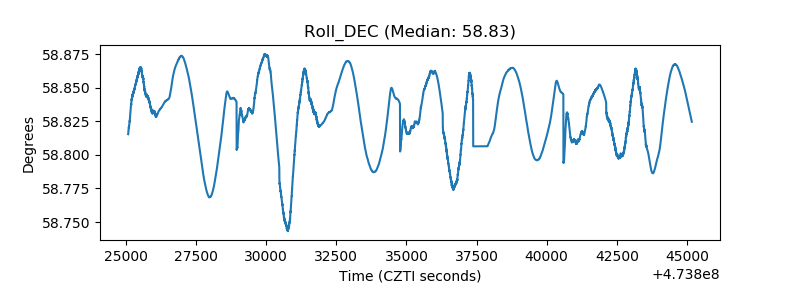 |
| _Roll_RA | 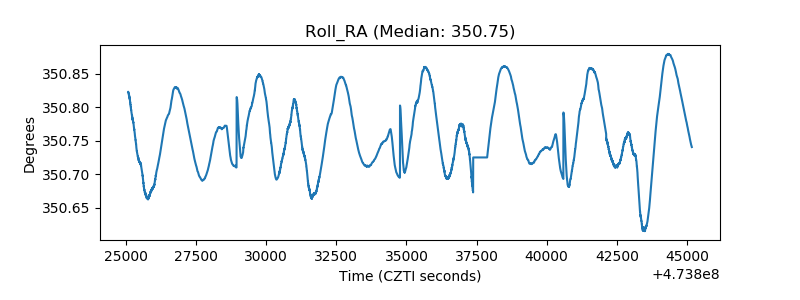 |
| Veto Counter | 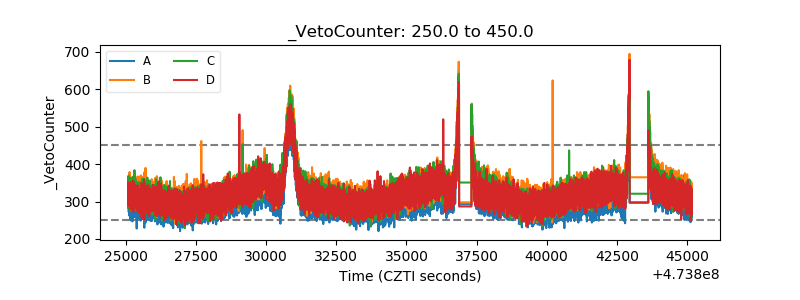 |