| Param | Original file | Final file |
|---|---|---|
| Filename | modeM0/AS1C09_003T01_9000006442_50171cztM0_level2.fits | modeM0/AS1C09_003T01_9000006442_50171cztM0_level2_quad_clean.evt |
| Size (bytes) | 907,922,880 | 64,247,040 |
| Size | 865.9 MB | 61.3 MB |
| Events in quadrant A | 5,467,328 | 516,567 |
| Events in quadrant B | 3,106,583 | 604,800 |
| Events in quadrant C | 12,586,161 | 153,375 |
| Events in quadrant D | 11,990,889 | 256,370 |
| Mode M9 | |||
|---|---|---|---|
| Quadrant | BADHDUFLAG | Total packets | Discarded packets |
| A | 0 | 10 | 0 |
| B | 0 | 10 | 0 |
| C | 0 | 10 | 0 |
| D | 0 | 10 | 0 |
| Mode M0 | |||
|---|---|---|---|
| Quadrant | BADHDUFLAG | Total packets | Discarded packets |
| A | 0 | 20377 | 1 |
| B | 0 | 13519 | 1 |
| C | 0 | 41447 | 8 |
| D | 0 | 39733 | 1 |
| Mode SS | |||
|---|---|---|---|
| Quadrant | BADHDUFLAG | Total packets | Discarded packets |
| A | 0 | 122 | 0 |
| B | 0 | 122 | 0 |
| C | 0 | 122 | 0 |
| D | 0 | 122 | 0 |
| Quadrant | Total seconds | Saturated seconds | Saturation percentage |
|---|---|---|---|
| A | 5920 | 612 | 10.337838% |
| B | 5921 | 91 | 1.536903% |
| C | 5920 | 4476 | 75.608108% |
| D | 5920 | 3250 | 54.898649% |
Noise dominated data is calculated using 1-second bins in cleaned event files. If a bin has >2000 counts, and if more than 50% of those come from <1% of pixels, then it is considered to be noise-dominated and hence unusable.
| Quadrant | # 1 sec bins | Bins with >0 counts | Bins with >2000 counts | High rate bins dominated by noise | Noise dominated (total time) | Noise dominated (detector-on time) | Marked lightcurve |
|---|---|---|---|---|---|---|---|
| A | 6924 | 5919 | 536 | 536 | 7.74% | 9.06% | 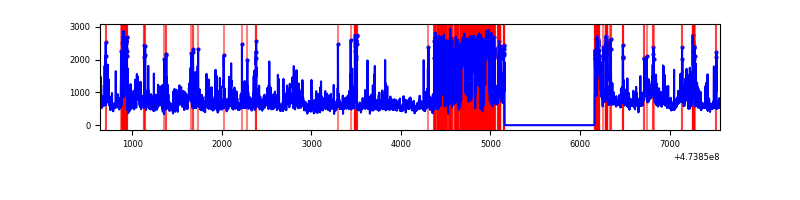 |
| B | 6925 | 5920 | 53 | 53 | 0.77% | 0.90% | 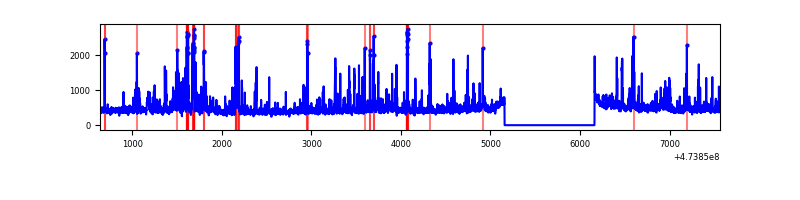 |
| C | 6924 | 5919 | 4173 | 4173 | 60.27% | 70.50% | 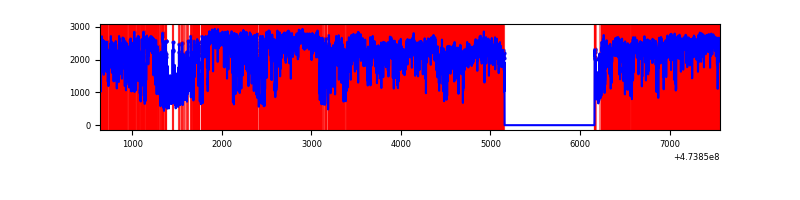 |
| D | 6924 | 5919 | 3474 | 3474 | 50.17% | 58.69% | 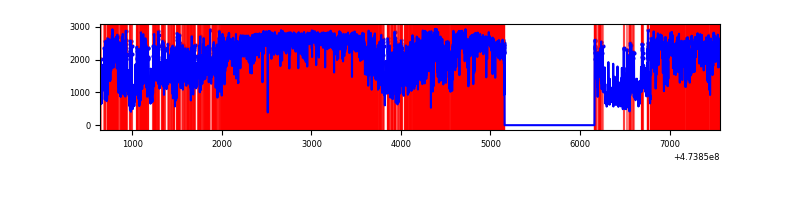 |
Top three noisy pixels from each quadrant. If the there are fewer than three noisy pixels in the level2.evt file, extra rows are filled as -1
| Pixel properties | Quadrant properties | ||||||
|---|---|---|---|---|---|---|---|
| Quadrant | DetID | PixID | Counts | Sigma | Mean | Median | Sigma |
| A | 0 | 98 | 896193 | 6003.14 | 594 | 581 | 149.2 |
| A | 10 | 253 | 665709 | 4458.25 | 594 | 581 | 149.2 |
| A | 8 | 8 | 541383 | 3624.91 | 594 | 581 | 149.2 |
| B | 10 | 247 | 118177 | 897.95 | 609 | 588 | 131.0 |
| B | 4 | 216 | 114777 | 871.99 | 609 | 588 | 131.0 |
| B | 0 | 155 | 96490 | 732.34 | 609 | 588 | 131.0 |
| C | 15 | 213 | 2470818 | 24487.21 | 354 | 353 | 100.9 |
| C | 4 | 111 | 1808945 | 17926.73 | 354 | 353 | 100.9 |
| C | 15 | 232 | 1689264 | 16740.46 | 354 | 353 | 100.9 |
| D | 15 | 185 | 3285411 | 24938.91 | 456 | 440 | 131.7 |
| D | 12 | 6 | 904778 | 6865.57 | 456 | 440 | 131.7 |
| D | 8 | 192 | 734270 | 5571.11 | 456 | 440 | 131.7 |
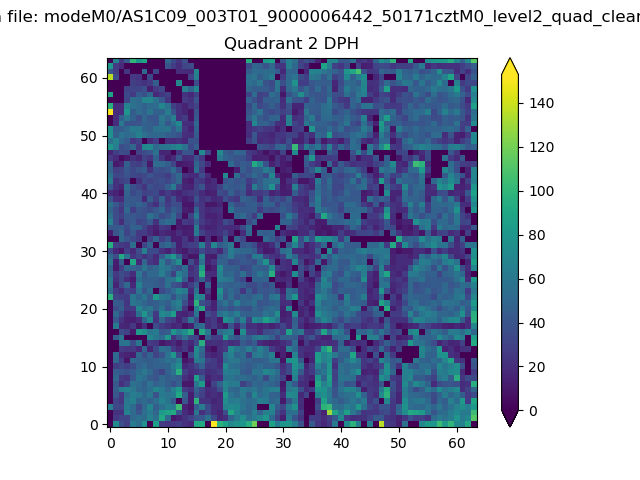
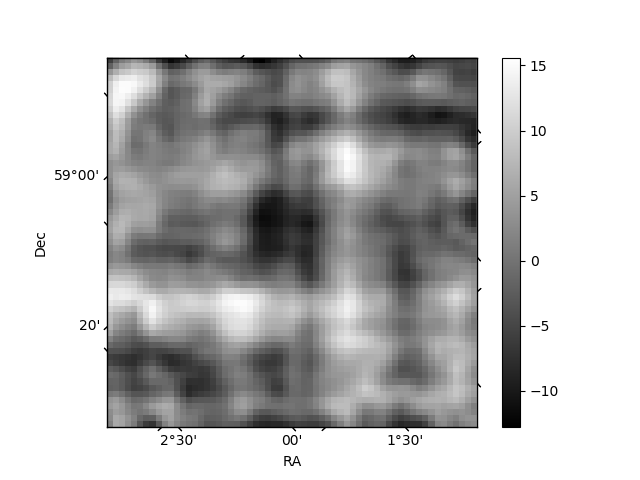
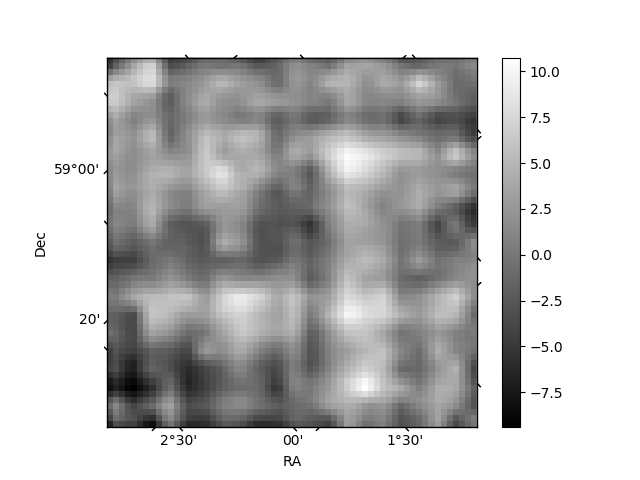
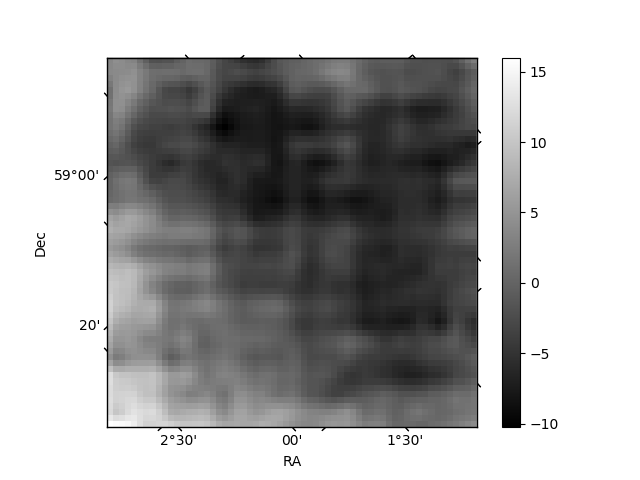
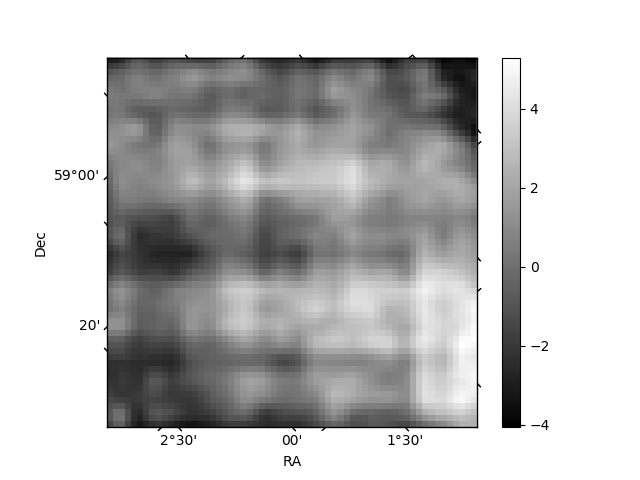
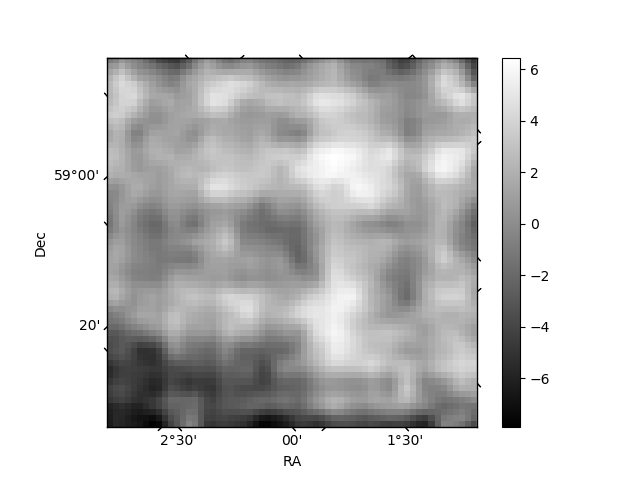
Histogram calculated using DETX and DETY for each event in the final _common_clean file
| Quadrant A | 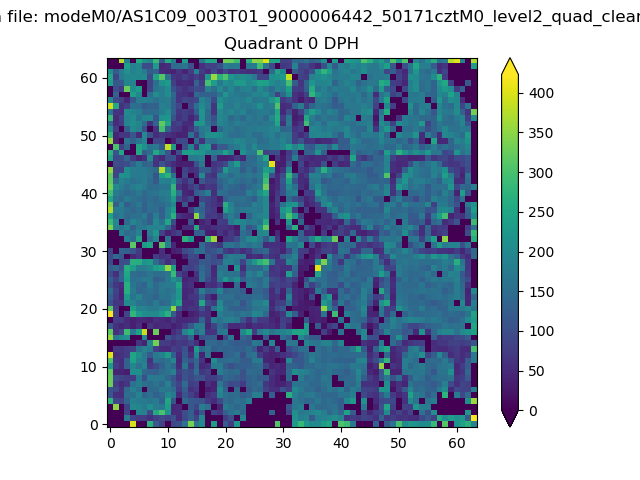 |
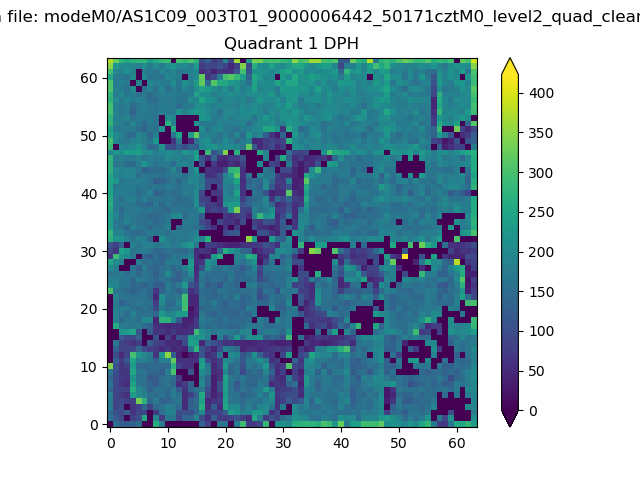 |
Quadrant B |
|---|---|---|---|
| Quadrant D | 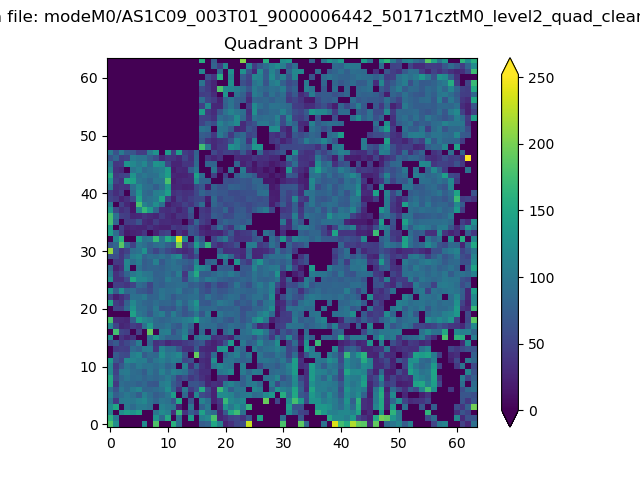 |
 |
Quadrant C |
| Plot type | Count rate plots | Images |
|---|---|---|
| Comparison with Poisson distribution Blue bars denote a histogram of data divided into 1 sec bins. Red curve is a Poisson curve with rate = median count rate of data. |
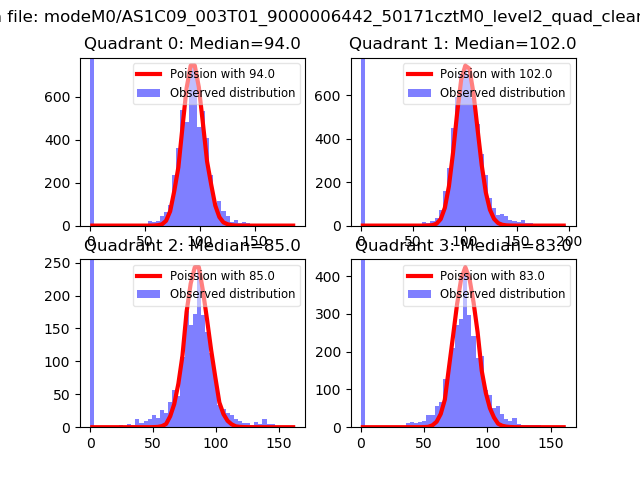 |
 |
| Quadrant-wise count rates Data is divided into 100 sec bins |
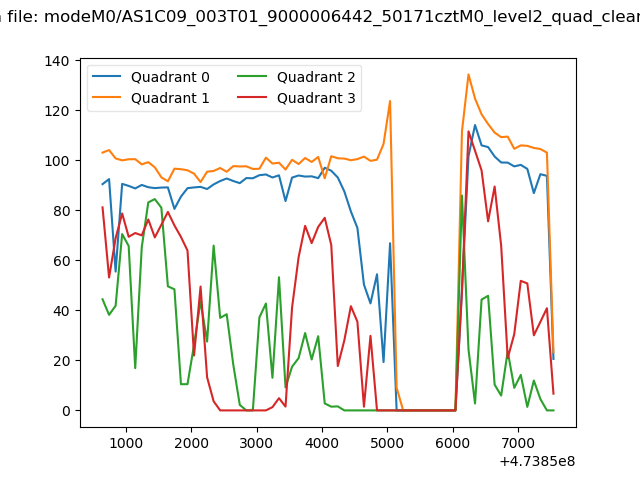 |
|
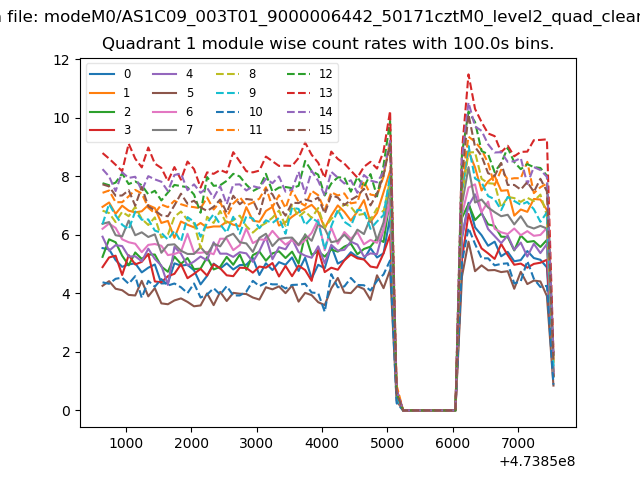
| Module-wise count rates for Quadrant A Data is divided into 100 sec bins |
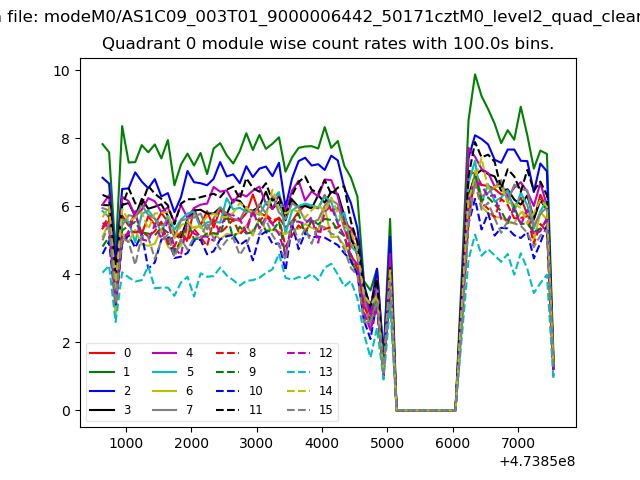 |
 |
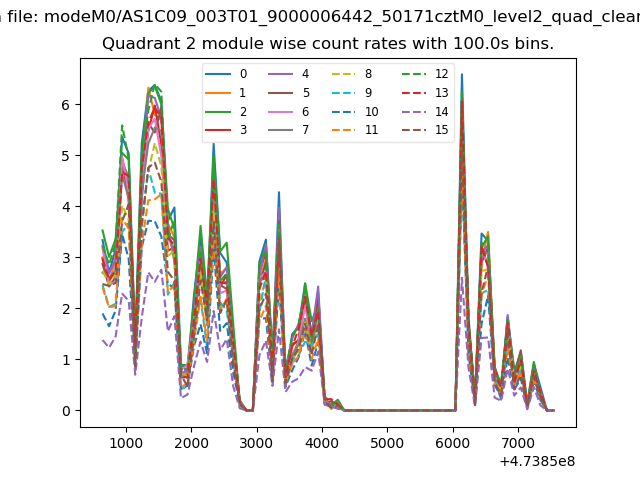
| Module-wise count rates for Quadrant B Data is divided into 100 sec bins |
 |
 |
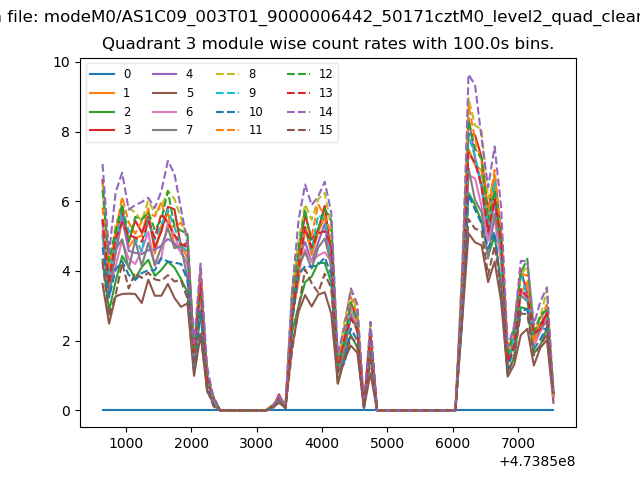
| Module-wise count rates for Quadrant C Data is divided into 100 sec bins |
 |
 |
| Module-wise count rates for Quadrant D Data is divided into 100 sec bins |
 |
 |
| Parameter | Plot |
|---|---|
| CZT HV Monitor | 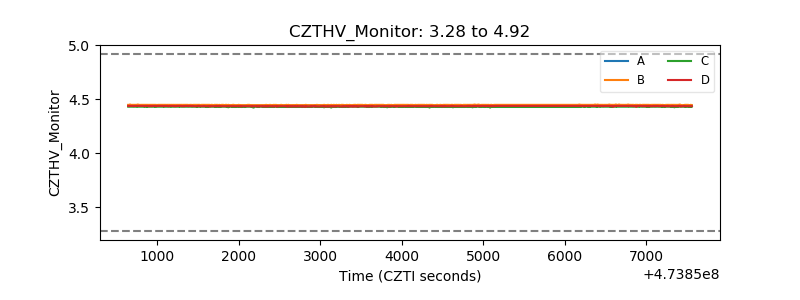 |
| D_VDD | 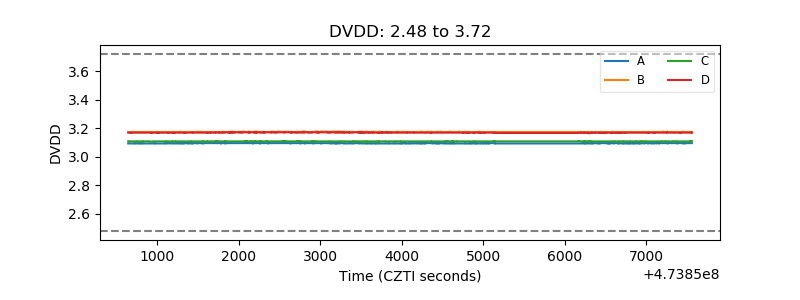 |
| Temperature 1 |  |
| Veto HV Monitor | 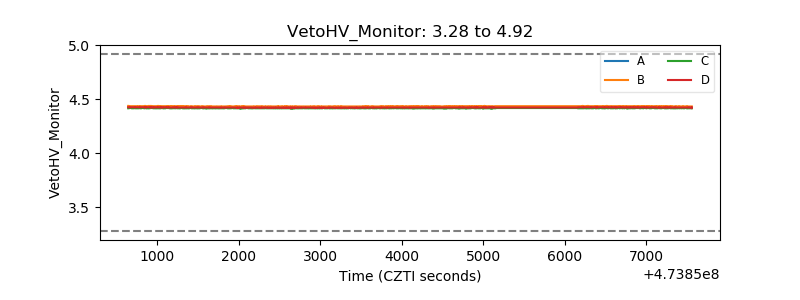 |
| Veto LLD | 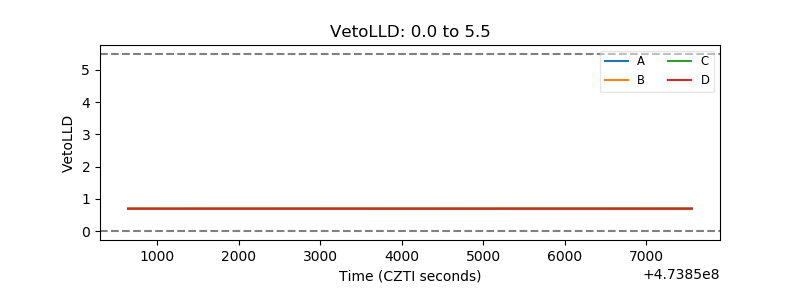 |
| Alpha Counter | 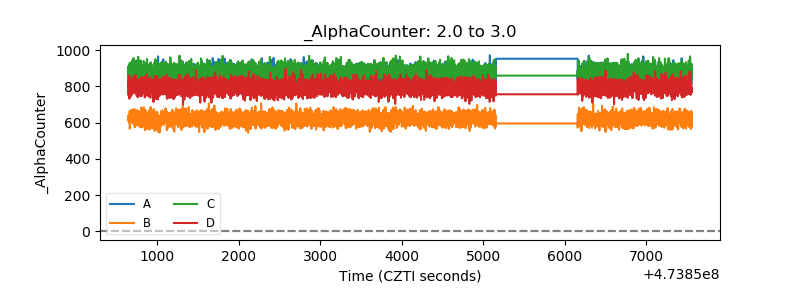 |
| _CPM_Rate | 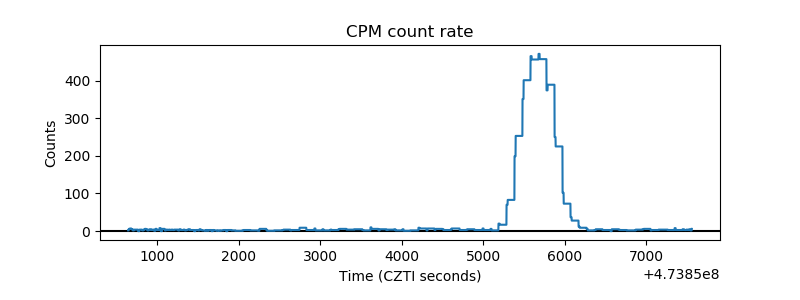 |
| CZT Counter | 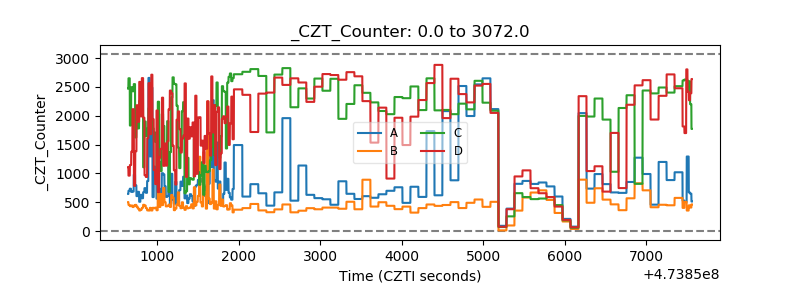 |
| +2.5 Volts monitor | 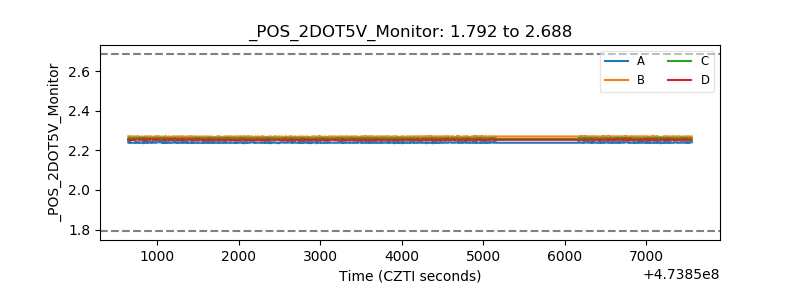 |
| +5 Volts monitor |  |
| _ROLL_ROT | 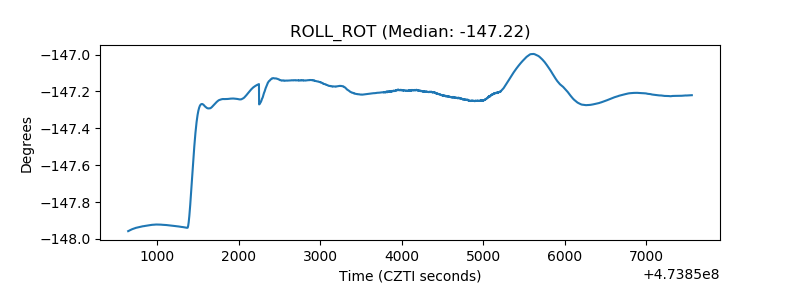 |
| _Roll_DEC | 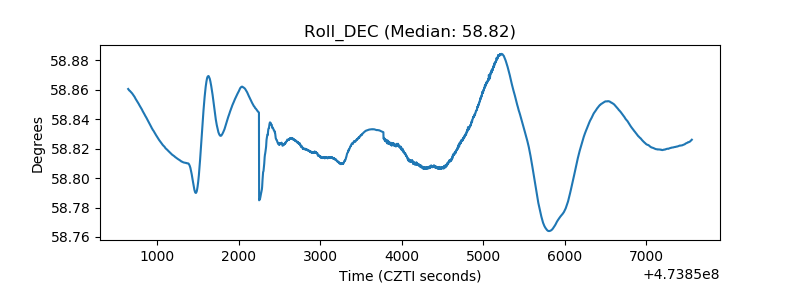 |
| _Roll_RA | 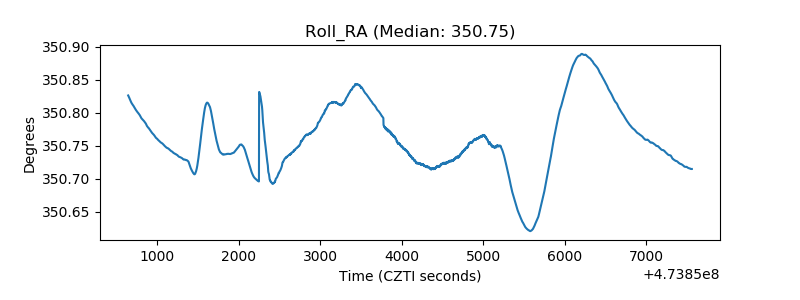 |
| Veto Counter | 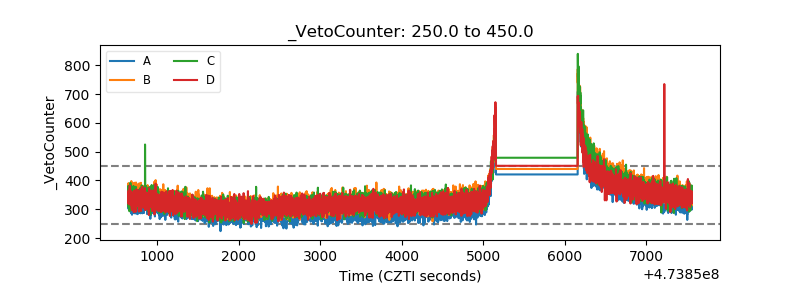 |