| Param | Original file | Final file |
|---|---|---|
| Filename | modeM0/AS1C09_003T01_9000006442_50174cztM0_level2.fits | modeM0/AS1C09_003T01_9000006442_50174cztM0_level2_quad_clean.evt |
| Size (bytes) | 1,032,174,720 | 66,683,520 |
| Size | 984.4 MB | 63.6 MB |
| Events in quadrant A | 6,415,484 | 579,826 |
| Events in quadrant B | 3,588,199 | 668,610 |
| Events in quadrant C | 14,010,050 | 133,682 |
| Events in quadrant D | 13,711,706 | 200,125 |
| Mode M9 | |||
|---|---|---|---|
| Quadrant | BADHDUFLAG | Total packets | Discarded packets |
| A | 0 | 11 | 0 |
| B | 0 | 11 | 0 |
| C | 0 | 11 | 0 |
| D | 0 | 11 | 0 |
| Mode M0 | |||
|---|---|---|---|
| Quadrant | BADHDUFLAG | Total packets | Discarded packets |
| A | 0 | 23667 | 1 |
| B | 0 | 15006 | 1 |
| C | 0 | 45873 | 1 |
| D | 0 | 45004 | 8 |
| Mode SS | |||
|---|---|---|---|
| Quadrant | BADHDUFLAG | Total packets | Discarded packets |
| A | 0 | 128 | 0 |
| B | 0 | 128 | 0 |
| C | 0 | 128 | 0 |
| D | 0 | 128 | 0 |
| Quadrant | Total seconds | Saturated seconds | Saturation percentage |
|---|---|---|---|
| A | 6252 | 575 | 9.197057% |
| B | 6252 | 108 | 1.727447% |
| C | 6252 | 5045 | 80.694178% |
| D | 6251 | 4416 | 70.644697% |
Noise dominated data is calculated using 1-second bins in cleaned event files. If a bin has >2000 counts, and if more than 50% of those come from <1% of pixels, then it is considered to be noise-dominated and hence unusable.
| Quadrant | # 1 sec bins | Bins with >0 counts | Bins with >2000 counts | High rate bins dominated by noise | Noise dominated (total time) | Noise dominated (detector-on time) | Marked lightcurve |
|---|---|---|---|---|---|---|---|
| A | 7402 | 6253 | 445 | 445 | 6.01% | 7.12% | 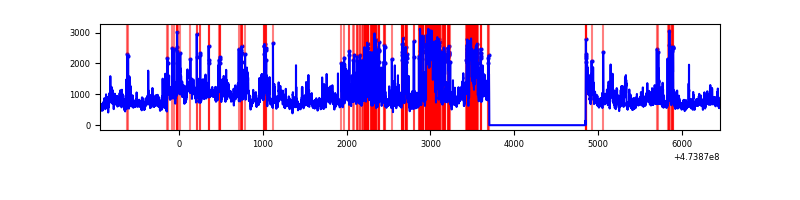 |
| B | 7402 | 6252 | 50 | 50 | 0.68% | 0.80% | 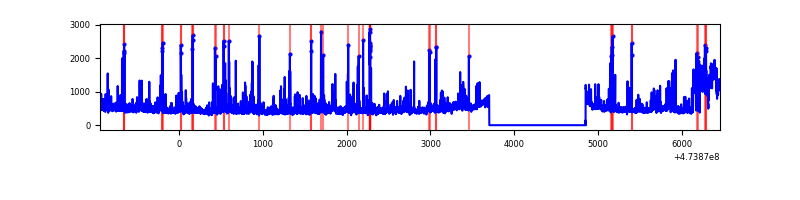 |
| C | 7402 | 6253 | 4920 | 4920 | 66.47% | 78.68% | 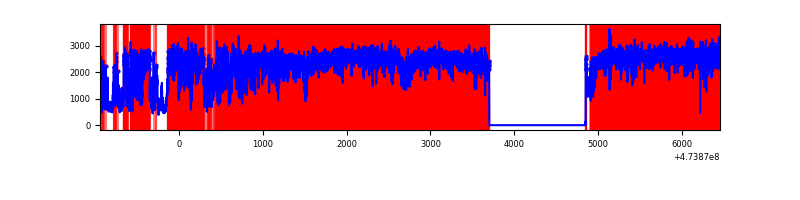 |
| D | 7401 | 6252 | 4503 | 4503 | 60.84% | 72.02% | 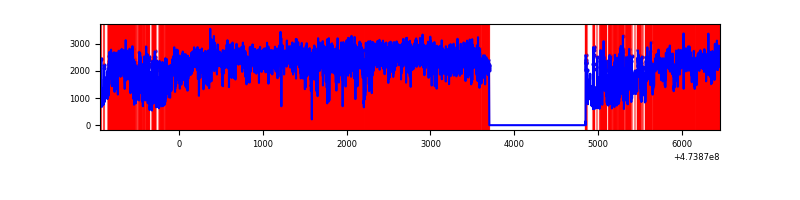 |
Top three noisy pixels from each quadrant. If the there are fewer than three noisy pixels in the level2.evt file, extra rows are filled as -1
| Pixel properties | Quadrant properties | ||||||
|---|---|---|---|---|---|---|---|
| Quadrant | DetID | PixID | Counts | Sigma | Mean | Median | Sigma |
| A | 6 | 250 | 899627 | 5529.16 | 647 | 630 | 162.6 |
| A | 10 | 253 | 779069 | 4787.69 | 647 | 630 | 162.6 |
| A | 8 | 8 | 663031 | 4074.01 | 647 | 630 | 162.6 |
| B | 5 | 172 | 290451 | 2050.63 | 663 | 643 | 141.3 |
| B | 0 | 213 | 91420 | 642.32 | 663 | 643 | 141.3 |
| B | 4 | 216 | 86382 | 606.67 | 663 | 643 | 141.3 |
| C | 15 | 213 | 7849512 | 83389.95 | 333 | 331 | 94.1 |
| C | 4 | 111 | 1823564 | 19370.09 | 333 | 331 | 94.1 |
| C | 15 | 230 | 809599 | 8597.69 | 333 | 331 | 94.1 |
| D | 12 | 6 | 3574871 | 29270.19 | 415 | 400 | 122.1 |
| D | 15 | 185 | 2778436 | 22748.44 | 415 | 400 | 122.1 |
| D | 8 | 192 | 959392 | 7852.88 | 415 | 400 | 122.1 |
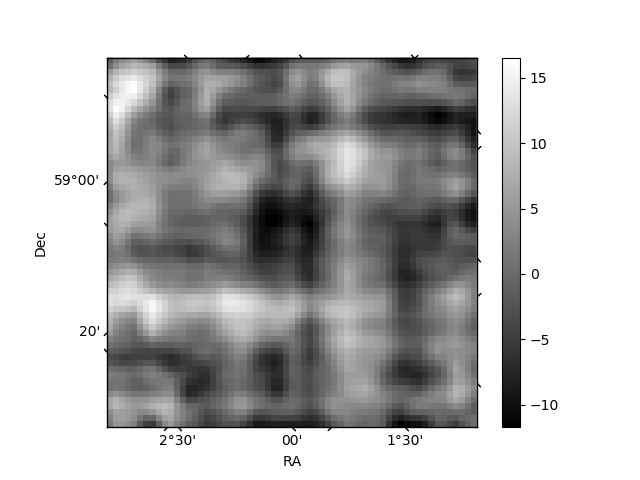
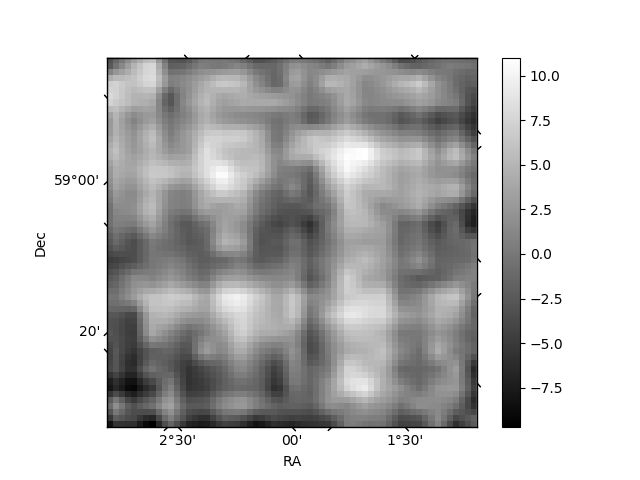
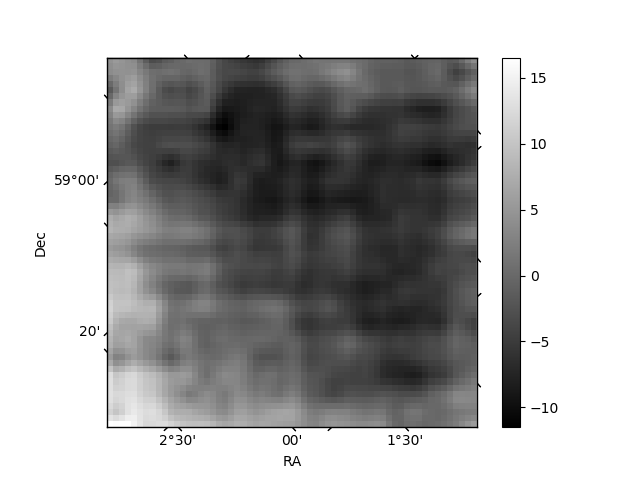
Histogram calculated using DETX and DETY for each event in the final _common_clean file
| Quadrant A | 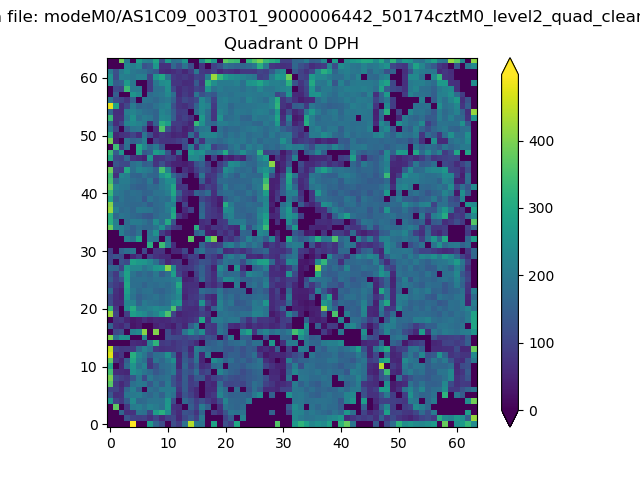 |
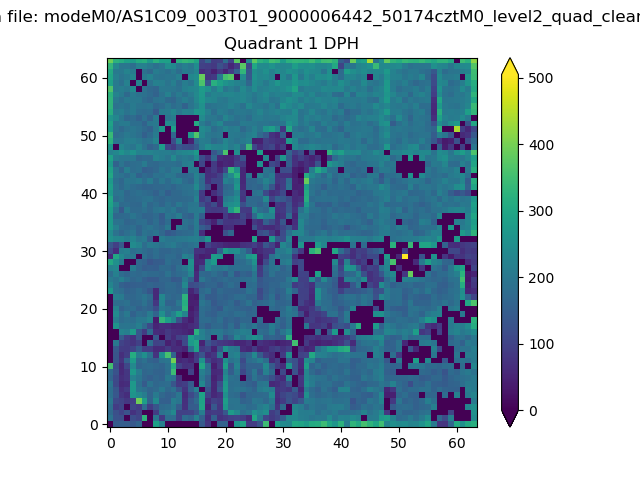 |
Quadrant B |
|---|---|---|---|
| Quadrant D | 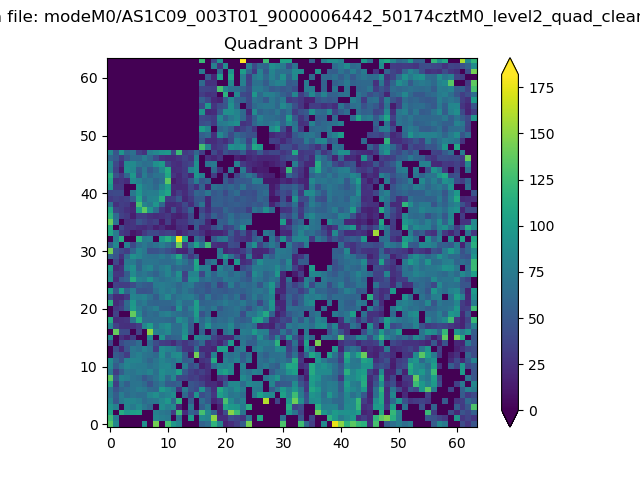 |
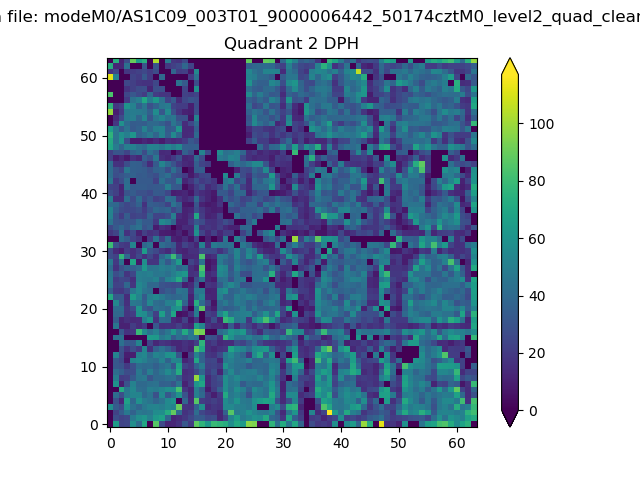 |
Quadrant C |
| Plot type | Count rate plots | Images |
|---|---|---|
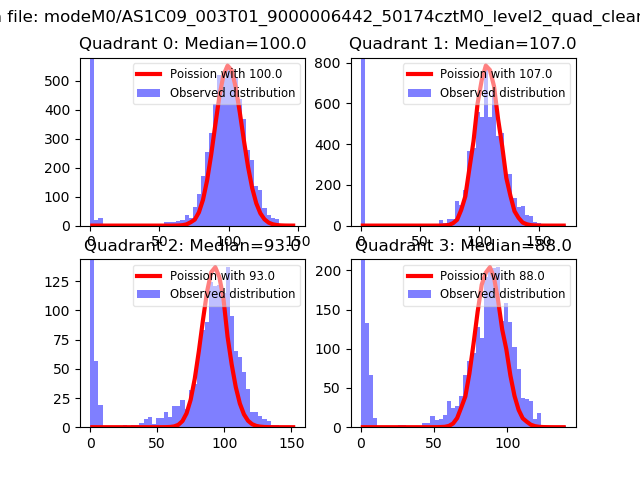
| Comparison with Poisson distribution Blue bars denote a histogram of data divided into 1 sec bins. Red curve is a Poisson curve with rate = median count rate of data. |
 |
 |
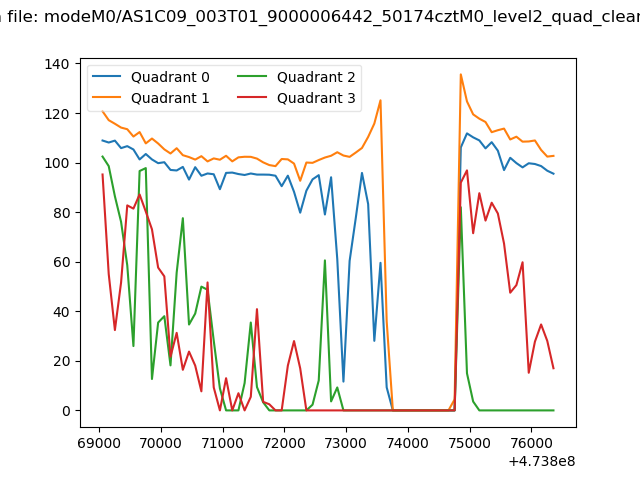
| Quadrant-wise count rates Data is divided into 100 sec bins |
 |
|
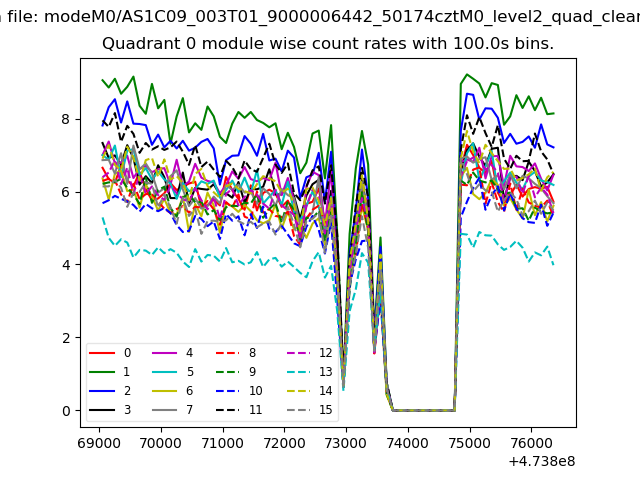
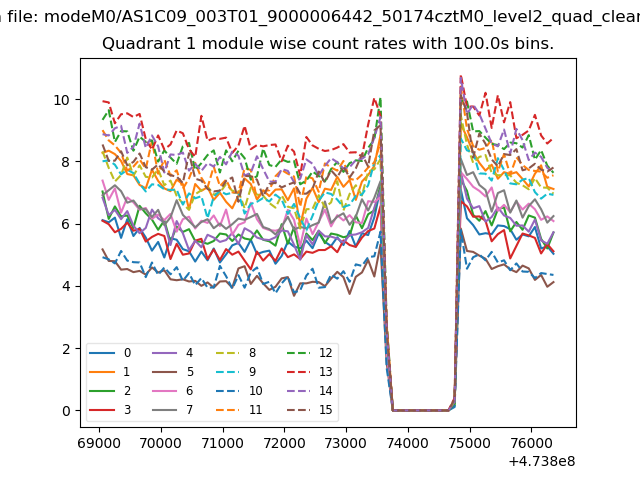
| Module-wise count rates for Quadrant A Data is divided into 100 sec bins |
 |
 |
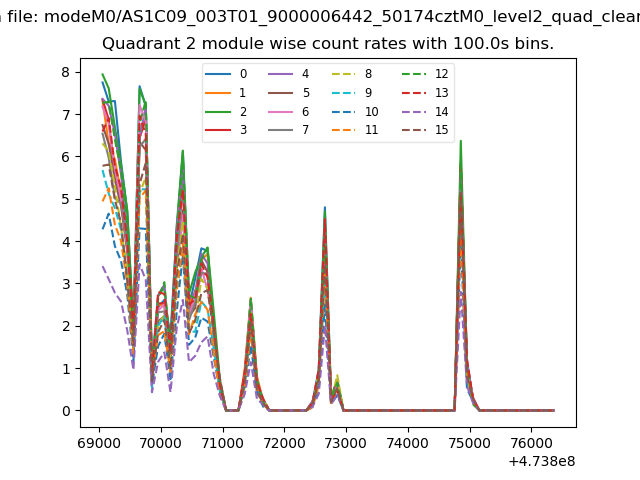
| Module-wise count rates for Quadrant B Data is divided into 100 sec bins |
 |
 |
| Module-wise count rates for Quadrant C Data is divided into 100 sec bins |
 |
 |
| Module-wise count rates for Quadrant D Data is divided into 100 sec bins |
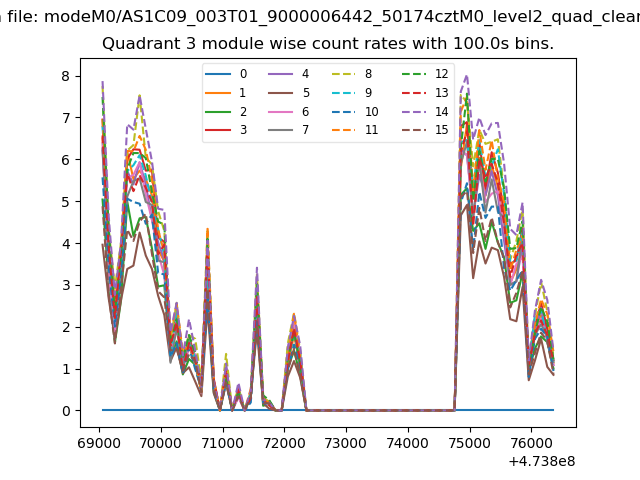 |
 |
| Parameter | Plot |
|---|---|
| CZT HV Monitor | 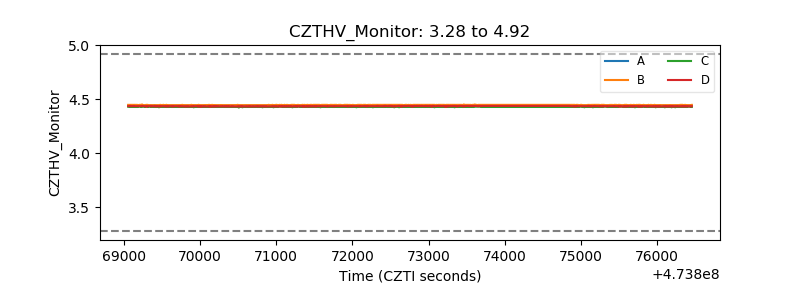 |
| D_VDD | 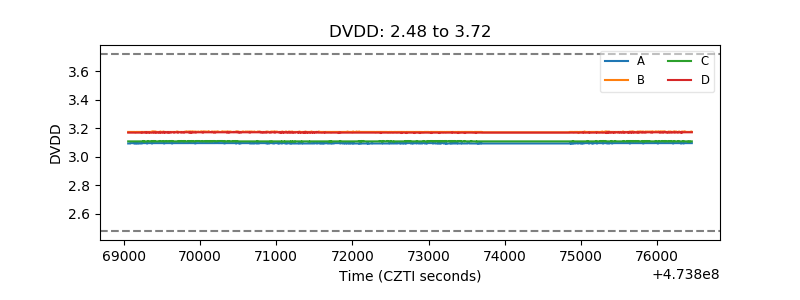 |
| Temperature 1 | 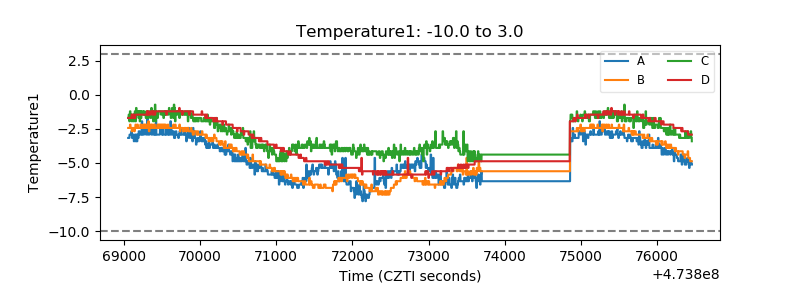 |
| Veto HV Monitor |  |
| Veto LLD | 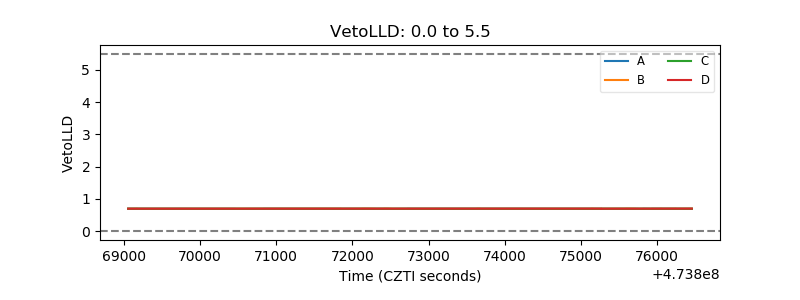 |
| Alpha Counter | 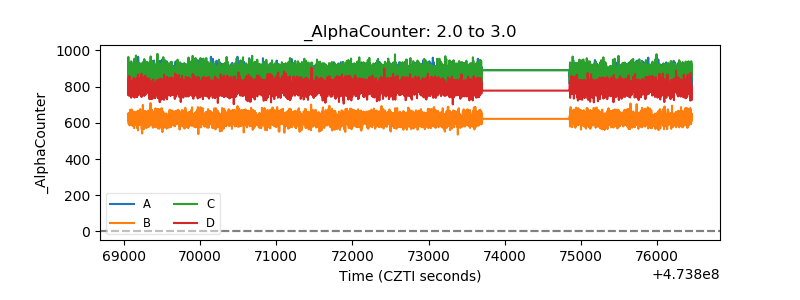 |
| _CPM_Rate | 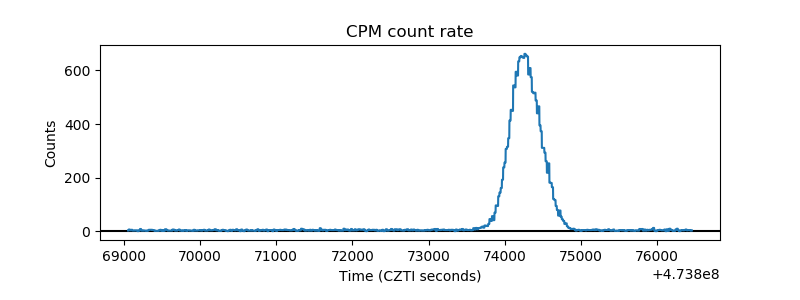 |
| CZT Counter | 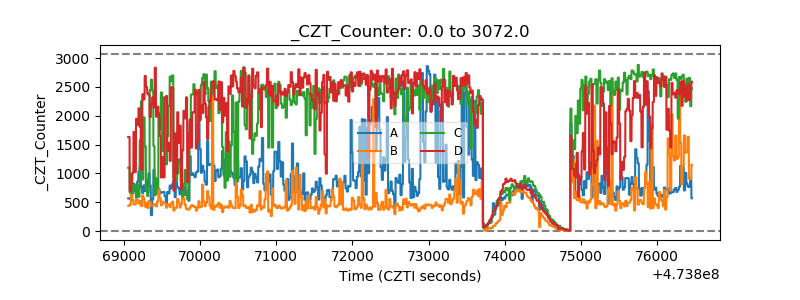 |
| +2.5 Volts monitor |  |
| +5 Volts monitor | 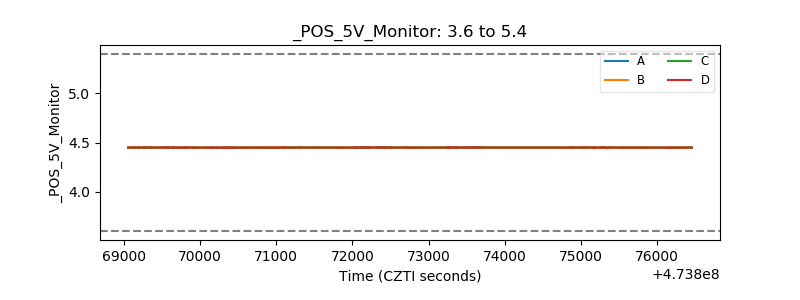 |
| _ROLL_ROT | 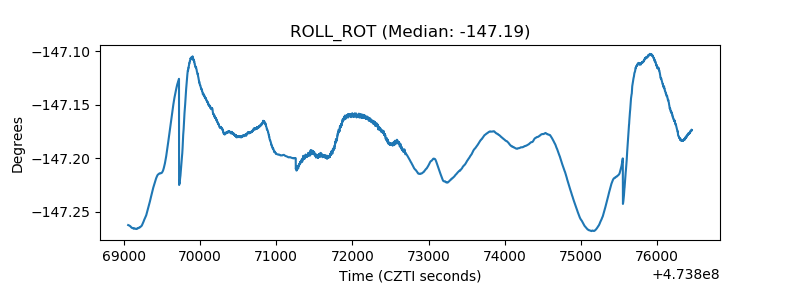 |
| _Roll_DEC | 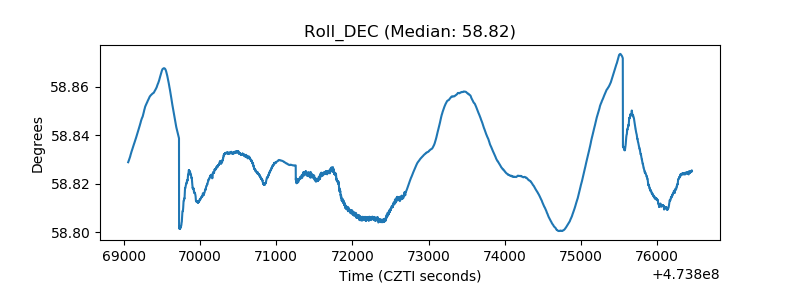 |
| _Roll_RA | 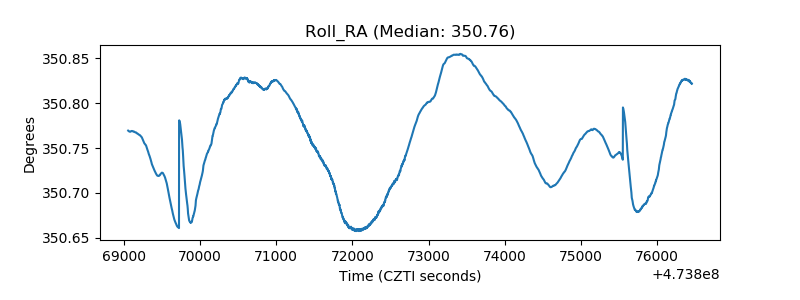 |
| Veto Counter | 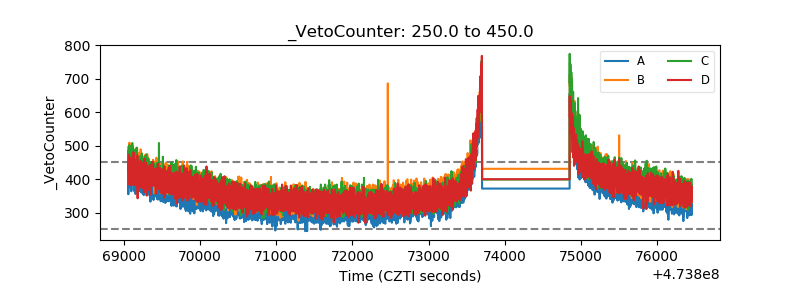 |