| Param | Original file | Final file |
|---|---|---|
| Filename | modeM0/AS1C09_003T01_9000006442_50175cztM0_level2.fits | modeM0/AS1C09_003T01_9000006442_50175cztM0_level2_quad_clean.evt |
| Size (bytes) | 1,105,899,840 | 59,760,000 |
| Size | 1.0 GB | 57.0 MB |
| Events in quadrant A | 6,923,587 | 522,847 |
| Events in quadrant B | 4,038,846 | 650,764 |
| Events in quadrant C | 15,285,812 | 4,408 |
| Events in quadrant D | 14,194,548 | 184,686 |
| Mode M9 | |||
|---|---|---|---|
| Quadrant | BADHDUFLAG | Total packets | Discarded packets |
| A | 0 | 11 | 0 |
| B | 0 | 11 | 0 |
| C | 0 | 11 | 0 |
| D | 0 | 11 | 0 |
| Mode M0 | |||
|---|---|---|---|
| Quadrant | BADHDUFLAG | Total packets | Discarded packets |
| A | 0 | 25148 | 1 |
| B | 0 | 16516 | 1 |
| C | 0 | 49782 | 1 |
| D | 0 | 46562 | 1 |
| Mode SS | |||
|---|---|---|---|
| Quadrant | BADHDUFLAG | Total packets | Discarded packets |
| A | 0 | 130 | 0 |
| B | 0 | 130 | 0 |
| C | 0 | 130 | 0 |
| D | 0 | 130 | 0 |
| Quadrant | Total seconds | Saturated seconds | Saturation percentage |
|---|---|---|---|
| A | 6398 | 1093 | 17.083464% |
| B | 6399 | 324 | 5.063291% |
| C | 6399 | 6370 | 99.546804% |
| D | 6399 | 4660 | 72.823879% |
Noise dominated data is calculated using 1-second bins in cleaned event files. If a bin has >2000 counts, and if more than 50% of those come from <1% of pixels, then it is considered to be noise-dominated and hence unusable.
| Quadrant | # 1 sec bins | Bins with >0 counts | Bins with >2000 counts | High rate bins dominated by noise | Noise dominated (total time) | Noise dominated (detector-on time) | Marked lightcurve |
|---|---|---|---|---|---|---|---|
| A | 7458 | 6399 | 991 | 991 | 13.29% | 15.49% | 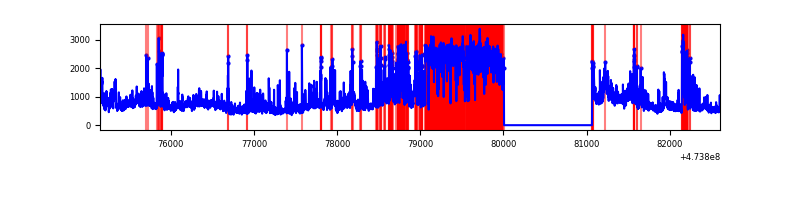 |
| B | 7459 | 6400 | 225 | 225 | 3.02% | 3.52% | 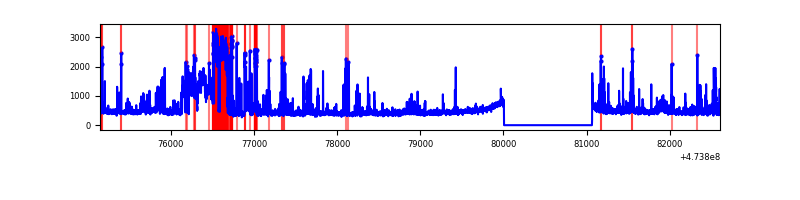 |
| C | 7459 | 6400 | 5399 | 5399 | 72.38% | 84.36% | 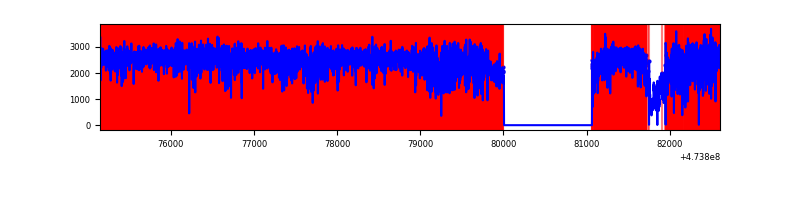 |
| D | 7459 | 6400 | 4722 | 4722 | 63.31% | 73.78% | 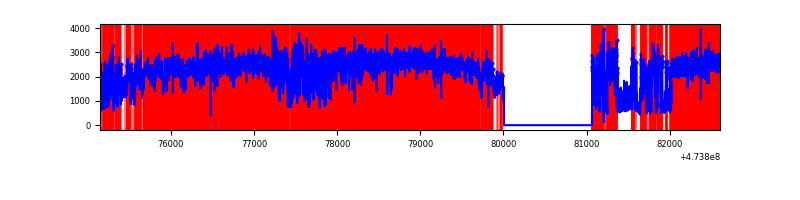 |
Top three noisy pixels from each quadrant. If the there are fewer than three noisy pixels in the level2.evt file, extra rows are filled as -1
| Pixel properties | Quadrant properties | ||||||
|---|---|---|---|---|---|---|---|
| Quadrant | DetID | PixID | Counts | Sigma | Mean | Median | Sigma |
| A | 0 | 98 | 1844985 | 11741.22 | 618 | 602 | 157.1 |
| A | 6 | 250 | 680462 | 4327.94 | 618 | 602 | 157.1 |
| A | 10 | 253 | 488553 | 3106.26 | 618 | 602 | 157.1 |
| B | 5 | 172 | 861704 | 6183.88 | 662 | 642 | 139.2 |
| B | 4 | 216 | 137903 | 985.77 | 662 | 642 | 139.2 |
| B | 0 | 213 | 87884 | 626.54 | 662 | 642 | 139.2 |
| C | 15 | 213 | 8759966 | 151890.59 | 197 | 195 | 57.7 |
| C | 4 | 111 | 3462197 | 60029.59 | 197 | 195 | 57.7 |
| C | 15 | 214 | 543632 | 9422.95 | 197 | 195 | 57.7 |
| D | 15 | 185 | 2500259 | 18636.21 | 474 | 459 | 134.1 |
| D | 12 | 6 | 1836790 | 13690.0 | 474 | 459 | 134.1 |
| D | 15 | 168 | 1796900 | 13392.61 | 474 | 459 | 134.1 |
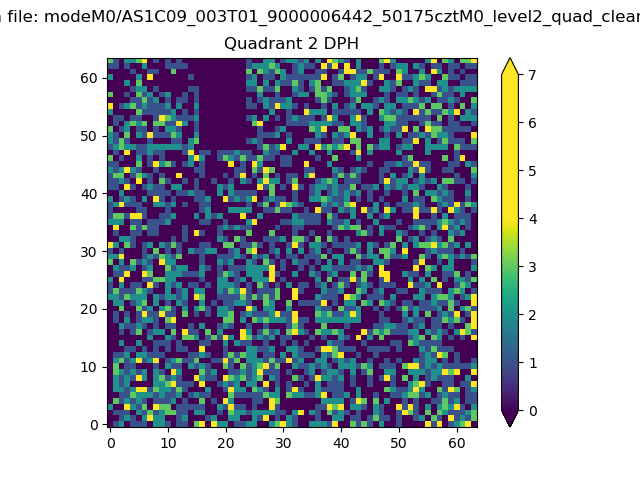
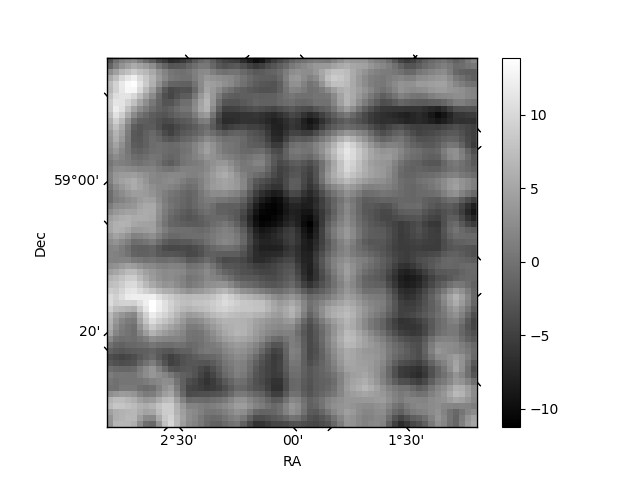
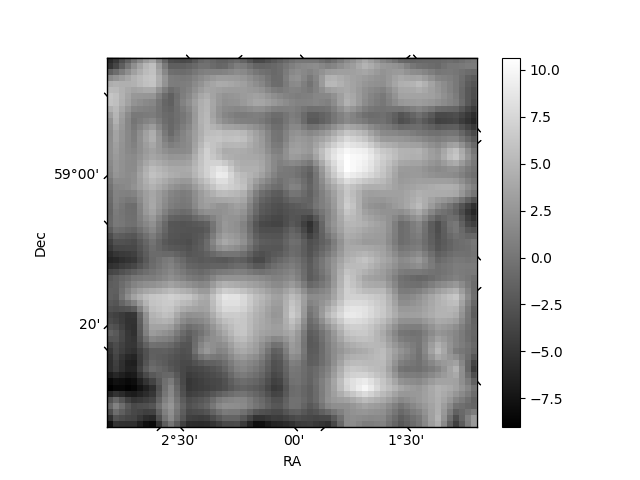
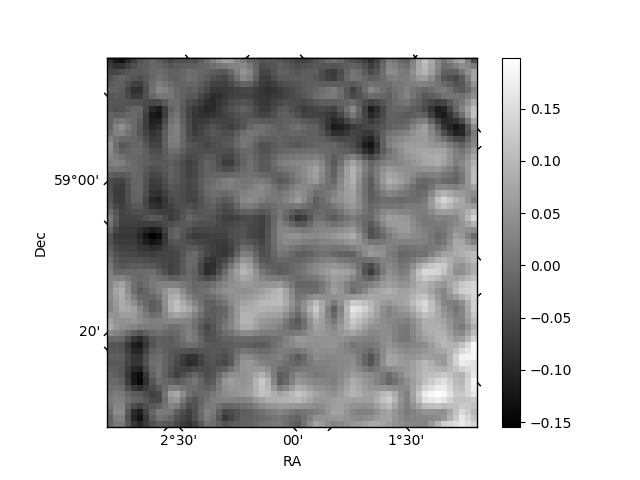
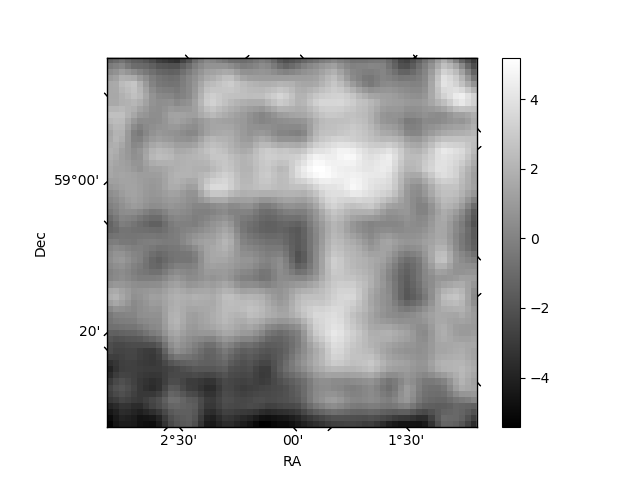
Histogram calculated using DETX and DETY for each event in the final _common_clean file
| Quadrant A | 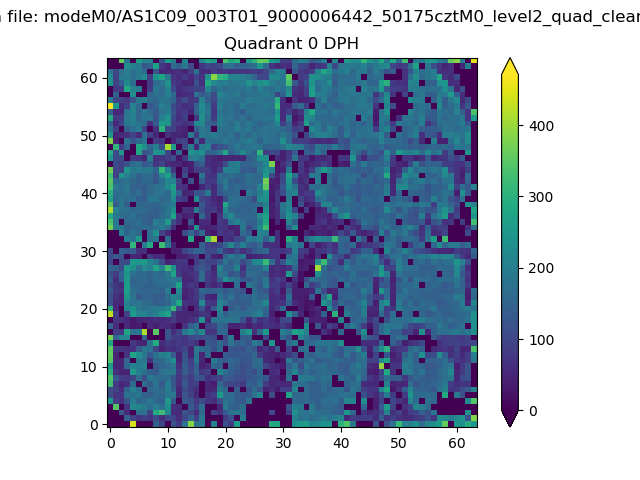 |
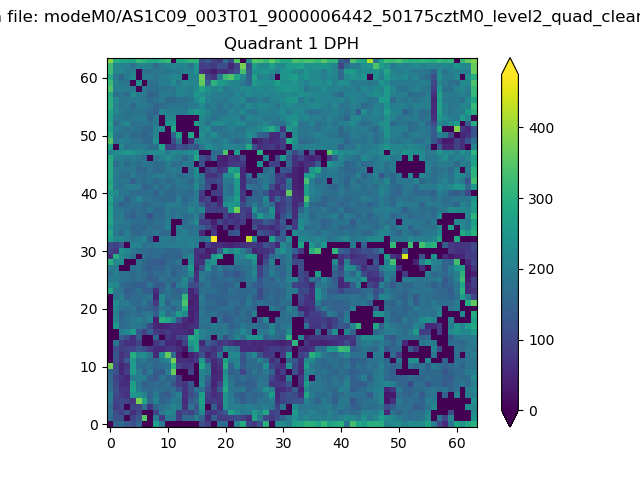 |
Quadrant B |
|---|---|---|---|
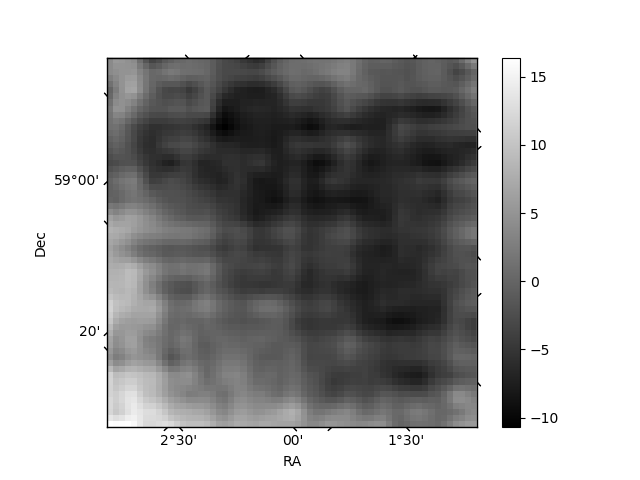
| Quadrant D | 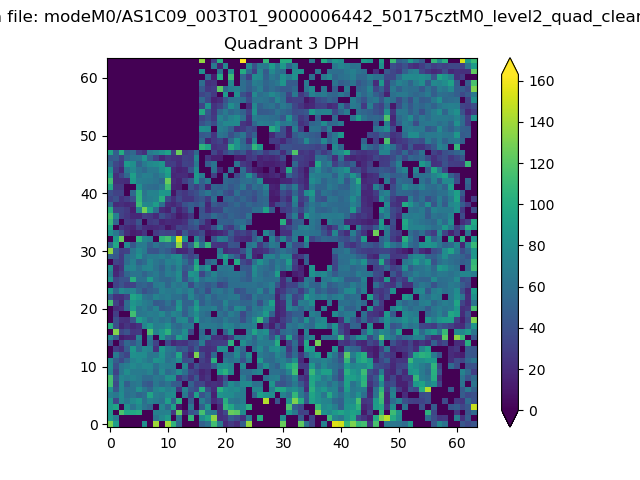 |
 |
Quadrant C |
| Plot type | Count rate plots | Images |
|---|---|---|
| Comparison with Poisson distribution Blue bars denote a histogram of data divided into 1 sec bins. Red curve is a Poisson curve with rate = median count rate of data. |
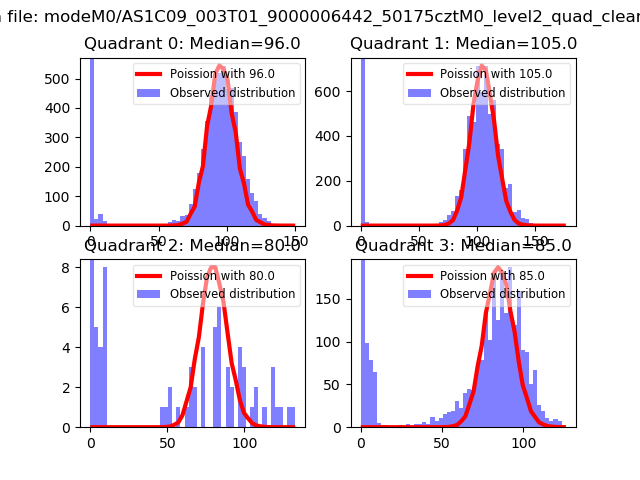 |
 |
| Quadrant-wise count rates Data is divided into 100 sec bins |
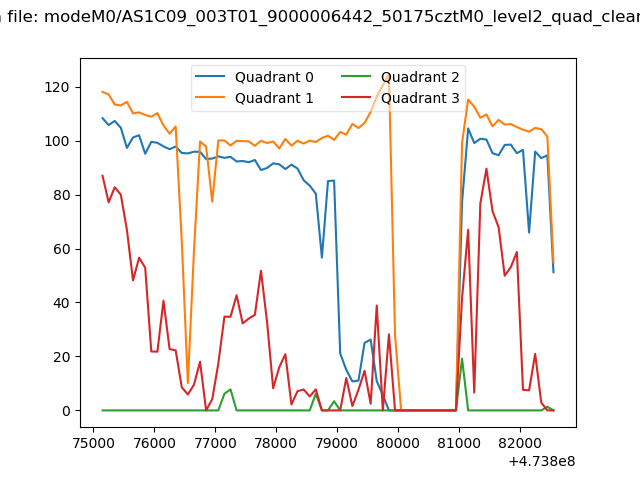 |
|
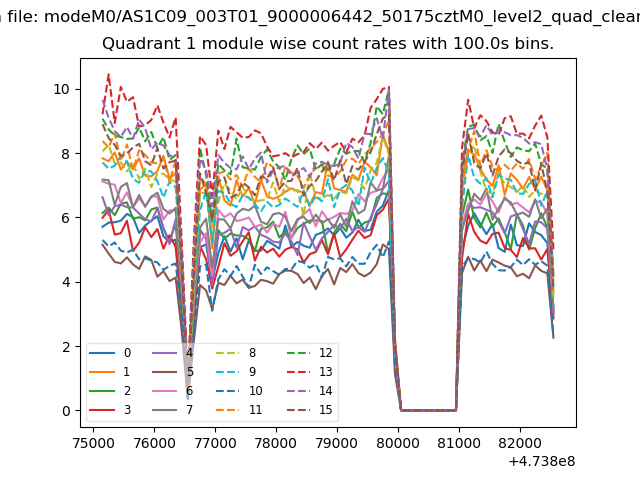
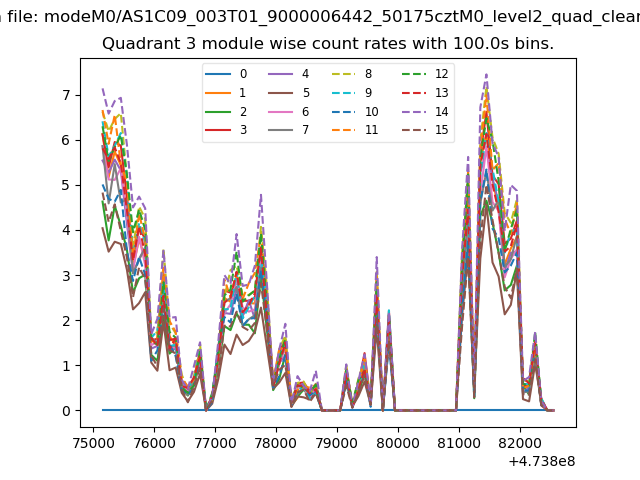
| Module-wise count rates for Quadrant A Data is divided into 100 sec bins |
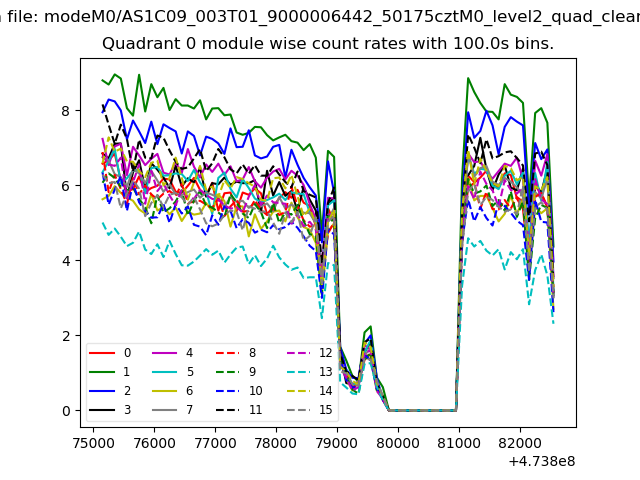 |
 |
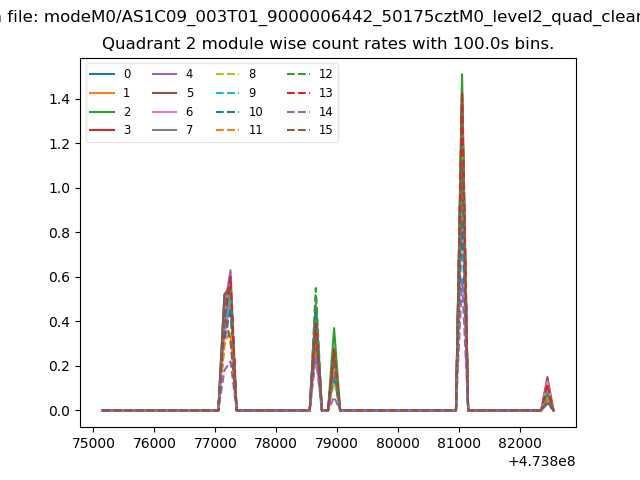
| Module-wise count rates for Quadrant B Data is divided into 100 sec bins |
 |
 |
| Module-wise count rates for Quadrant C Data is divided into 100 sec bins |
 |
 |
| Module-wise count rates for Quadrant D Data is divided into 100 sec bins |
 |
 |
| Parameter | Plot |
|---|---|
| CZT HV Monitor | 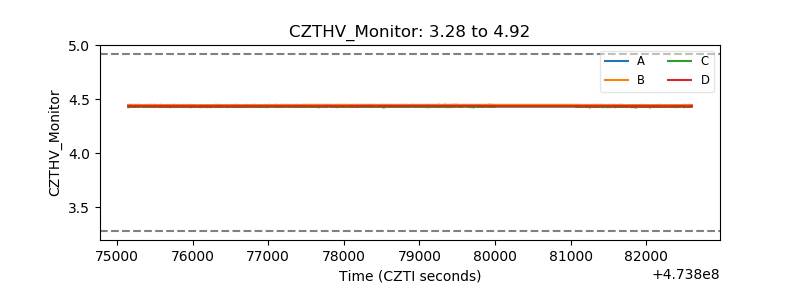 |
| D_VDD | 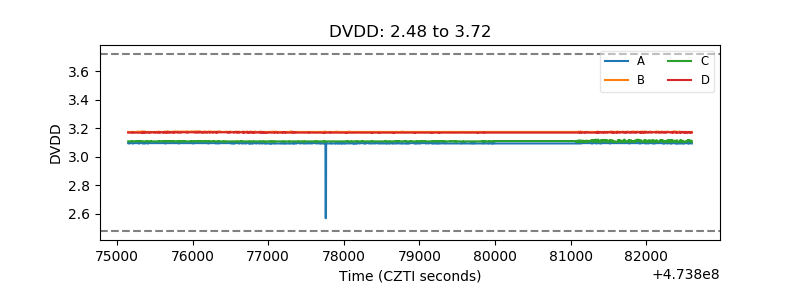 |
| Temperature 1 | 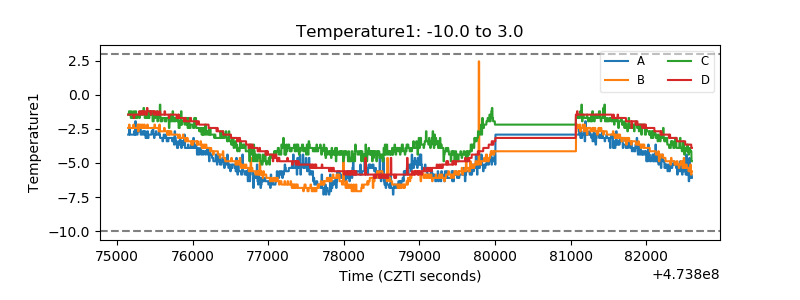 |
| Veto HV Monitor | 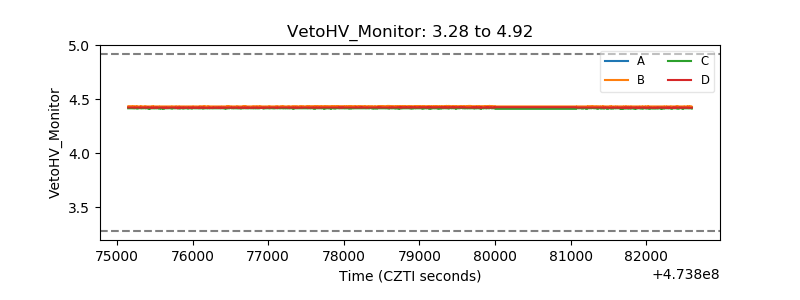 |
| Veto LLD | 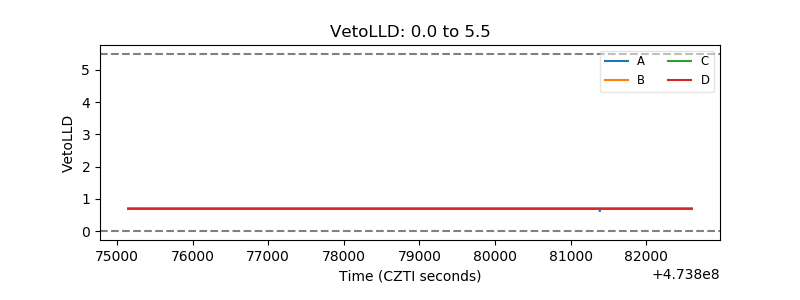 |
| Alpha Counter | 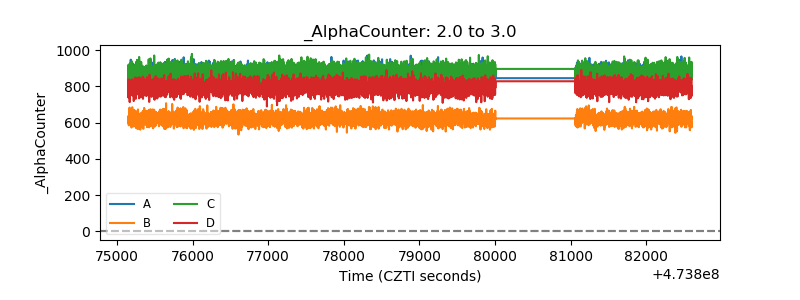 |
| _CPM_Rate | 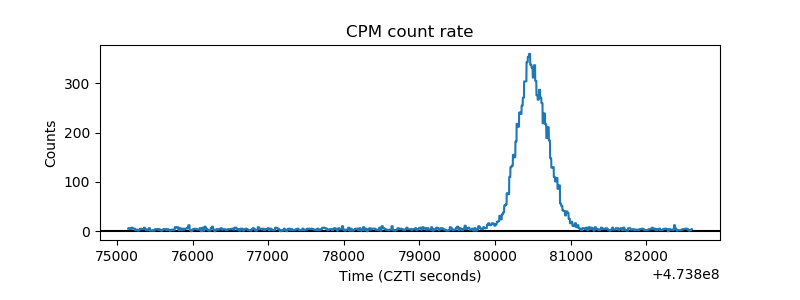 |
| CZT Counter | 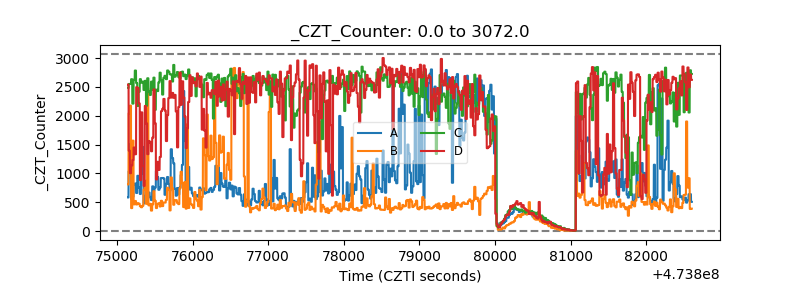 |
| +2.5 Volts monitor | 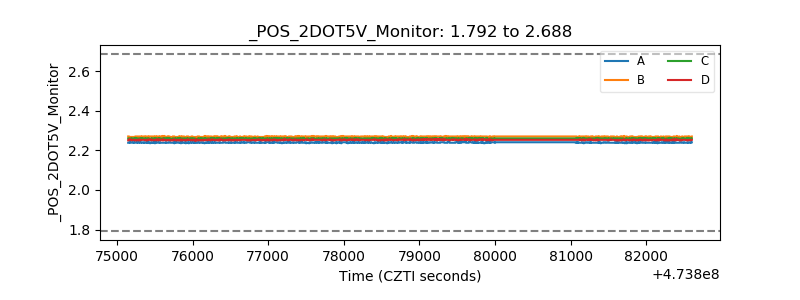 |
| +5 Volts monitor |  |
| _ROLL_ROT | 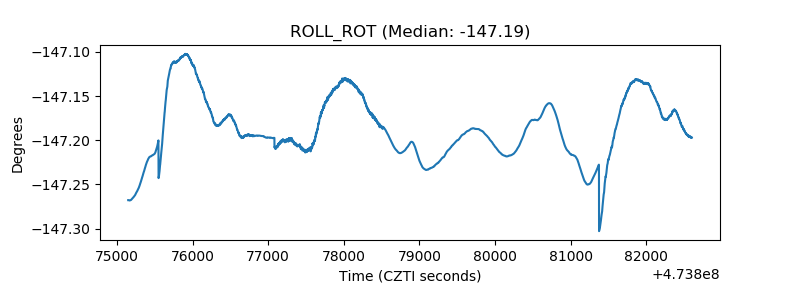 |
| _Roll_DEC | 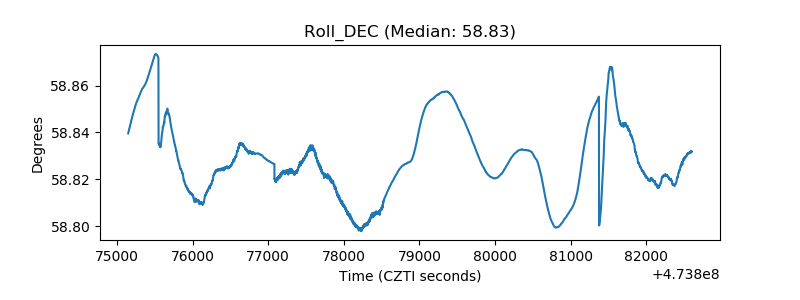 |
| _Roll_RA | 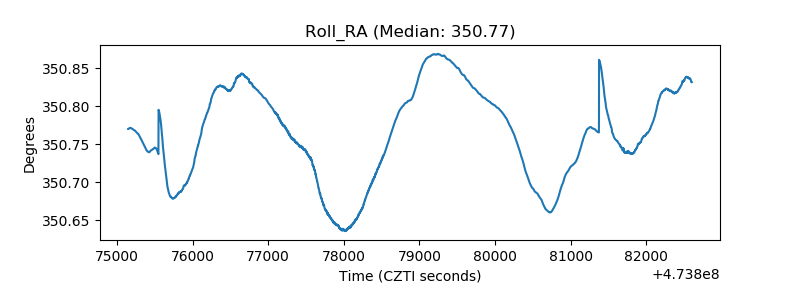 |
| Veto Counter | 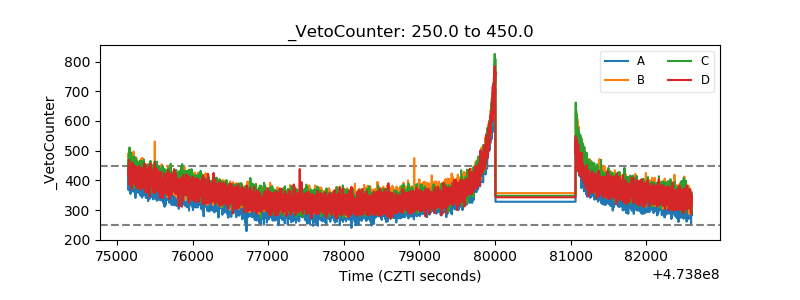 |