| Param | Original file | Final file |
|---|---|---|
| Filename | modeM0/AS1C09_003T01_9000006442_50176cztM0_level2.fits | modeM0/AS1C09_003T01_9000006442_50176cztM0_level2_quad_clean.evt |
| Size (bytes) | 1,148,564,160 | 66,052,800 |
| Size | 1.1 GB | 63.0 MB |
| Events in quadrant A | 7,661,577 | 527,301 |
| Events in quadrant B | 4,086,595 | 682,341 |
| Events in quadrant C | 15,781,790 | 77,117 |
| Events in quadrant D | 14,457,669 | 235,927 |
| Mode M9 | |||
|---|---|---|---|
| Quadrant | BADHDUFLAG | Total packets | Discarded packets |
| A | 0 | 8 | 0 |
| B | 0 | 9 | 0 |
| C | 0 | 9 | 0 |
| D | 0 | 9 | 0 |
| Mode M0 | |||
|---|---|---|---|
| Quadrant | BADHDUFLAG | Total packets | Discarded packets |
| A | 0 | 27566 | 2 |
| B | 0 | 17014 | 2 |
| C | 0 | 51633 | 2 |
| D | 0 | 47666 | 2 |
| Mode SS | |||
|---|---|---|---|
| Quadrant | BADHDUFLAG | Total packets | Discarded packets |
| A | 0 | 138 | 0 |
| B | 0 | 138 | 0 |
| C | 0 | 138 | 0 |
| D | 0 | 138 | 0 |
| Quadrant | Total seconds | Saturated seconds | Saturation percentage |
|---|---|---|---|
| A | 6847 | 1448 | 21.147948% |
| B | 6847 | 339 | 4.951073% |
| C | 6846 | 6151 | 89.848086% |
| D | 6846 | 4480 | 65.439673% |
Noise dominated data is calculated using 1-second bins in cleaned event files. If a bin has >2000 counts, and if more than 50% of those come from <1% of pixels, then it is considered to be noise-dominated and hence unusable.
| Quadrant | # 1 sec bins | Bins with >0 counts | Bins with >2000 counts | High rate bins dominated by noise | Noise dominated (total time) | Noise dominated (detector-on time) | Marked lightcurve |
|---|---|---|---|---|---|---|---|
| A | 7622 | 6848 | 1259 | 1259 | 16.52% | 18.38% | 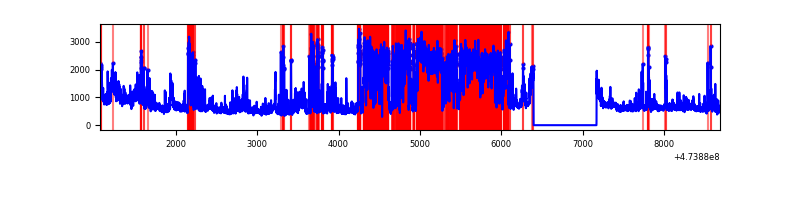 |
| B | 7622 | 6848 | 225 | 225 | 2.95% | 3.29% | 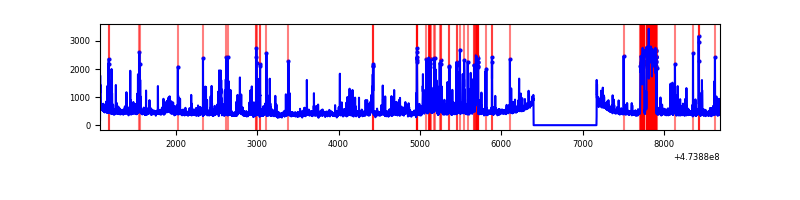 |
| C | 7621 | 6847 | 5211 | 5211 | 68.38% | 76.11% | 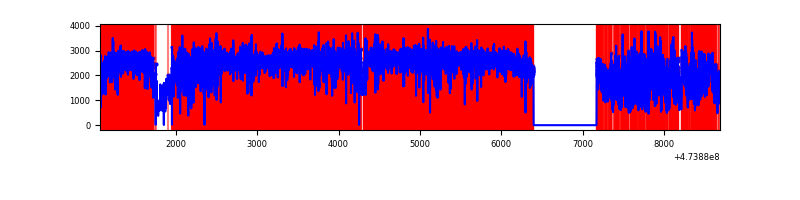 |
| D | 7621 | 6847 | 4484 | 4484 | 58.84% | 65.49% | 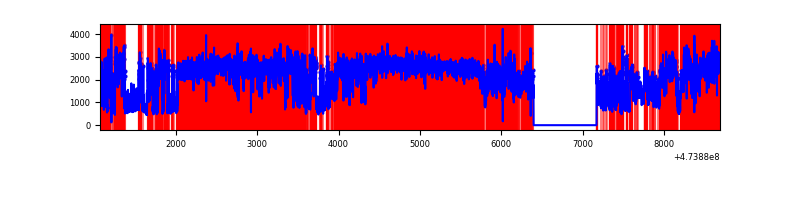 |
Top three noisy pixels from each quadrant. If the there are fewer than three noisy pixels in the level2.evt file, extra rows are filled as -1
| Pixel properties | Quadrant properties | ||||||
|---|---|---|---|---|---|---|---|
| Quadrant | DetID | PixID | Counts | Sigma | Mean | Median | Sigma |
| A | 0 | 98 | 2498524 | 14834.51 | 671 | 655 | 168.4 |
| A | 8 | 8 | 534693 | 3171.58 | 671 | 655 | 168.4 |
| A | 6 | 250 | 412301 | 2444.71 | 671 | 655 | 168.4 |
| B | 5 | 172 | 416780 | 2781.28 | 710 | 686 | 149.6 |
| B | 8 | 234 | 164537 | 1095.22 | 710 | 686 | 149.6 |
| B | 4 | 216 | 113452 | 753.76 | 710 | 686 | 149.6 |
| C | 15 | 213 | 9272878 | 119830.86 | 265 | 262 | 77.4 |
| C | 4 | 111 | 2687438 | 34726.62 | 265 | 262 | 77.4 |
| C | 15 | 230 | 494606 | 6388.45 | 265 | 262 | 77.4 |
| D | 12 | 6 | 3945490 | 25917.23 | 531 | 513 | 152.2 |
| D | 15 | 185 | 2070420 | 13598.62 | 531 | 513 | 152.2 |
| D | 15 | 106 | 1945172 | 12775.79 | 531 | 513 | 152.2 |
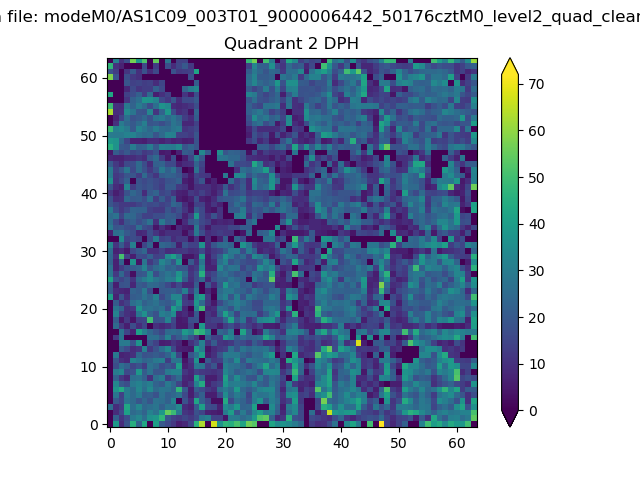
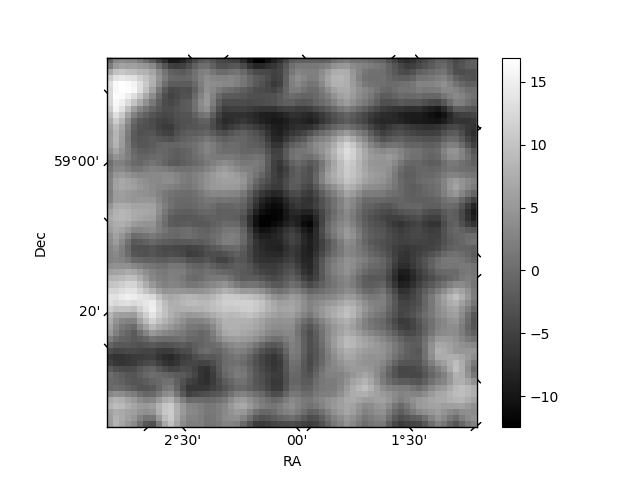
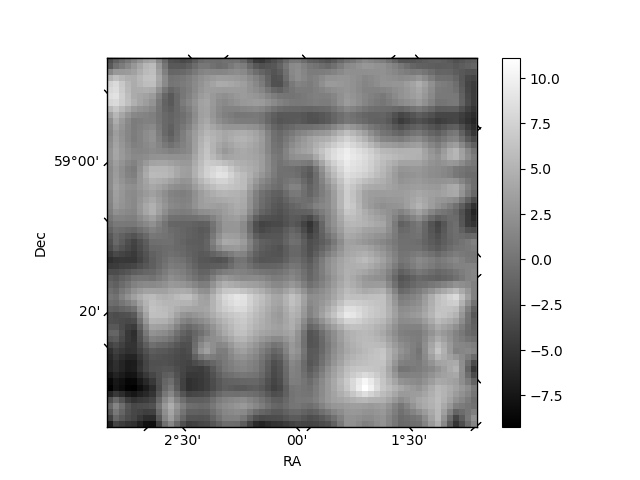
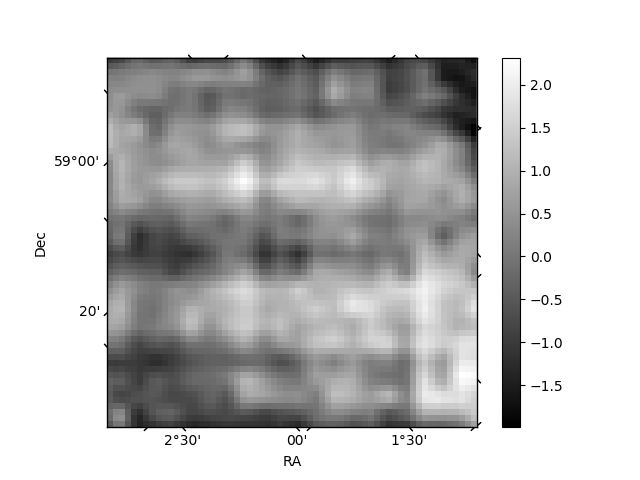
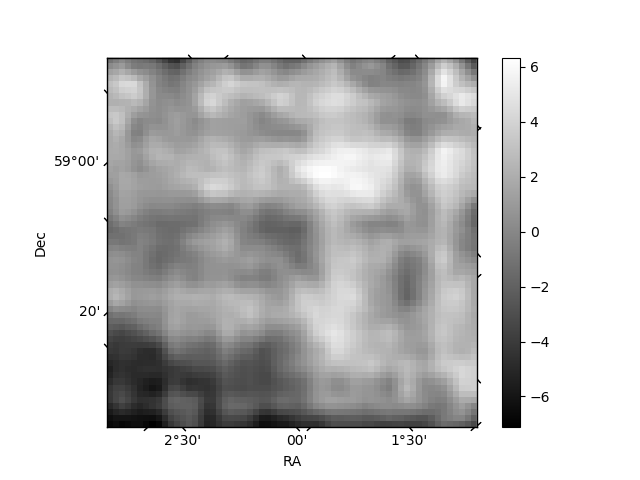
Histogram calculated using DETX and DETY for each event in the final _common_clean file
| Quadrant A | 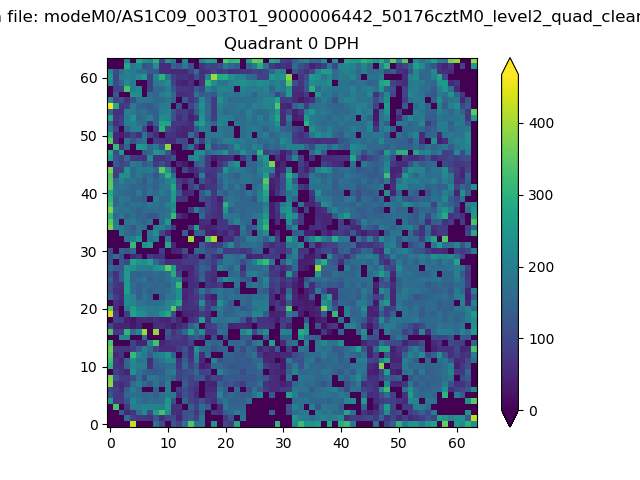 |
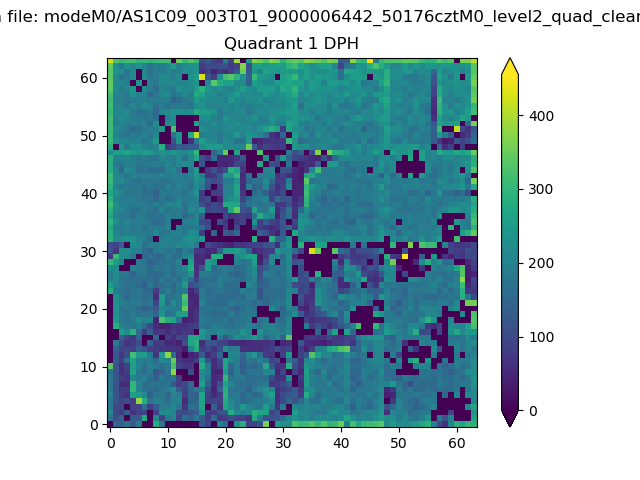 |
Quadrant B |
|---|---|---|---|
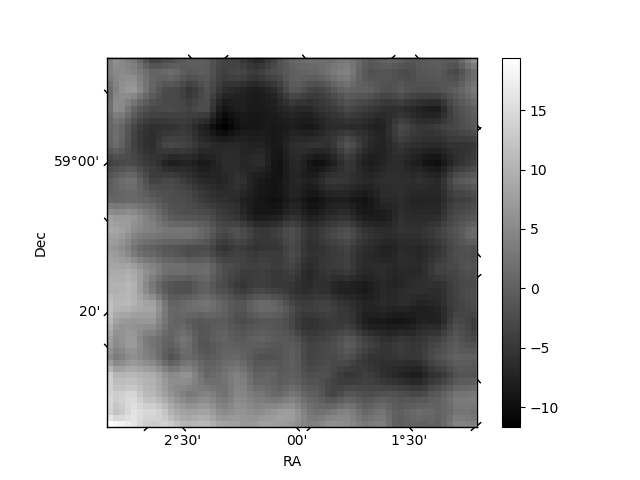
| Quadrant D | 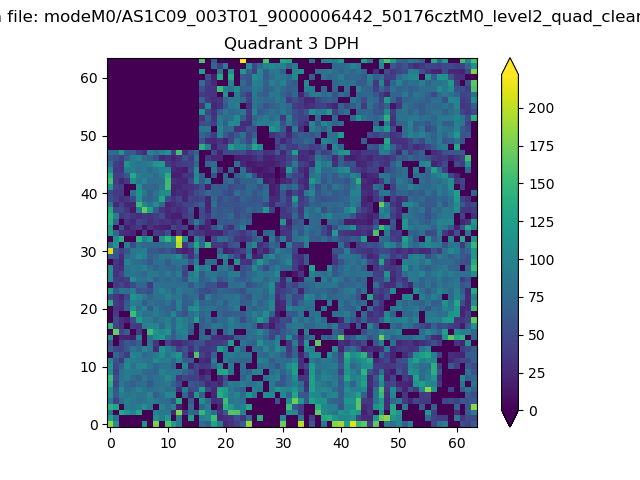 |
 |
Quadrant C |
| Plot type | Count rate plots | Images |
|---|---|---|
| Comparison with Poisson distribution Blue bars denote a histogram of data divided into 1 sec bins. Red curve is a Poisson curve with rate = median count rate of data. |
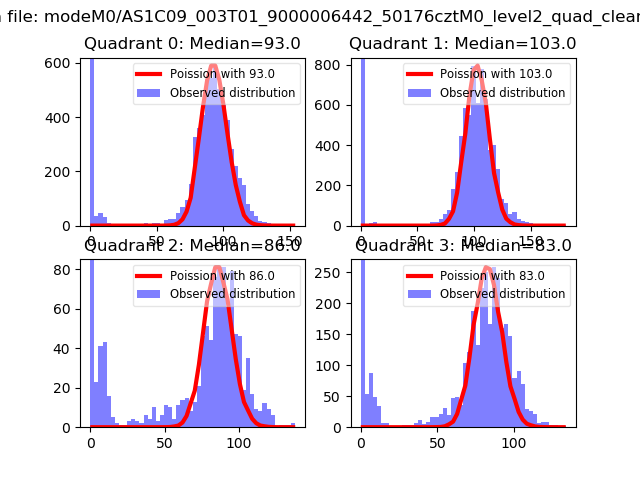 |
 |
| Quadrant-wise count rates Data is divided into 100 sec bins |
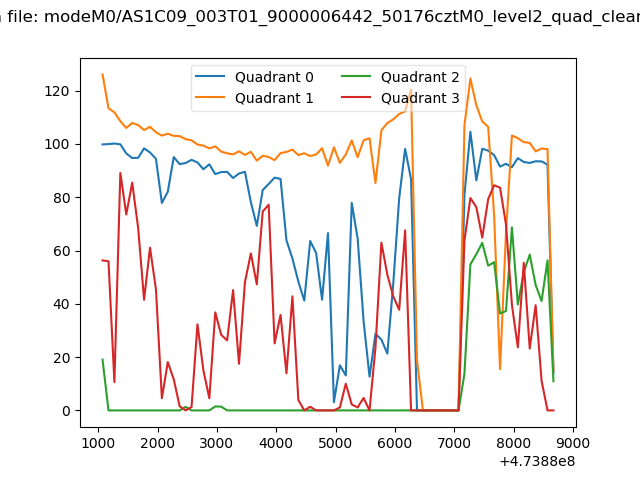 |
|
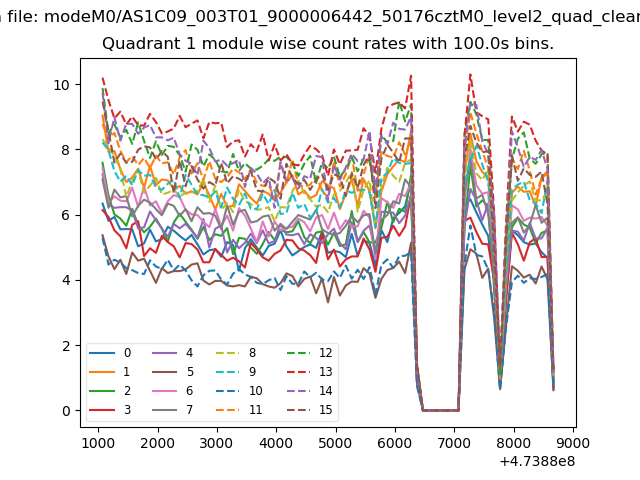
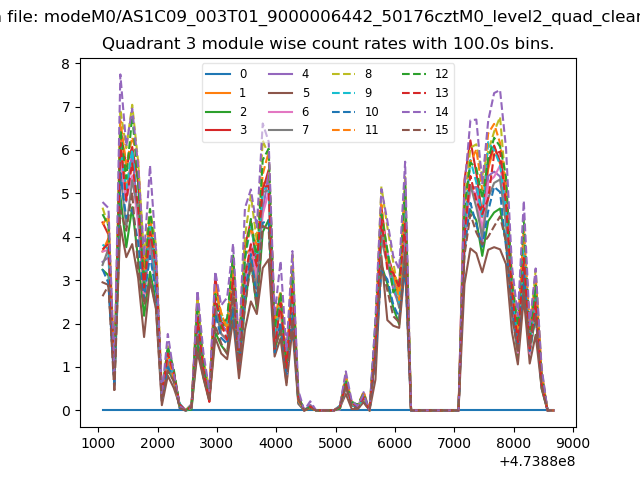
| Module-wise count rates for Quadrant A Data is divided into 100 sec bins |
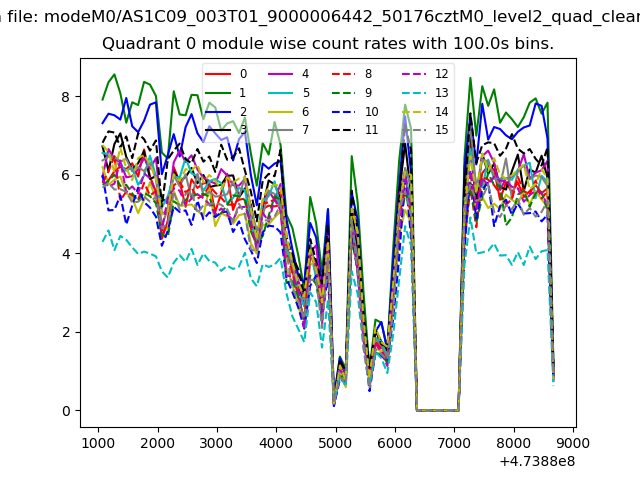 |
 |
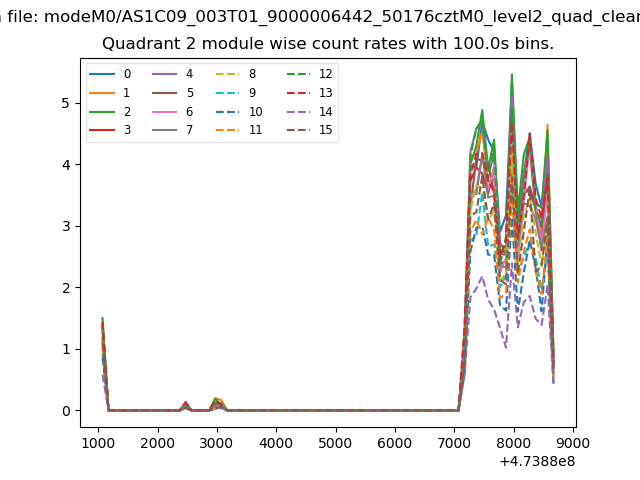
| Module-wise count rates for Quadrant B Data is divided into 100 sec bins |
 |
 |
| Module-wise count rates for Quadrant C Data is divided into 100 sec bins |
 |
 |
| Module-wise count rates for Quadrant D Data is divided into 100 sec bins |
 |
 |
| Parameter | Plot |
|---|---|
| CZT HV Monitor | 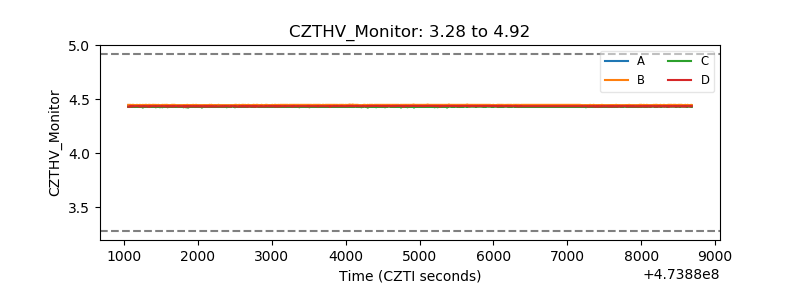 |
| D_VDD | 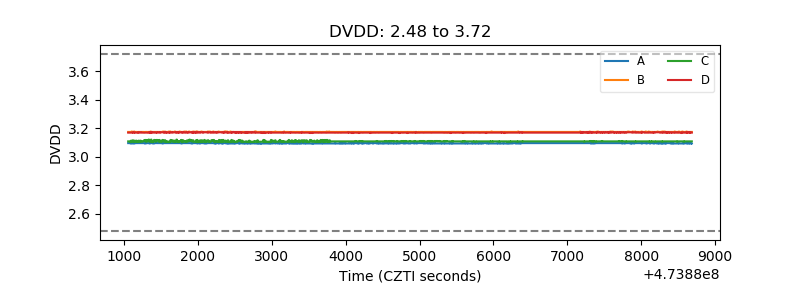 |
| Temperature 1 | 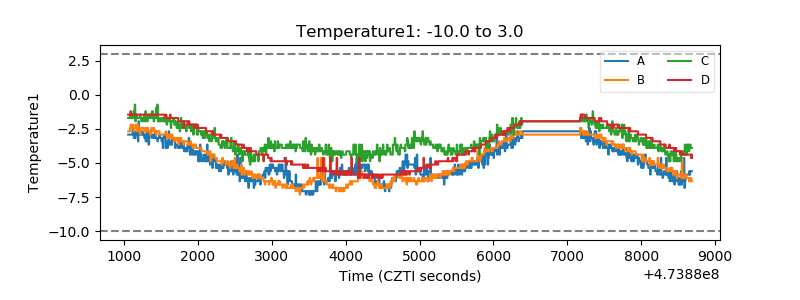 |
| Veto HV Monitor | 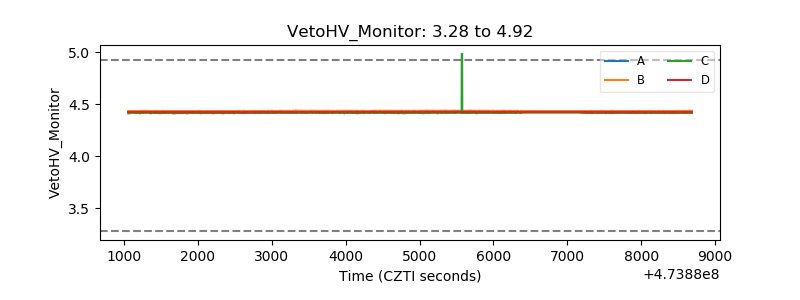 |
| Veto LLD | 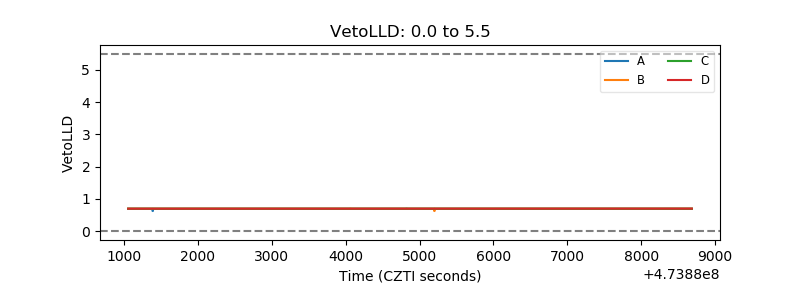 |
| Alpha Counter | 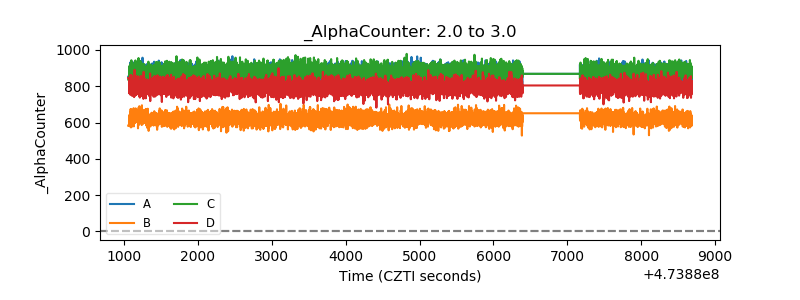 |
| _CPM_Rate | 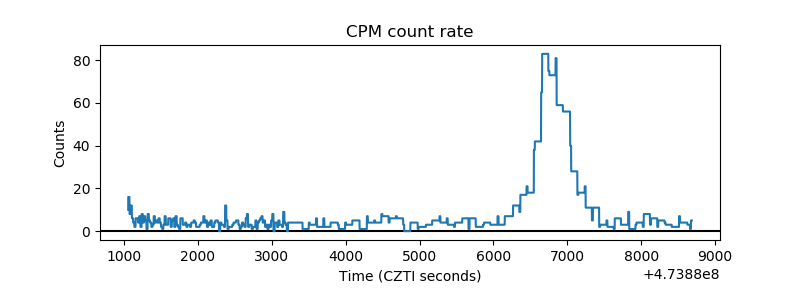 |
| CZT Counter | 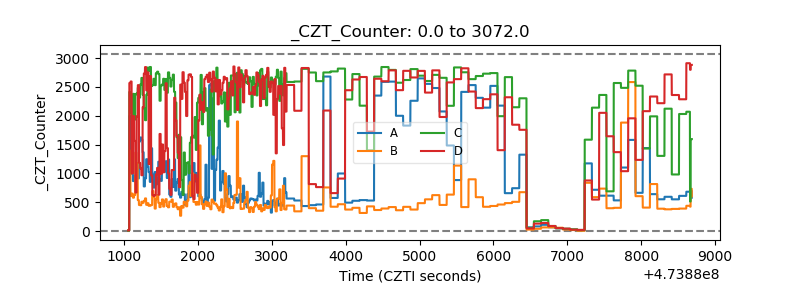 |
| +2.5 Volts monitor |  |
| +5 Volts monitor | 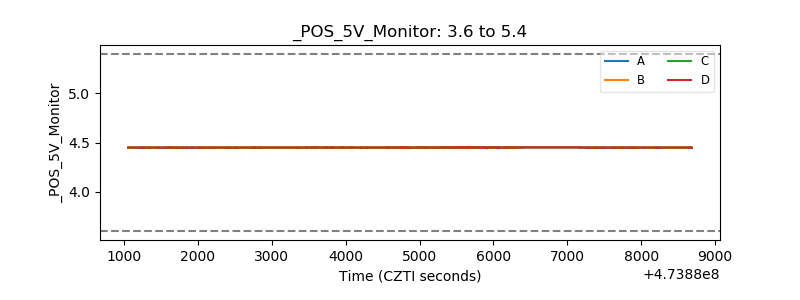 |
| _ROLL_ROT | 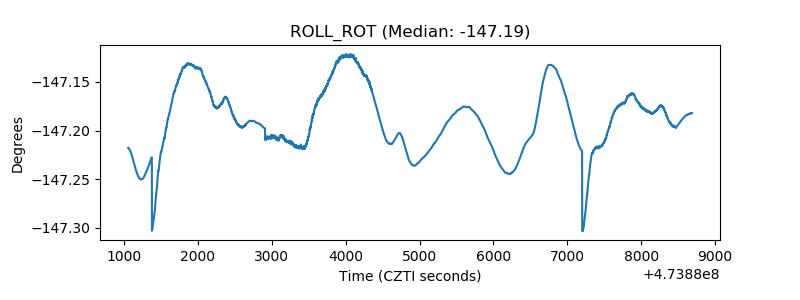 |
| _Roll_DEC | 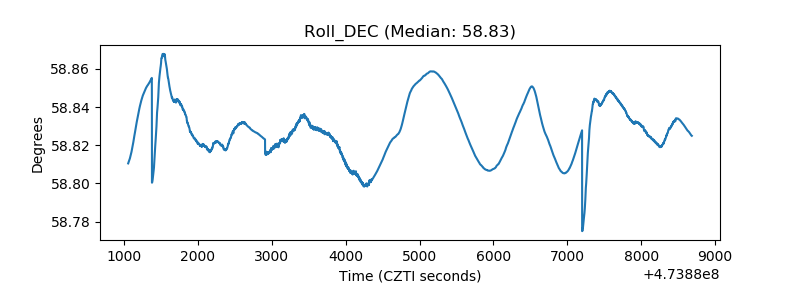 |
| _Roll_RA | 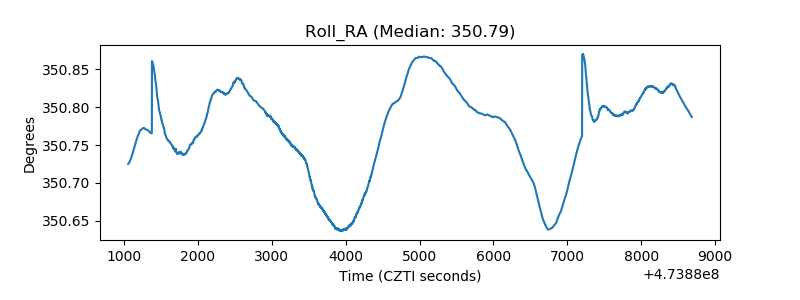 |
| Veto Counter | 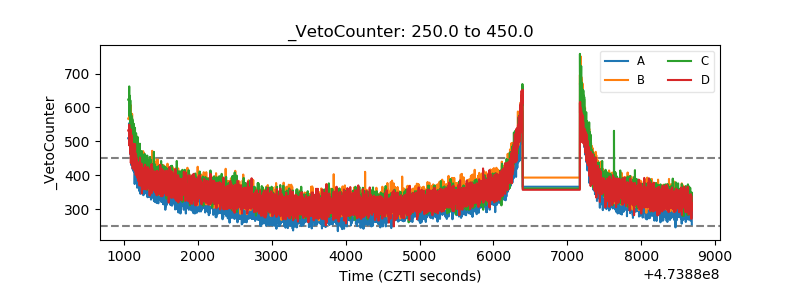 |