| Param | Original file | Final file |
|---|---|---|
| Filename | modeM0/AS1C09_003T01_9000006442_50177cztM0_level2.fits | modeM0/AS1C09_003T01_9000006442_50177cztM0_level2_quad_clean.evt |
| Size (bytes) | 1,164,110,400 | 71,887,680 |
| Size | 1.1 GB | 68.6 MB |
| Events in quadrant A | 7,945,991 | 562,579 |
| Events in quadrant B | 4,313,559 | 692,776 |
| Events in quadrant C | 15,676,617 | 142,479 |
| Events in quadrant D | 14,601,791 | 278,128 |
| Mode M9 | |||
|---|---|---|---|
| Quadrant | BADHDUFLAG | Total packets | Discarded packets |
| A | 0 | 3 | 0 |
| B | 0 | 3 | 0 |
| C | 0 | 3 | 0 |
| D | 0 | 3 | 0 |
| Mode M0 | |||
|---|---|---|---|
| Quadrant | BADHDUFLAG | Total packets | Discarded packets |
| A | 0 | 28692 | 1 |
| B | 0 | 17841 | 1 |
| C | 0 | 51408 | 5 |
| D | 0 | 48281 | 1 |
| Mode SS | |||
|---|---|---|---|
| Quadrant | BADHDUFLAG | Total packets | Discarded packets |
| A | 0 | 146 | 0 |
| B | 0 | 146 | 0 |
| C | 0 | 146 | 0 |
| D | 0 | 146 | 0 |
| Quadrant | Total seconds | Saturated seconds | Saturation percentage |
|---|---|---|---|
| A | 7180 | 1379 | 19.206128% |
| B | 7180 | 307 | 4.275766% |
| C | 7180 | 5754 | 80.139276% |
| D | 7180 | 4198 | 58.467967% |
Noise dominated data is calculated using 1-second bins in cleaned event files. If a bin has >2000 counts, and if more than 50% of those come from <1% of pixels, then it is considered to be noise-dominated and hence unusable.
| Quadrant | # 1 sec bins | Bins with >0 counts | Bins with >2000 counts | High rate bins dominated by noise | Noise dominated (total time) | Noise dominated (detector-on time) | Marked lightcurve |
|---|---|---|---|---|---|---|---|
| A | 7520 | 7181 | 1226 | 1226 | 16.30% | 17.07% | 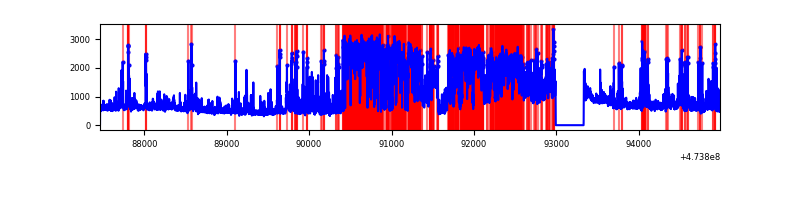 |
| B | 7520 | 7181 | 217 | 217 | 2.89% | 3.02% | 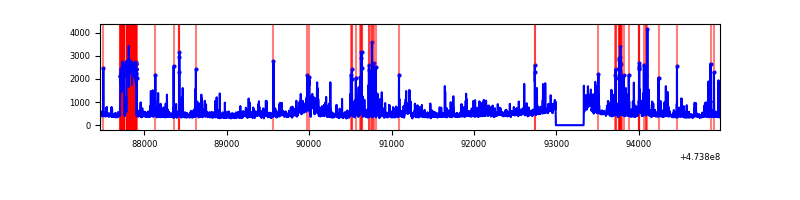 |
| C | 7520 | 7181 | 5152 | 5152 | 68.51% | 71.74% | 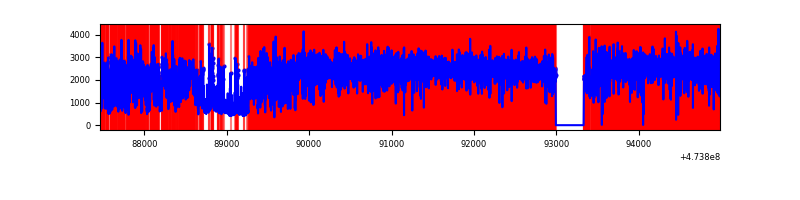 |
| D | 7520 | 7181 | 4305 | 4305 | 57.25% | 59.95% | 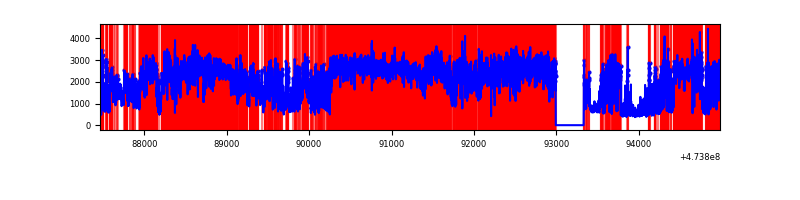 |
Top three noisy pixels from each quadrant. If the there are fewer than three noisy pixels in the level2.evt file, extra rows are filled as -1
| Pixel properties | Quadrant properties | ||||||
|---|---|---|---|---|---|---|---|
| Quadrant | DetID | PixID | Counts | Sigma | Mean | Median | Sigma |
| A | 0 | 98 | 2911021 | 16605.06 | 705 | 688 | 175.3 |
| A | 8 | 8 | 738952 | 4212.21 | 705 | 688 | 175.3 |
| A | 4 | 156 | 423028 | 2409.68 | 705 | 688 | 175.3 |
| B | 5 | 172 | 579831 | 3696.33 | 735 | 713 | 156.7 |
| B | 8 | 128 | 159386 | 1012.76 | 735 | 713 | 156.7 |
| B | 4 | 216 | 98790 | 625.99 | 735 | 713 | 156.7 |
| C | 15 | 213 | 8308061 | 77349.55 | 372 | 367 | 107.4 |
| C | 4 | 111 | 1562552 | 14544.86 | 372 | 367 | 107.4 |
| C | 15 | 230 | 1052842 | 9799.16 | 372 | 367 | 107.4 |
| D | 15 | 185 | 2664378 | 16625.38 | 541 | 520 | 160.2 |
| D | 15 | 168 | 1745695 | 10891.8 | 541 | 520 | 160.2 |
| D | 15 | 106 | 1542784 | 9625.41 | 541 | 520 | 160.2 |
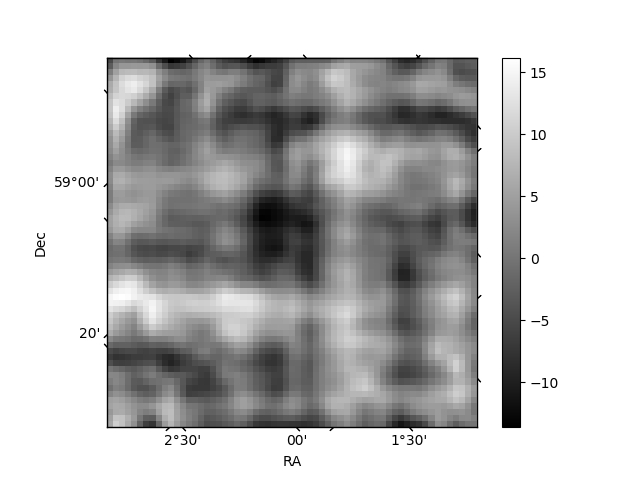
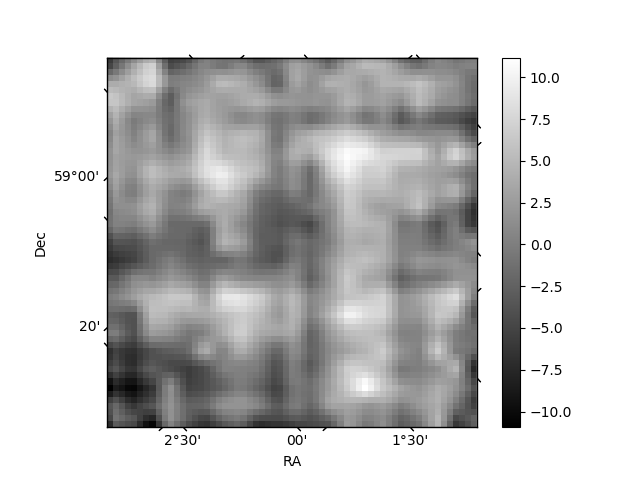
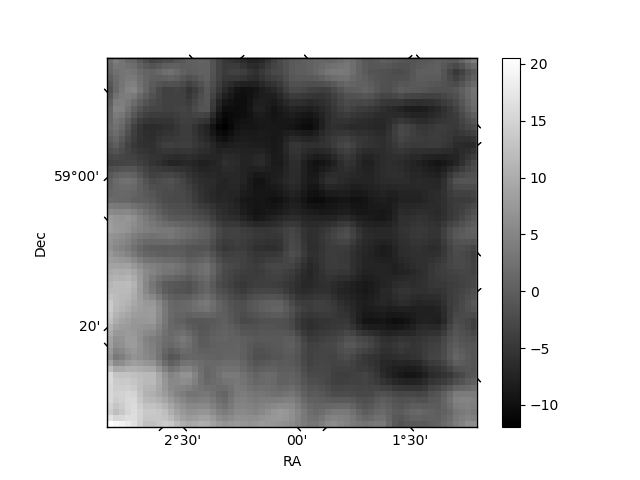
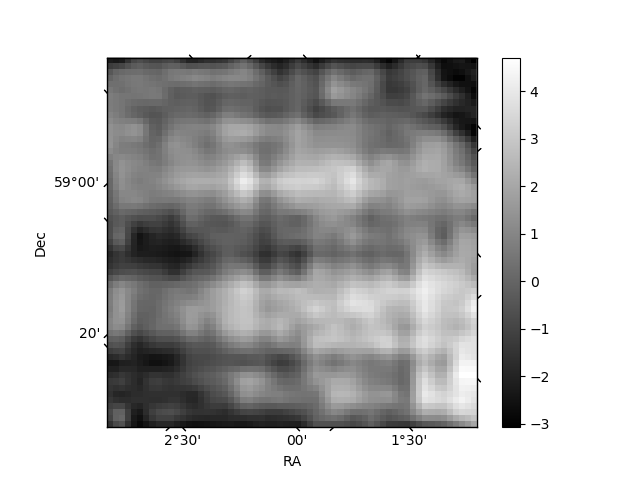
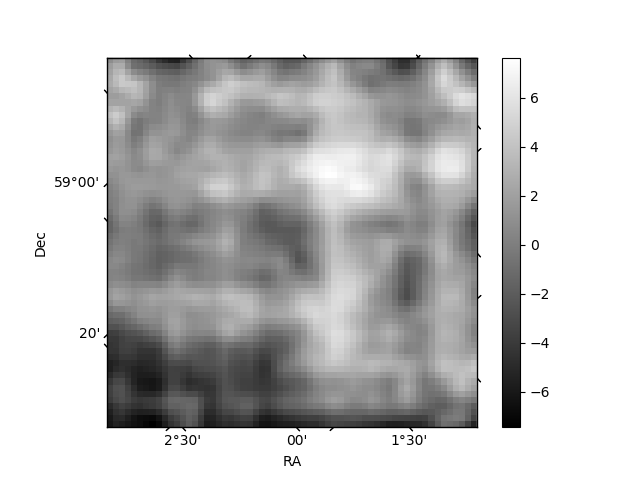
Histogram calculated using DETX and DETY for each event in the final _common_clean file
| Quadrant A | 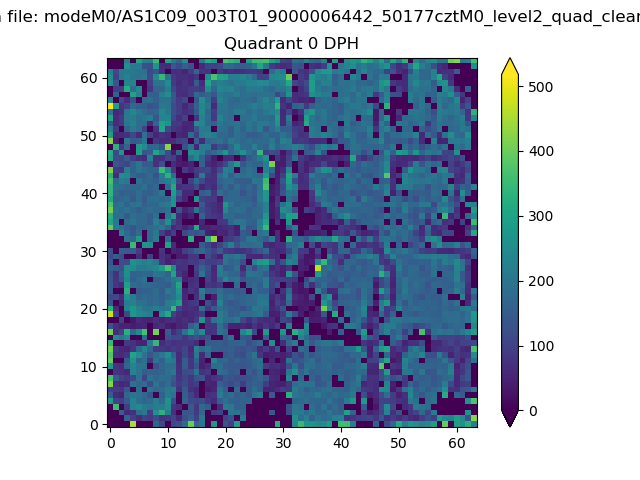 |
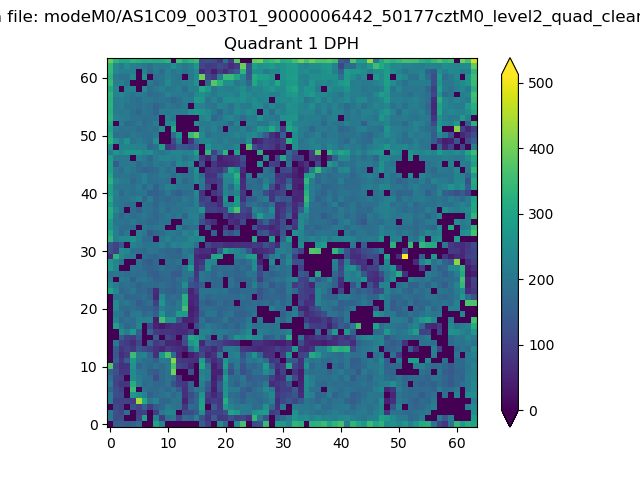 |
Quadrant B |
|---|---|---|---|
| Quadrant D | 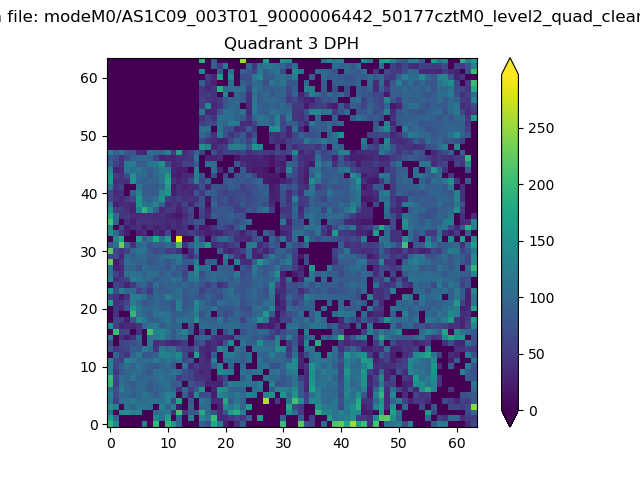 |
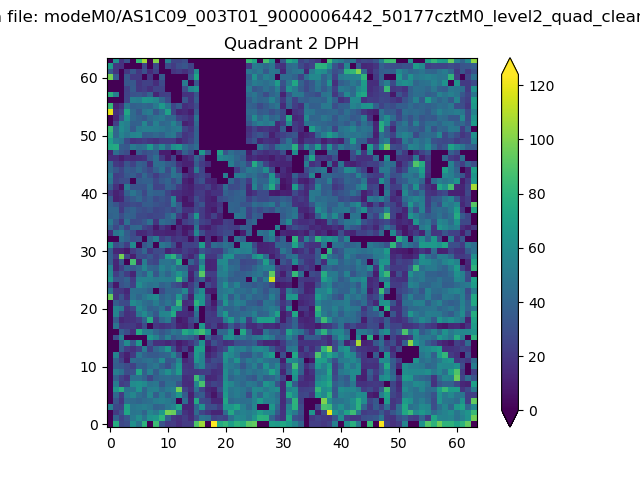 |
Quadrant C |
| Plot type | Count rate plots | Images |
|---|---|---|
| Comparison with Poisson distribution Blue bars denote a histogram of data divided into 1 sec bins. Red curve is a Poisson curve with rate = median count rate of data. |
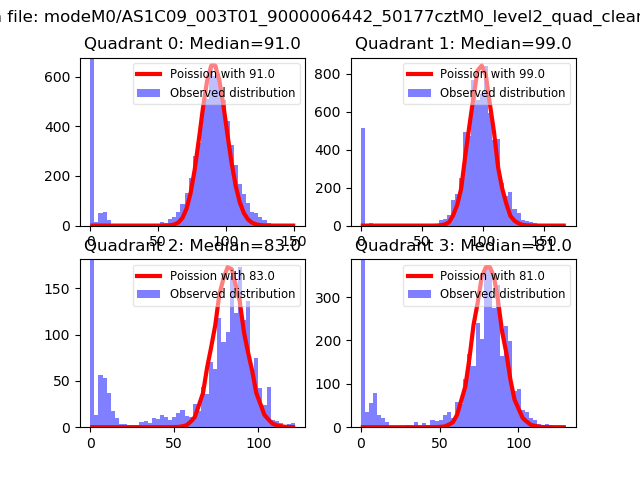 |
 |
| Quadrant-wise count rates Data is divided into 100 sec bins |
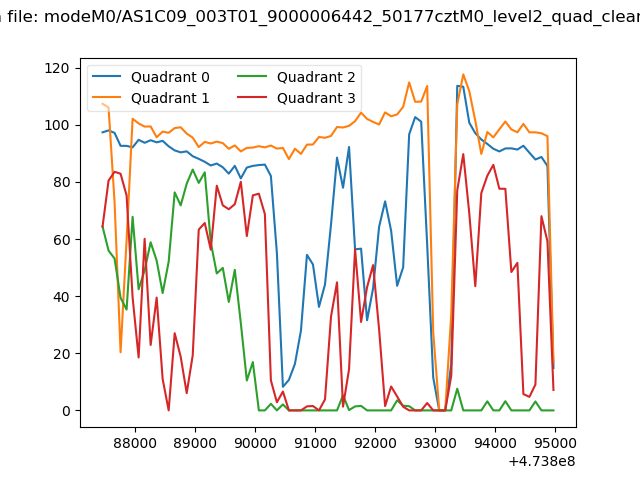 |
|
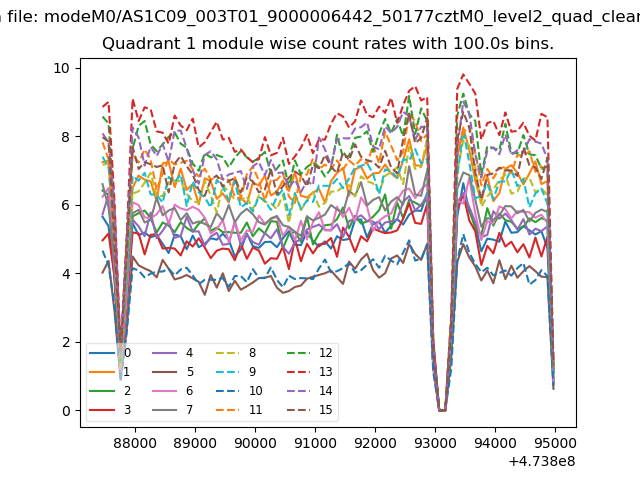
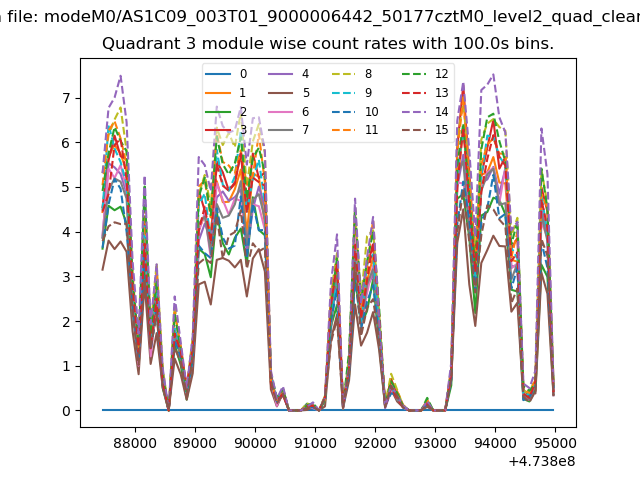
| Module-wise count rates for Quadrant A Data is divided into 100 sec bins |
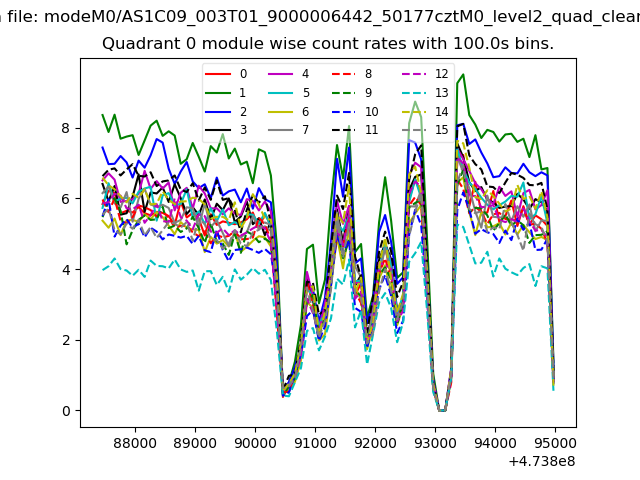 |
 |
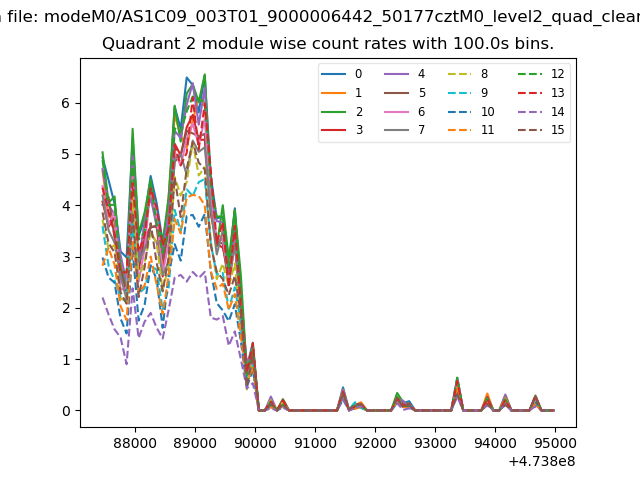
| Module-wise count rates for Quadrant B Data is divided into 100 sec bins |
 |
 |
| Module-wise count rates for Quadrant C Data is divided into 100 sec bins |
 |
 |
| Module-wise count rates for Quadrant D Data is divided into 100 sec bins |
 |
 |
| Parameter | Plot |
|---|---|
| CZT HV Monitor | 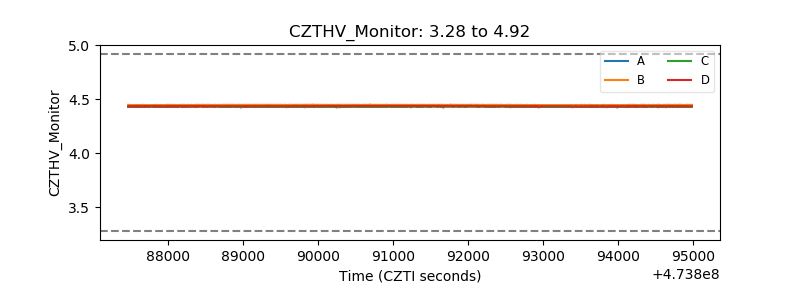 |
| D_VDD | 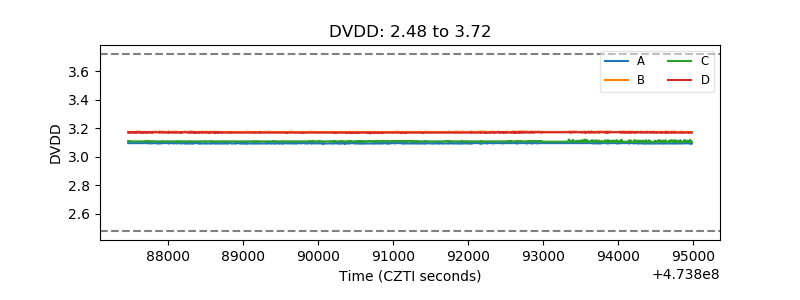 |
| Temperature 1 | 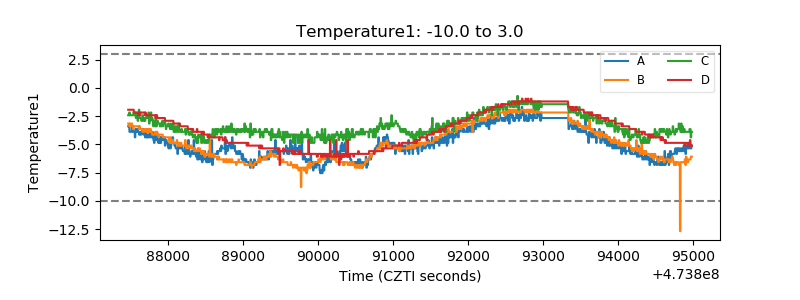 |
| Veto HV Monitor | 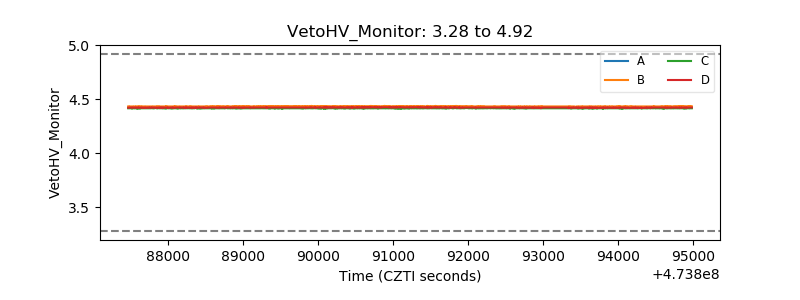 |
| Veto LLD | 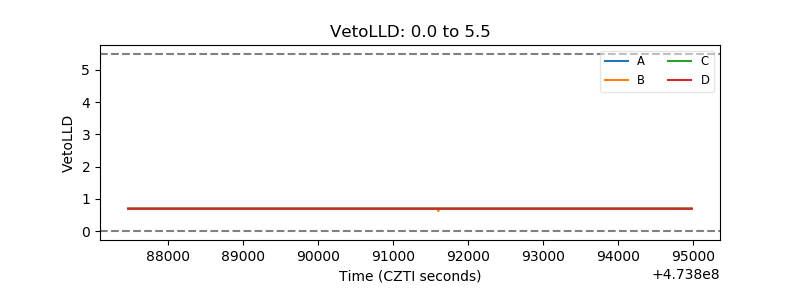 |
| Alpha Counter | 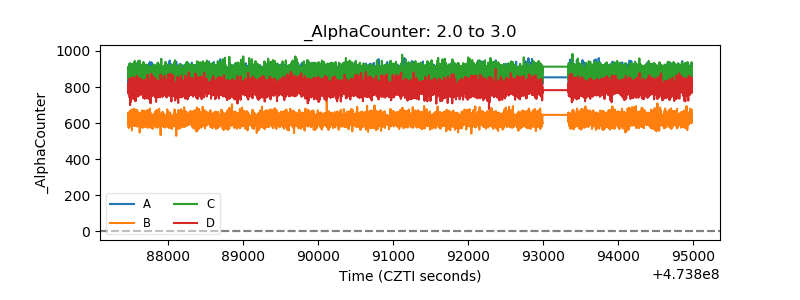 |
| _CPM_Rate | 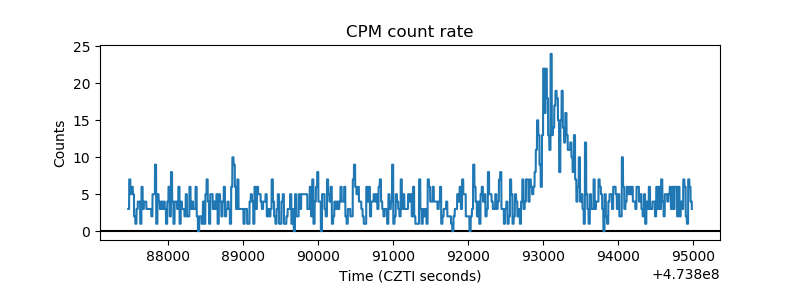 |
| CZT Counter | 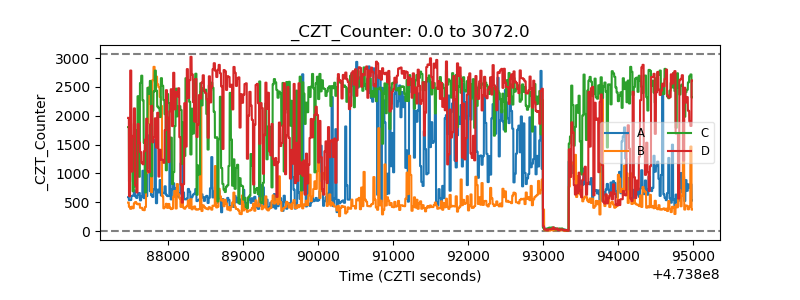 |
| +2.5 Volts monitor | 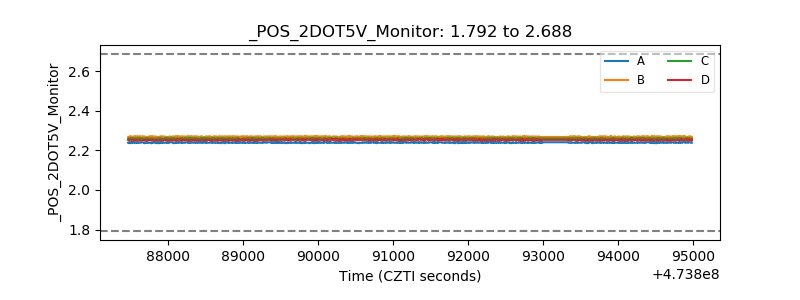 |
| +5 Volts monitor | 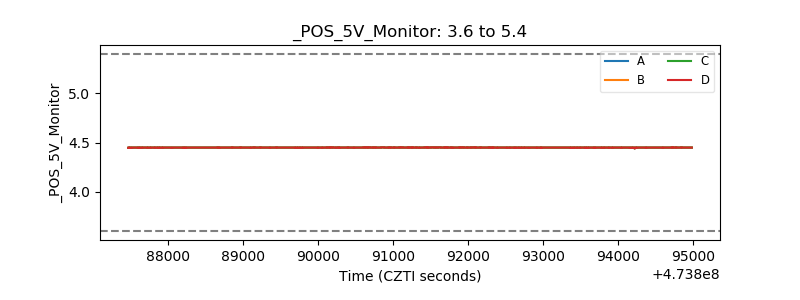 |
| _ROLL_ROT | 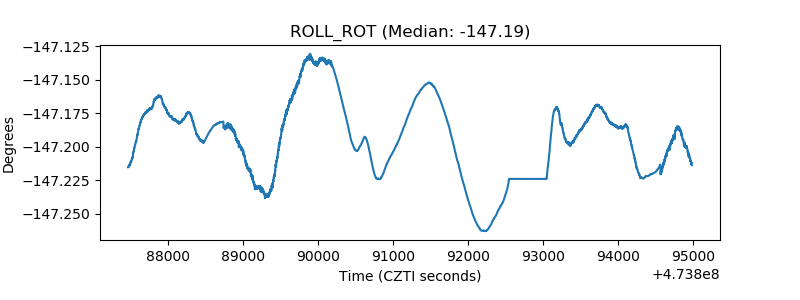 |
| _Roll_DEC | 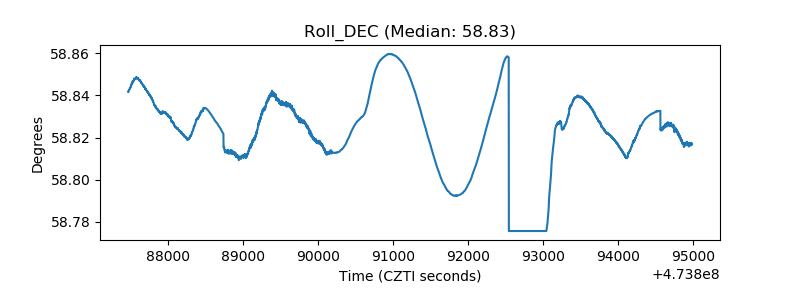 |
| _Roll_RA | 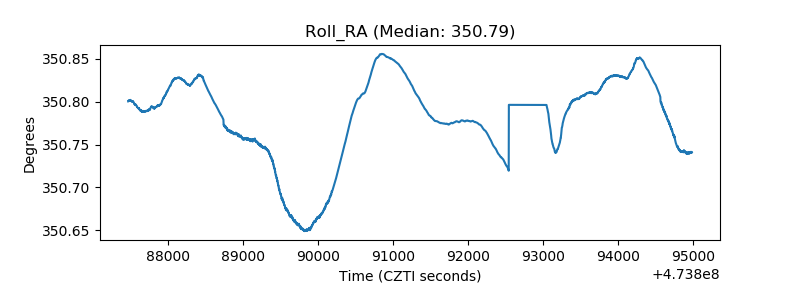 |
| Veto Counter | 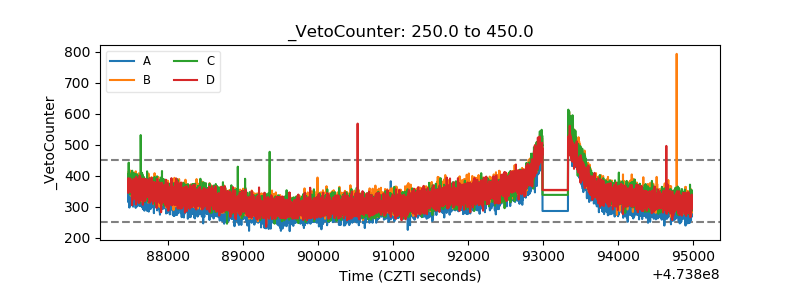 |