| Param | Original file | Final file |
|---|---|---|
| Filename | modeM0/AS1C09_003T01_9000006442_50178cztM0_level2.fits | modeM0/AS1C09_003T01_9000006442_50178cztM0_level2_quad_clean.evt |
| Size (bytes) | 1,401,007,680 | 70,130,880 |
| Size | 1.3 GB | 66.9 MB |
| Events in quadrant A | 10,521,231 | 547,814 |
| Events in quadrant B | 4,662,584 | 776,984 |
| Events in quadrant C | 18,254,419 | 47,841 |
| Events in quadrant D | 17,811,907 | 199,054 |
| Mode M9 | |||
|---|---|---|---|
| Quadrant | BADHDUFLAG | Total packets | Discarded packets |
| A | 0 | 2 | 0 |
| B | 0 | 3 | 0 |
| C | 0 | 3 | 0 |
| D | 0 | 3 | 0 |
| Mode M0 | |||
|---|---|---|---|
| Quadrant | BADHDUFLAG | Total packets | Discarded packets |
| A | 0 | 36839 | 1 |
| B | 0 | 19425 | 1 |
| C | 0 | 59574 | 1 |
| D | 0 | 58336 | 5 |
| Mode SS | |||
|---|---|---|---|
| Quadrant | BADHDUFLAG | Total packets | Discarded packets |
| A | 0 | 162 | 0 |
| B | 0 | 162 | 0 |
| C | 0 | 162 | 0 |
| D | 0 | 162 | 0 |
| Quadrant | Total seconds | Saturated seconds | Saturation percentage |
|---|---|---|---|
| A | 7924 | 2296 | 28.975265% |
| B | 7924 | 311 | 3.924785% |
| C | 7924 | 7507 | 94.737506% |
| D | 7923 | 5938 | 74.946359% |
Noise dominated data is calculated using 1-second bins in cleaned event files. If a bin has >2000 counts, and if more than 50% of those come from <1% of pixels, then it is considered to be noise-dominated and hence unusable.
| Quadrant | # 1 sec bins | Bins with >0 counts | Bins with >2000 counts | High rate bins dominated by noise | Noise dominated (total time) | Noise dominated (detector-on time) | Marked lightcurve |
|---|---|---|---|---|---|---|---|
| A | 7924 | 7924 | 2152 | 2152 | 27.16% | 27.16% | 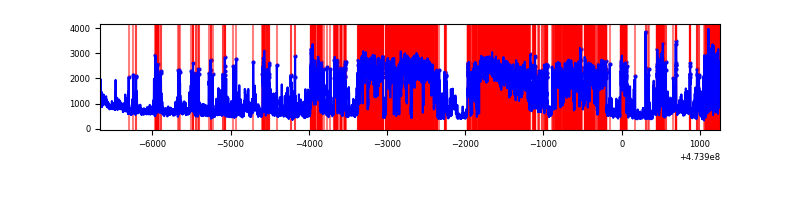 |
| B | 7924 | 7924 | 213 | 213 | 2.69% | 2.69% | 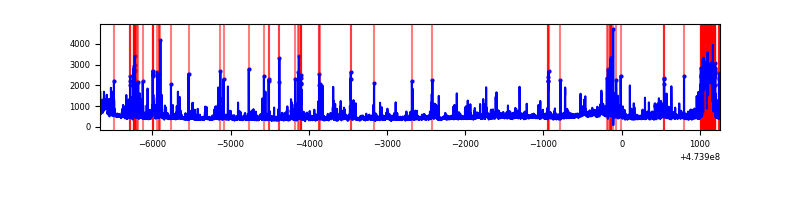 |
| C | 7924 | 7924 | 5870 | 5870 | 74.08% | 74.08% | 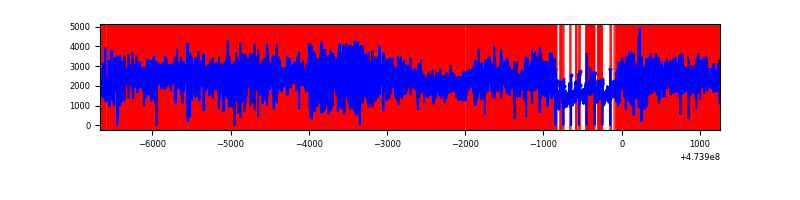 |
| D | 7923 | 7923 | 5993 | 5993 | 75.64% | 75.64% | 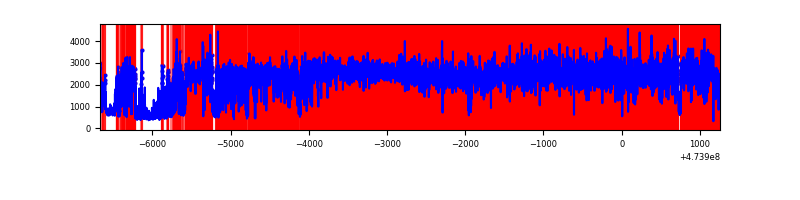 |
Top three noisy pixels from each quadrant. If the there are fewer than three noisy pixels in the level2.evt file, extra rows are filled as -1
| Pixel properties | Quadrant properties | ||||||
|---|---|---|---|---|---|---|---|
| Quadrant | DetID | PixID | Counts | Sigma | Mean | Median | Sigma |
| A | 0 | 98 | 4925075 | 25728.88 | 760 | 740 | 191.4 |
| A | 8 | 8 | 616837 | 3219.01 | 760 | 740 | 191.4 |
| A | 4 | 156 | 530866 | 2769.82 | 760 | 740 | 191.4 |
| B | 3 | 249 | 422790 | 2424.71 | 817 | 788 | 174.0 |
| B | 8 | 128 | 201317 | 1152.18 | 817 | 788 | 174.0 |
| B | 10 | 247 | 95011 | 541.38 | 817 | 788 | 174.0 |
| C | 4 | 111 | 6194043 | 71034.03 | 283 | 278 | 87.2 |
| C | 15 | 213 | 4874850 | 55904.69 | 283 | 278 | 87.2 |
| C | 15 | 214 | 938647 | 10761.81 | 283 | 278 | 87.2 |
| D | 15 | 168 | 5781879 | 34525.93 | 552 | 529 | 167.4 |
| D | 15 | 185 | 2507033 | 14968.71 | 552 | 529 | 167.4 |
| D | 15 | 106 | 1631431 | 9739.66 | 552 | 529 | 167.4 |
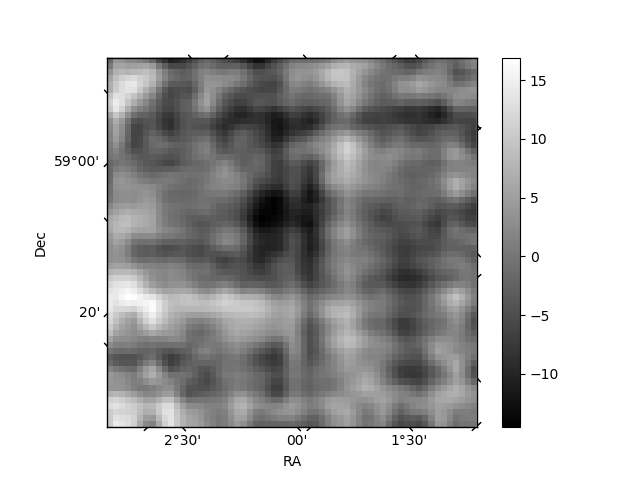
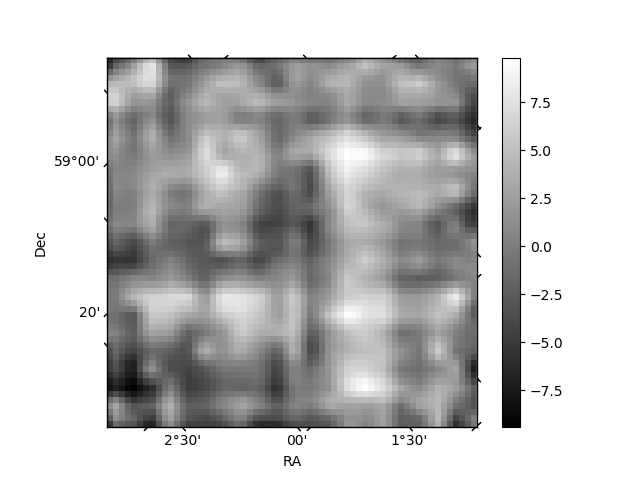
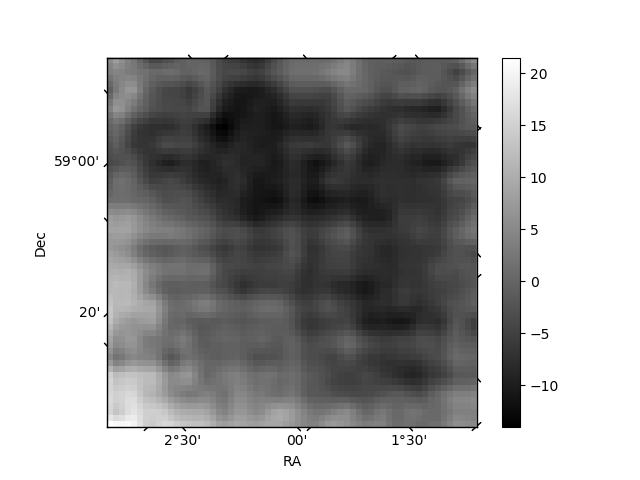
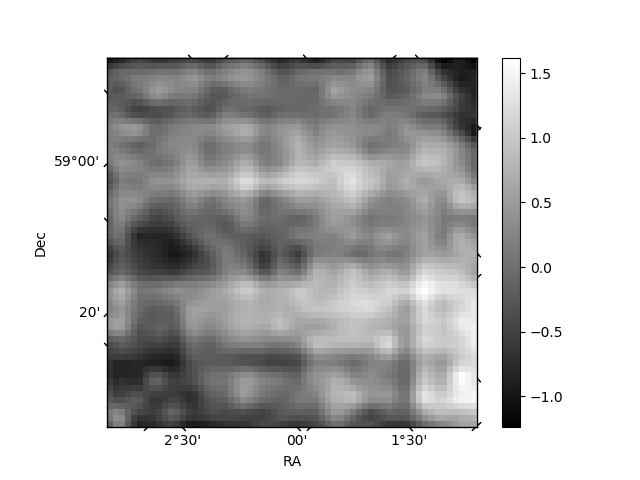
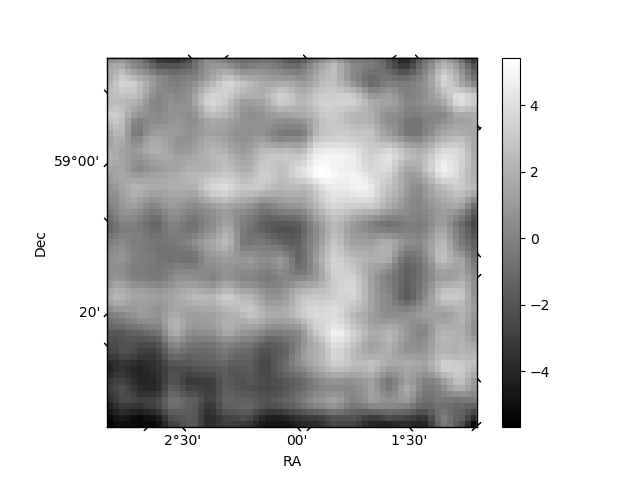
Histogram calculated using DETX and DETY for each event in the final _common_clean file
| Quadrant A | 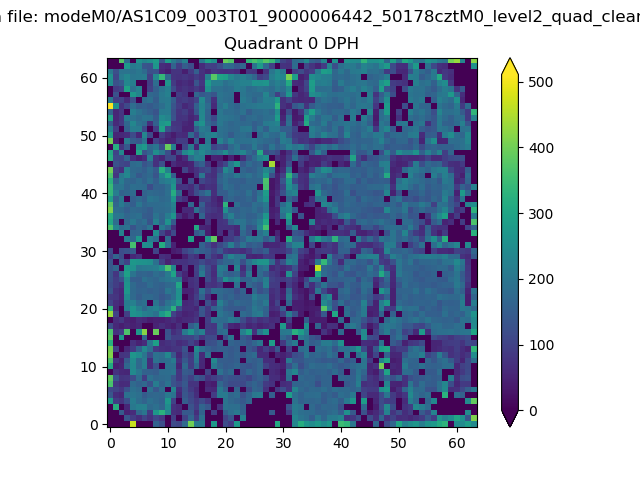 |
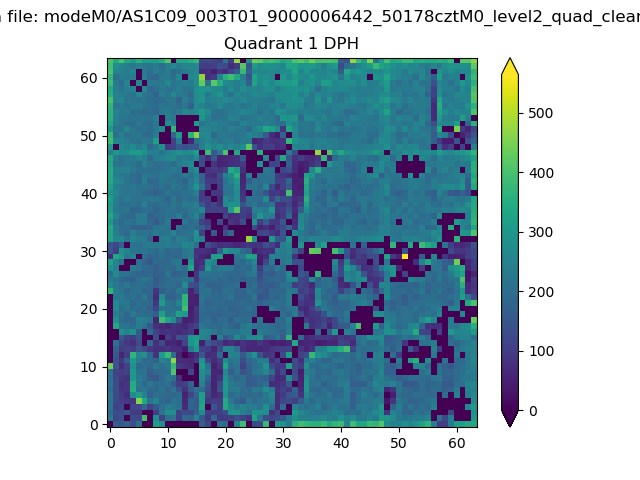 |
Quadrant B |
|---|---|---|---|
| Quadrant D | 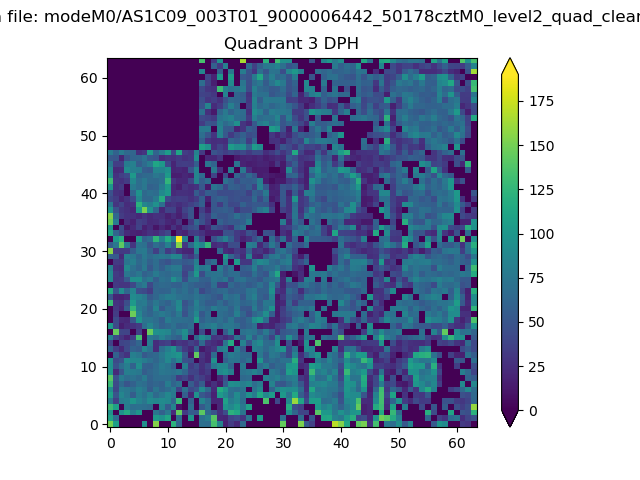 |
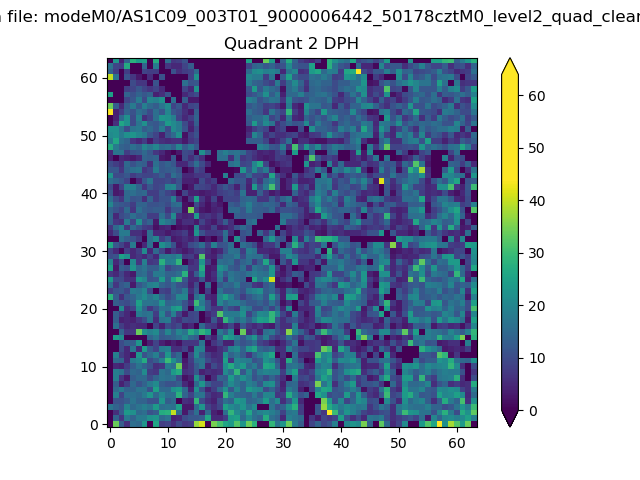 |
Quadrant C |
| Plot type | Count rate plots | Images |
|---|---|---|
| Comparison with Poisson distribution Blue bars denote a histogram of data divided into 1 sec bins. Red curve is a Poisson curve with rate = median count rate of data. |
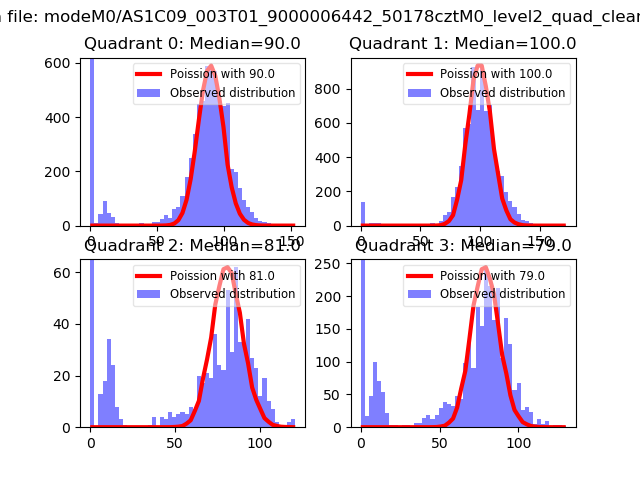 |
 |
| Quadrant-wise count rates Data is divided into 100 sec bins |
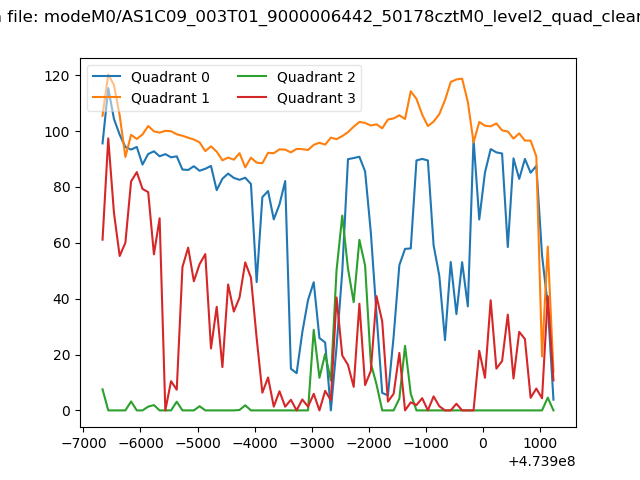 |
|
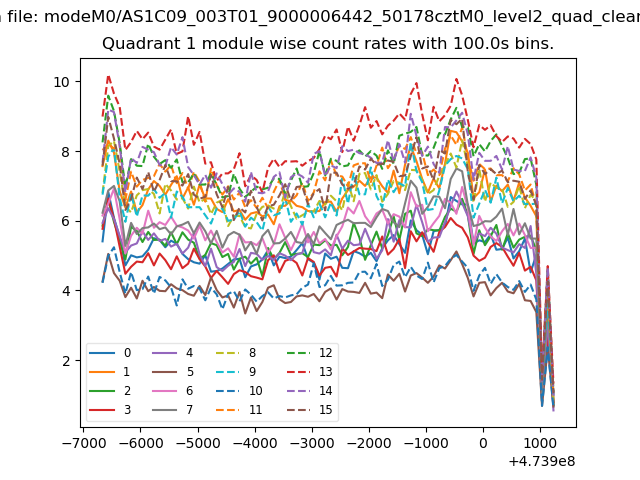
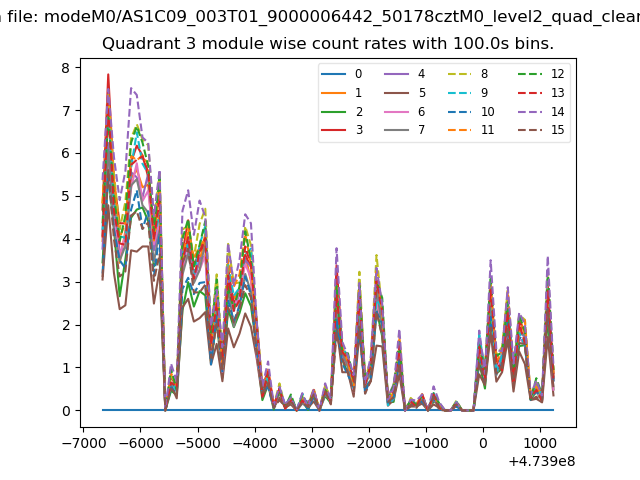
| Module-wise count rates for Quadrant A Data is divided into 100 sec bins |
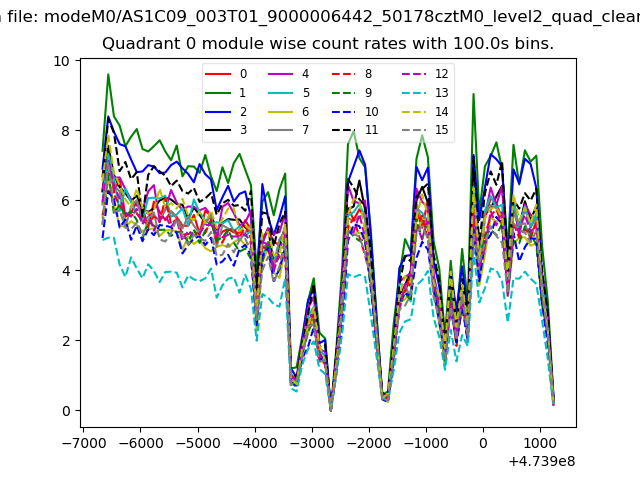 |
 |
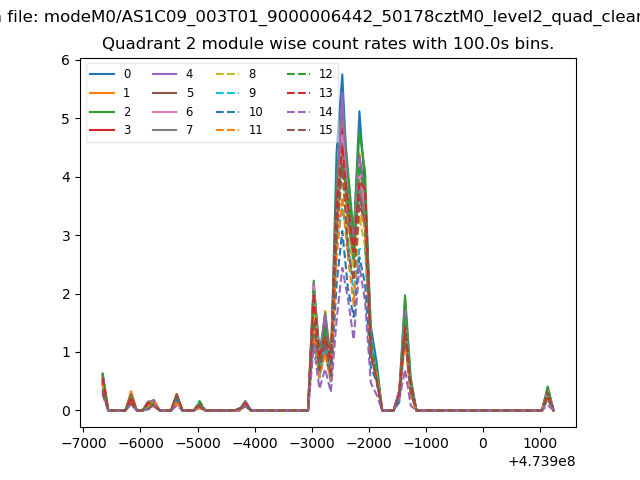
| Module-wise count rates for Quadrant B Data is divided into 100 sec bins |
 |
 |
| Module-wise count rates for Quadrant C Data is divided into 100 sec bins |
 |
 |
| Module-wise count rates for Quadrant D Data is divided into 100 sec bins |
 |
 |
| Parameter | Plot |
|---|---|
| CZT HV Monitor | 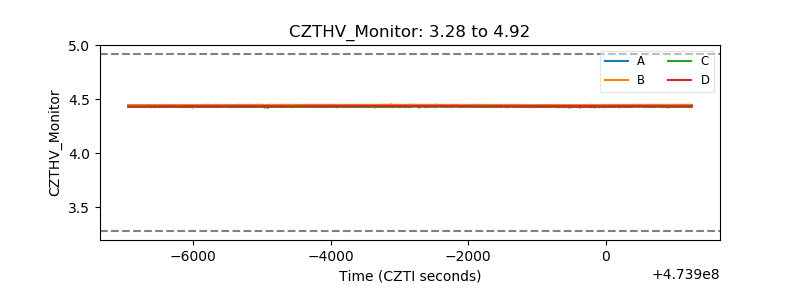 |
| D_VDD | 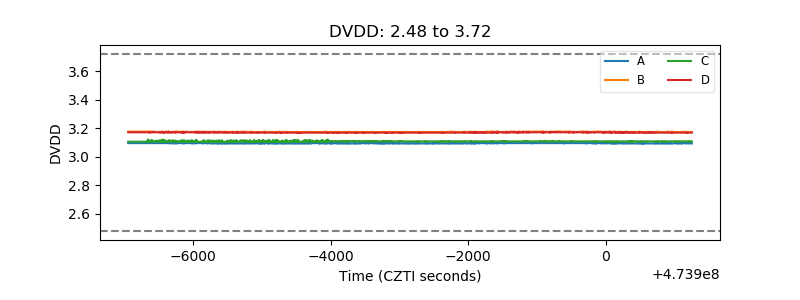 |
| Temperature 1 | 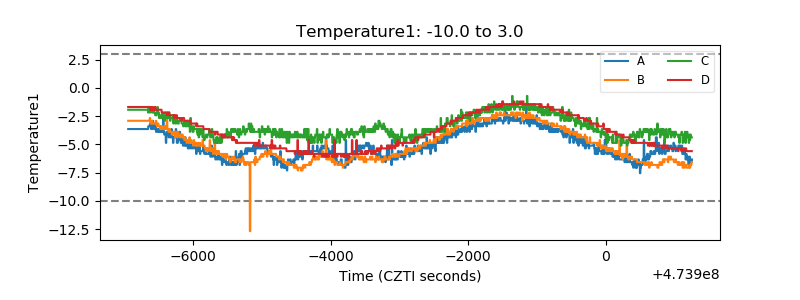 |
| Veto HV Monitor | 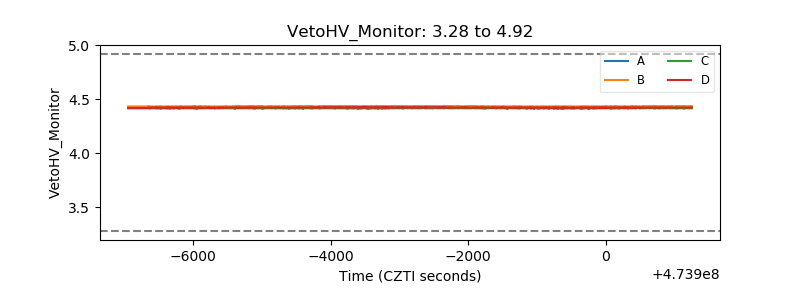 |
| Veto LLD | 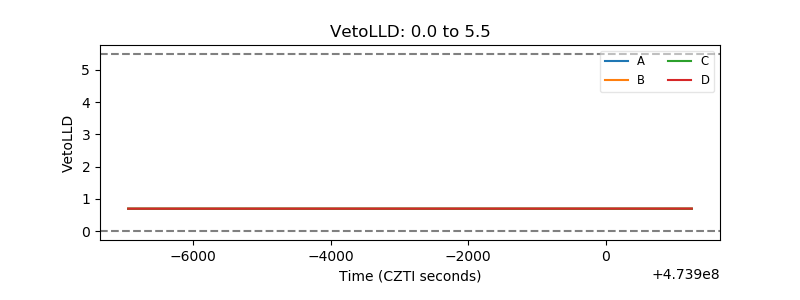 |
| Alpha Counter | 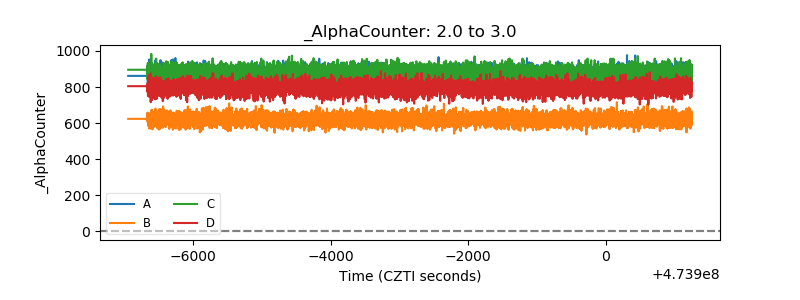 |
| _CPM_Rate | 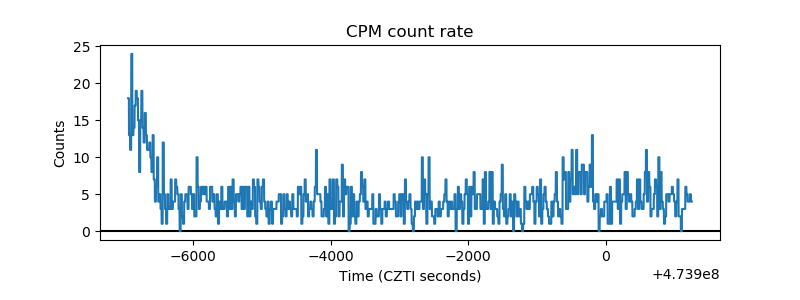 |
| CZT Counter | 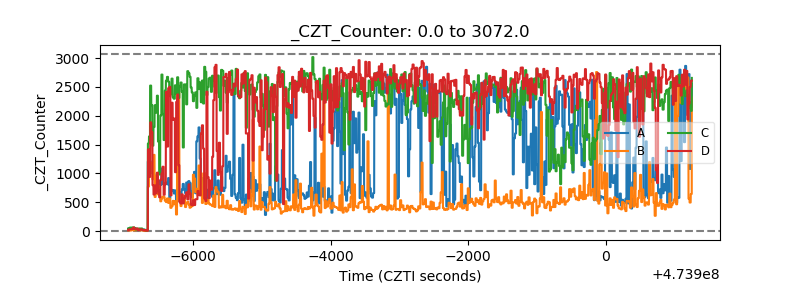 |
| +2.5 Volts monitor | 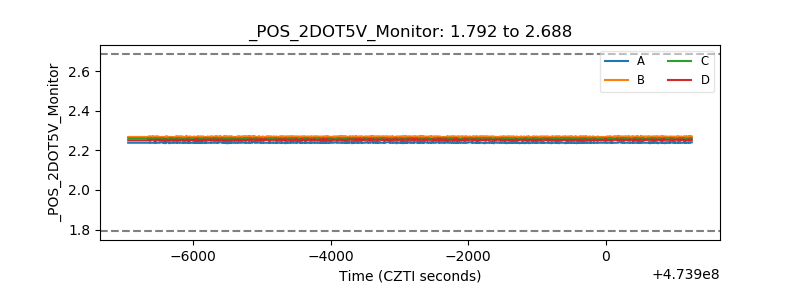 |
| +5 Volts monitor | 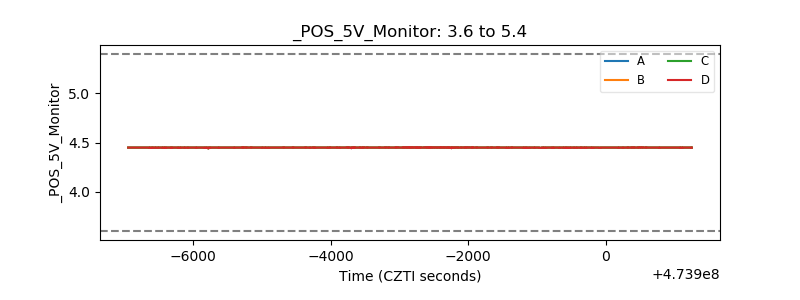 |
| _ROLL_ROT | 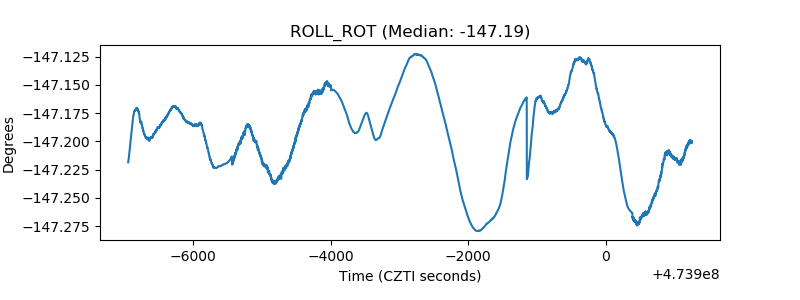 |
| _Roll_DEC | 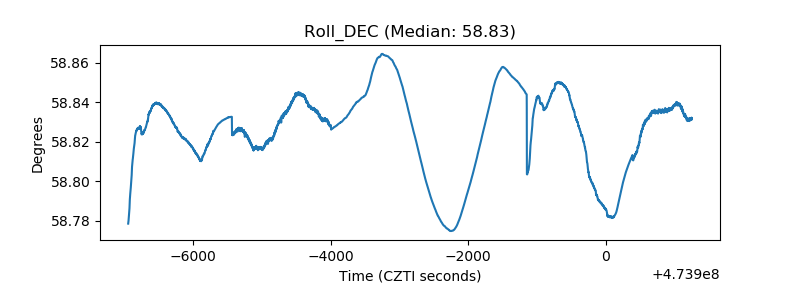 |
| _Roll_RA | 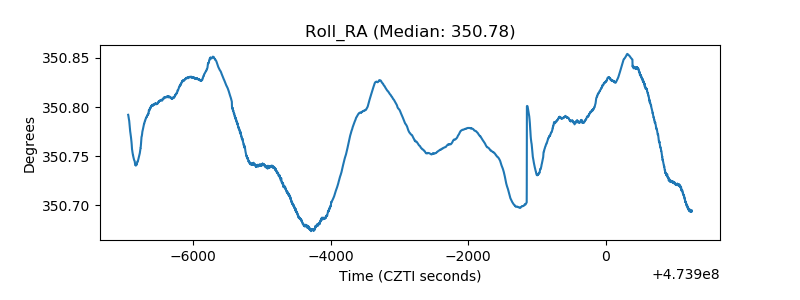 |
| Veto Counter | 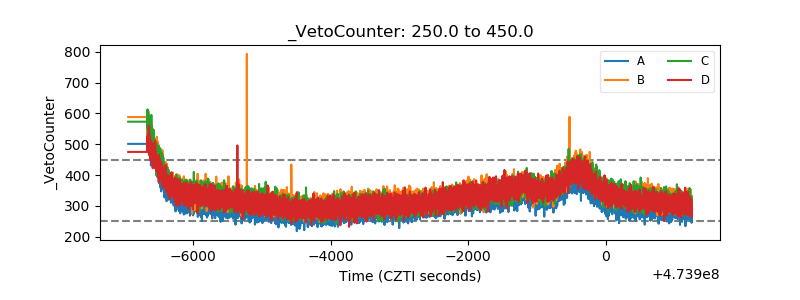 |