| Param | Original file | Final file |
|---|---|---|
| Filename | modeM0/AS1C09_003T01_9000006442_50179cztM0_level2.fits | modeM0/AS1C09_003T01_9000006442_50179cztM0_level2_quad_clean.evt |
| Size (bytes) | 1,527,261,120 | 52,505,280 |
| Size | 1.4 GB | 50.1 MB |
| Events in quadrant A | 15,002,987 | 274,222 |
| Events in quadrant B | 5,217,813 | 687,125 |
| Events in quadrant C | 17,045,787 | 42,280 |
| Events in quadrant D | 18,697,134 | 68,937 |
| Mode M0 | |||
|---|---|---|---|
| Quadrant | BADHDUFLAG | Total packets | Discarded packets |
| A | 0 | 49654 | 0 |
| B | 0 | 20698 | 0 |
| C | 0 | 55668 | 0 |
| D | 0 | 60633 | 0 |
| Mode SS | |||
|---|---|---|---|
| Quadrant | BADHDUFLAG | Total packets | Discarded packets |
| A | 0 | 148 | 0 |
| B | 0 | 148 | 0 |
| C | 0 | 148 | 0 |
| D | 0 | 148 | 0 |
| Quadrant | Total seconds | Saturated seconds | Saturation percentage |
|---|---|---|---|
| A | 7424 | 4846 | 65.274784% |
| B | 7425 | 533 | 7.178451% |
| C | 7425 | 7052 | 94.976431% |
| D | 7424 | 6775 | 91.258082% |
Noise dominated data is calculated using 1-second bins in cleaned event files. If a bin has >2000 counts, and if more than 50% of those come from <1% of pixels, then it is considered to be noise-dominated and hence unusable.
| Quadrant | # 1 sec bins | Bins with >0 counts | Bins with >2000 counts | High rate bins dominated by noise | Noise dominated (total time) | Noise dominated (detector-on time) | Marked lightcurve |
|---|---|---|---|---|---|---|---|
| A | 7424 | 7424 | 4721 | 4721 | 63.59% | 63.59% | 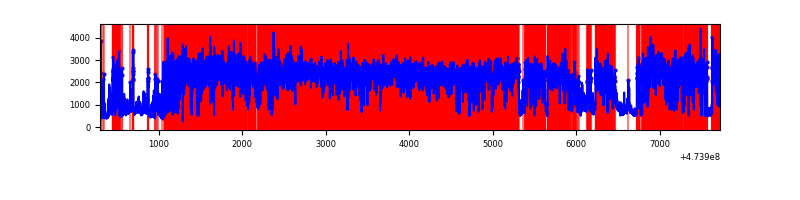 |
| B | 7425 | 7425 | 409 | 409 | 5.51% | 5.51% | 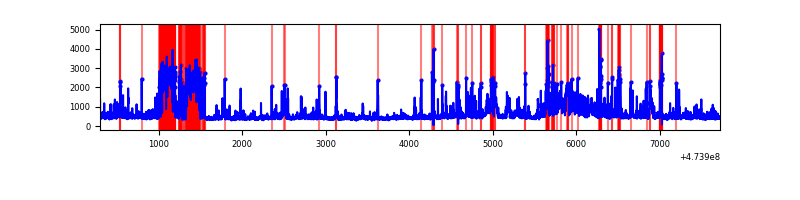 |
| C | 7425 | 7425 | 5593 | 5593 | 75.33% | 75.33% | 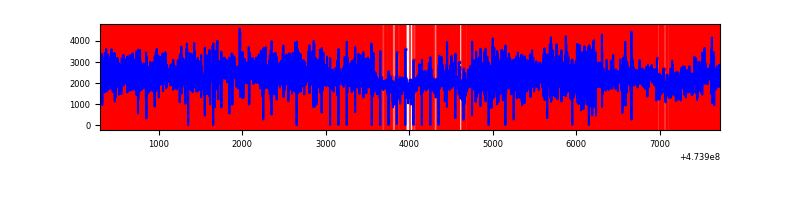 |
| D | 7424 | 7424 | 6508 | 6508 | 87.66% | 87.66% | 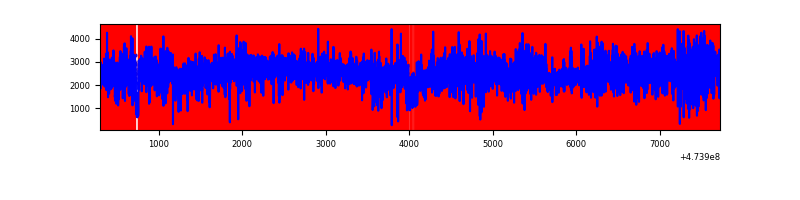 |
Top three noisy pixels from each quadrant. If the there are fewer than three noisy pixels in the level2.evt file, extra rows are filled as -1
| Pixel properties | Quadrant properties | ||||||
|---|---|---|---|---|---|---|---|
| Quadrant | DetID | PixID | Counts | Sigma | Mean | Median | Sigma |
| A | 0 | 98 | 10502189 | 70618.62 | 581 | 565 | 148.7 |
| A | 6 | 250 | 547698 | 3679.22 | 581 | 565 | 148.7 |
| A | 8 | 8 | 376412 | 2527.4 | 581 | 565 | 148.7 |
| B | 3 | 249 | 907410 | 5824.73 | 737 | 715 | 155.7 |
| B | 5 | 185 | 352193 | 2257.94 | 737 | 715 | 155.7 |
| B | 8 | 128 | 240316 | 1539.23 | 737 | 715 | 155.7 |
| C | 4 | 111 | 8414364 | 107175.01 | 246 | 242 | 78.5 |
| C | 15 | 197 | 1424652 | 18143.45 | 246 | 242 | 78.5 |
| C | 15 | 213 | 1128433 | 14370.35 | 246 | 242 | 78.5 |
| D | 15 | 168 | 6237251 | 53658.25 | 382 | 367 | 116.2 |
| D | 7 | 61 | 1749904 | 15051.92 | 382 | 367 | 116.2 |
| D | 15 | 106 | 1701365 | 14634.32 | 382 | 367 | 116.2 |
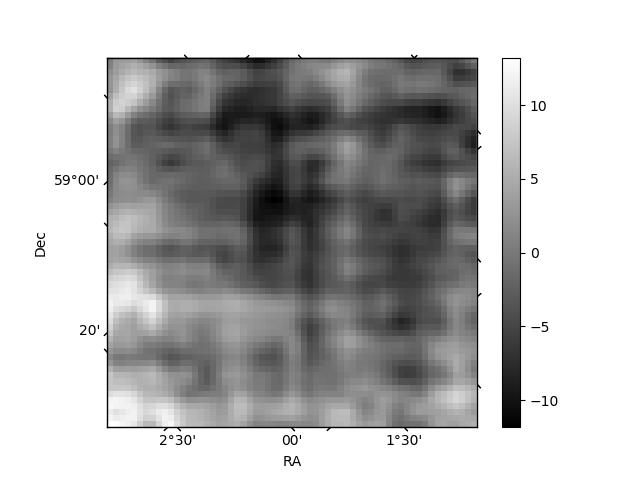
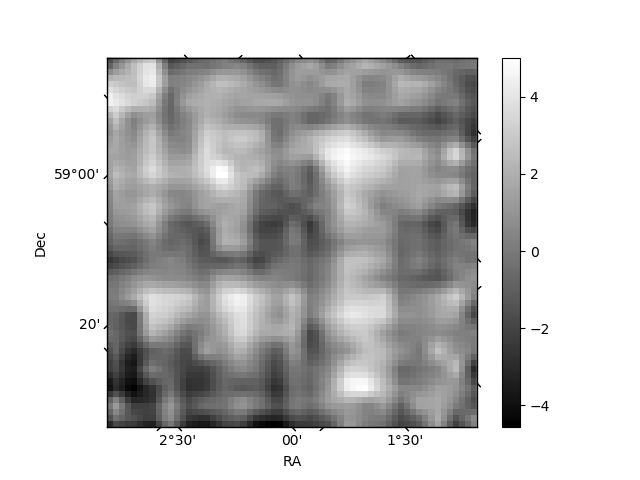
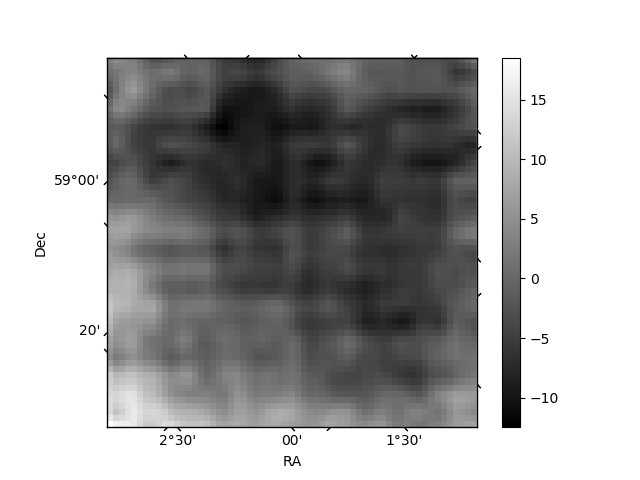
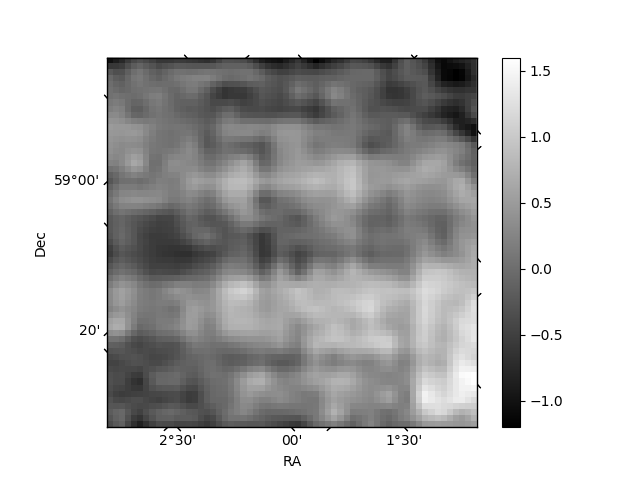
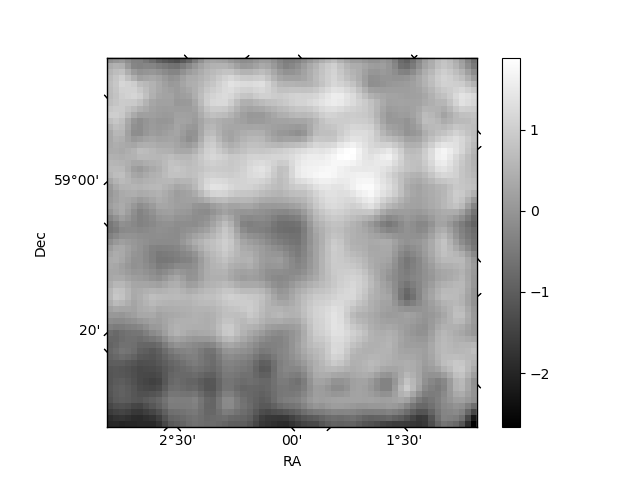
Histogram calculated using DETX and DETY for each event in the final _common_clean file
| Quadrant A | 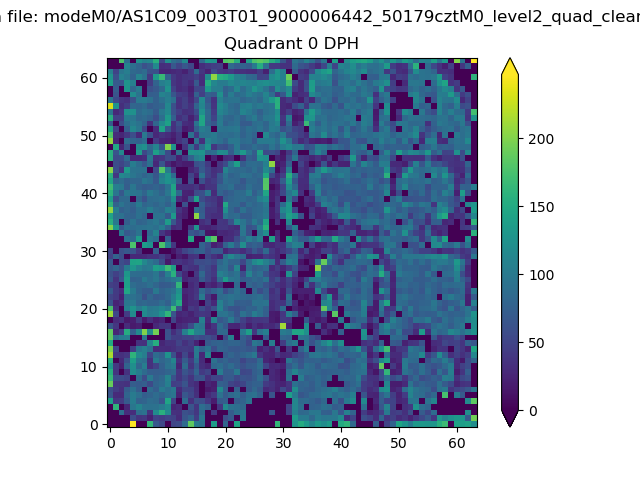 |
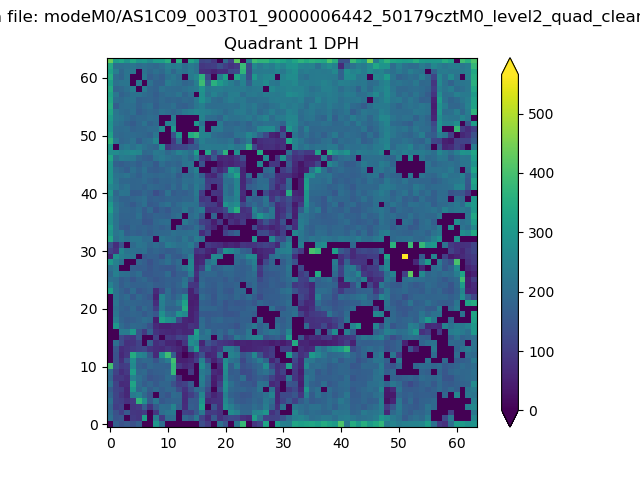 |
Quadrant B |
|---|---|---|---|
| Quadrant D | 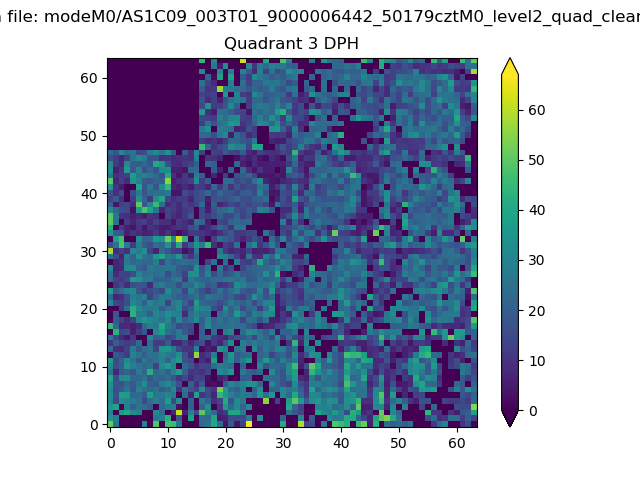 |
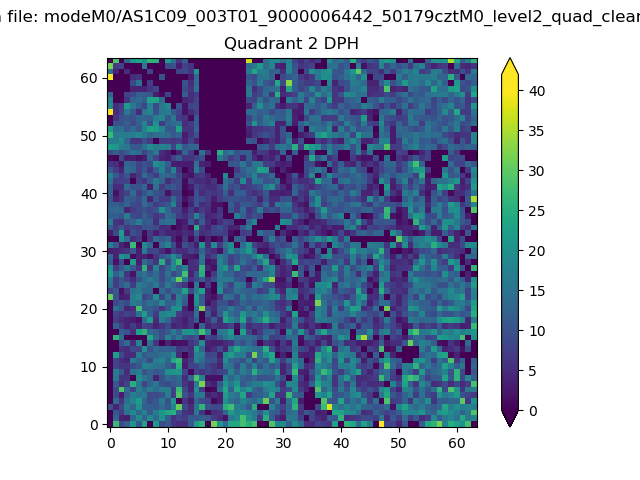 |
Quadrant C |
| Plot type | Count rate plots | Images |
|---|---|---|
| Comparison with Poisson distribution Blue bars denote a histogram of data divided into 1 sec bins. Red curve is a Poisson curve with rate = median count rate of data. |
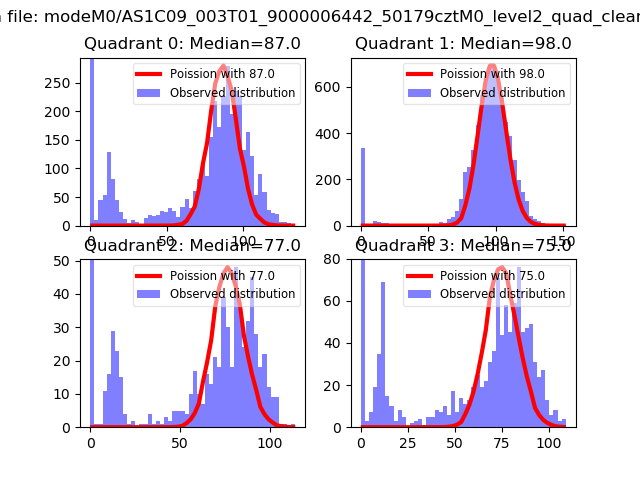 |
 |
| Quadrant-wise count rates Data is divided into 100 sec bins |
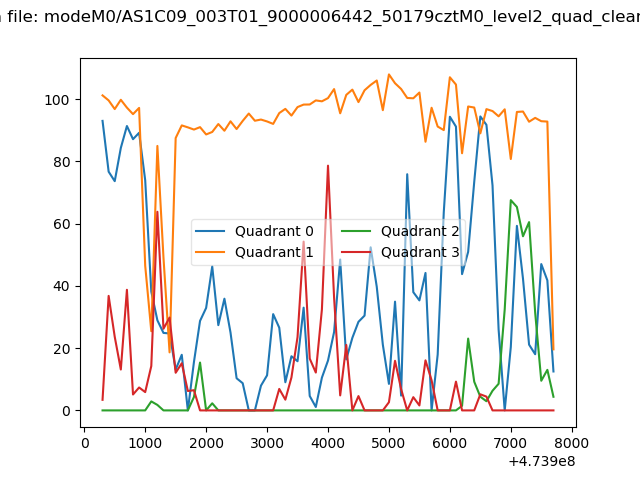 |
|
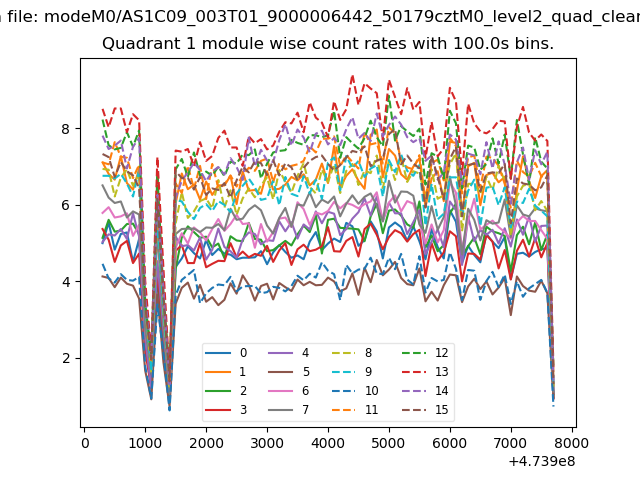
| Module-wise count rates for Quadrant A Data is divided into 100 sec bins |
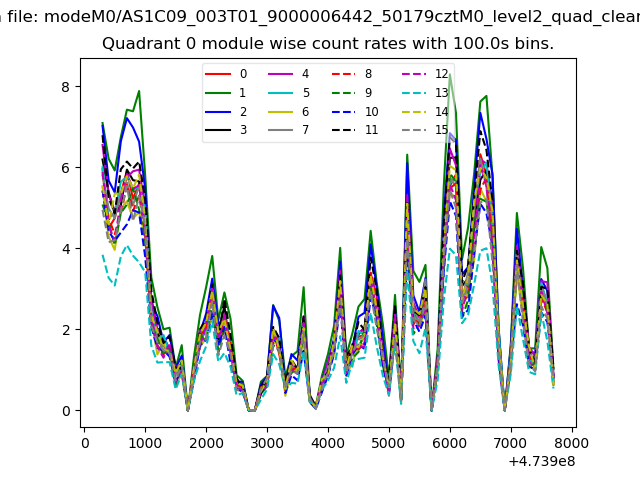 |
 |
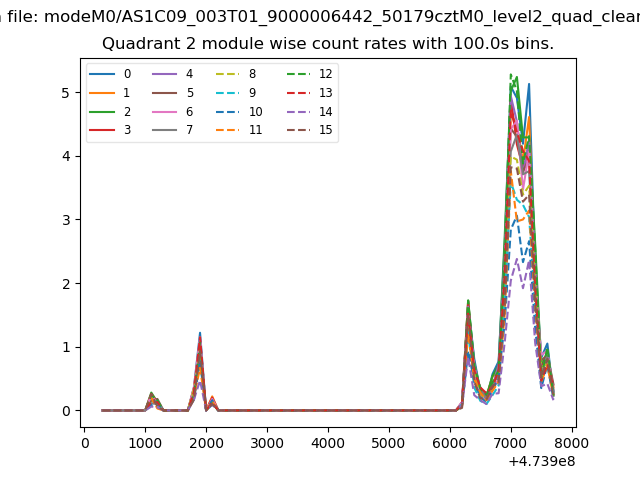
| Module-wise count rates for Quadrant B Data is divided into 100 sec bins |
 |
 |
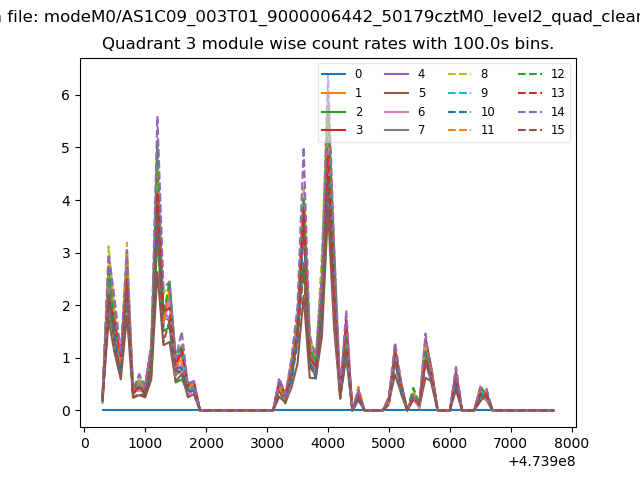
| Module-wise count rates for Quadrant C Data is divided into 100 sec bins |
 |
 |
| Module-wise count rates for Quadrant D Data is divided into 100 sec bins |
 |
 |
| Parameter | Plot |
|---|---|
| CZT HV Monitor |  |
| D_VDD | 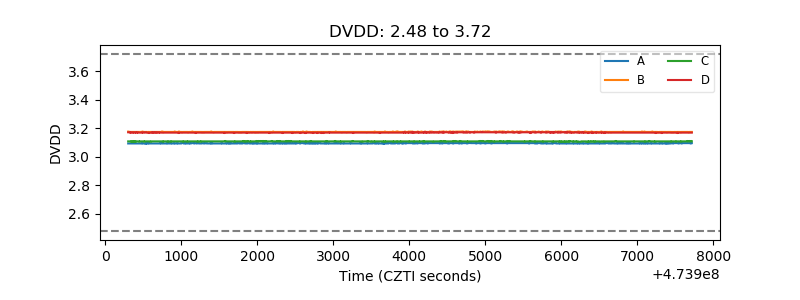 |
| Temperature 1 | 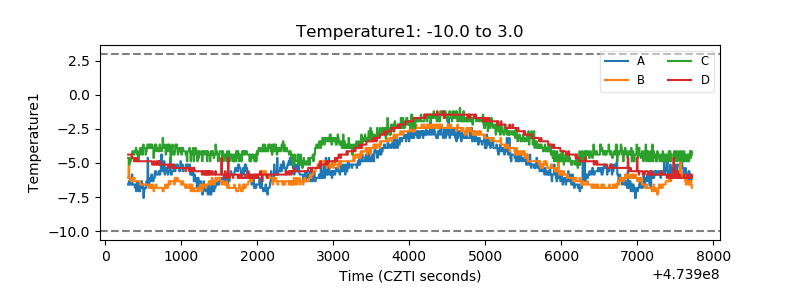 |
| Veto HV Monitor | 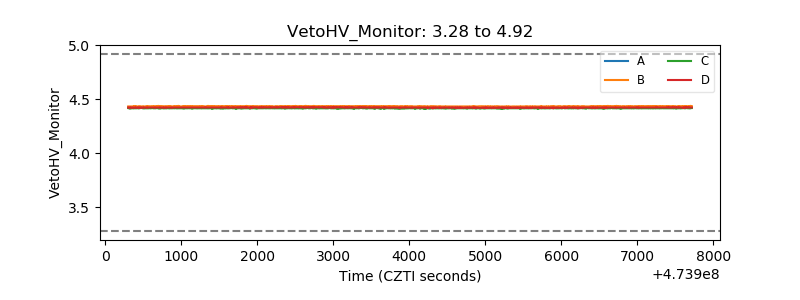 |
| Veto LLD | 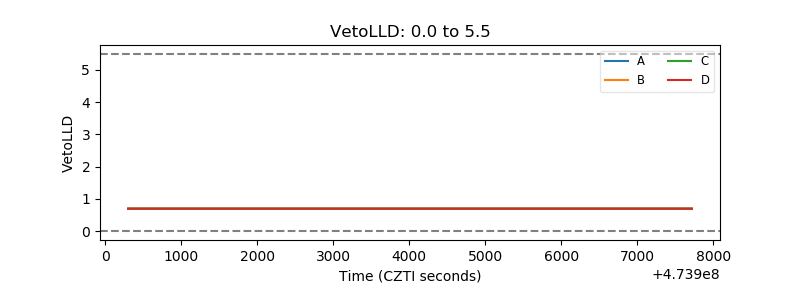 |
| Alpha Counter | 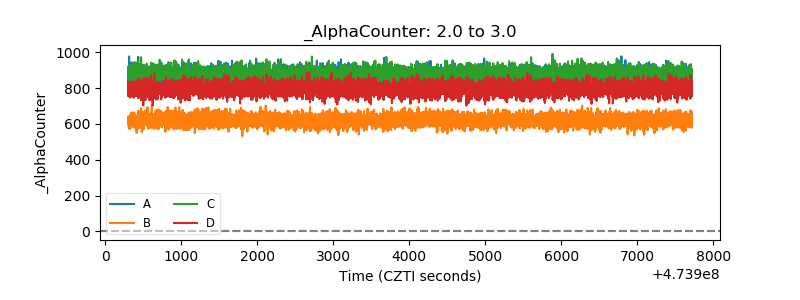 |
| _CPM_Rate | 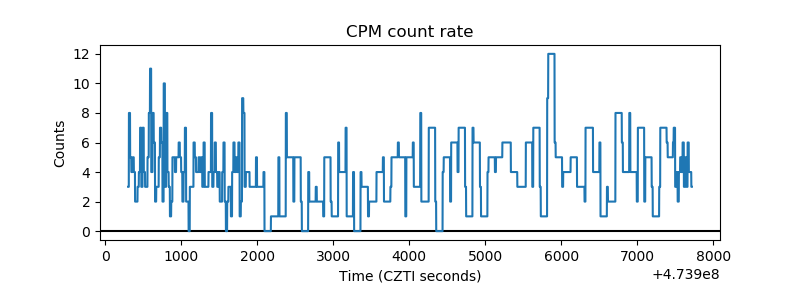 |
| CZT Counter | 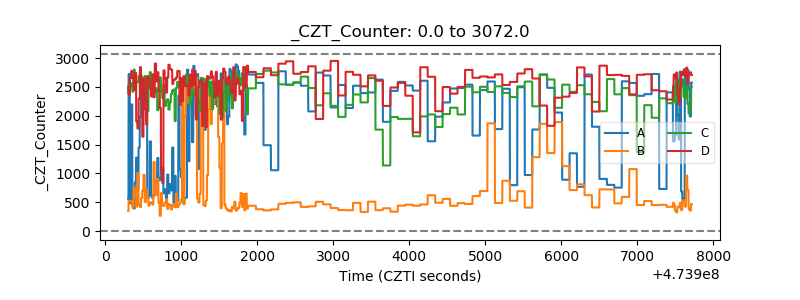 |
| +2.5 Volts monitor |  |
| +5 Volts monitor | 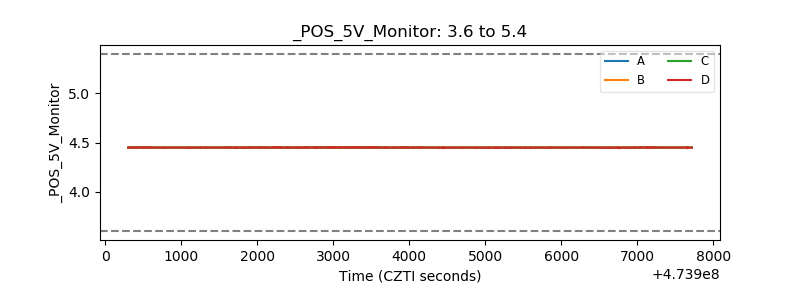 |
| _ROLL_ROT | 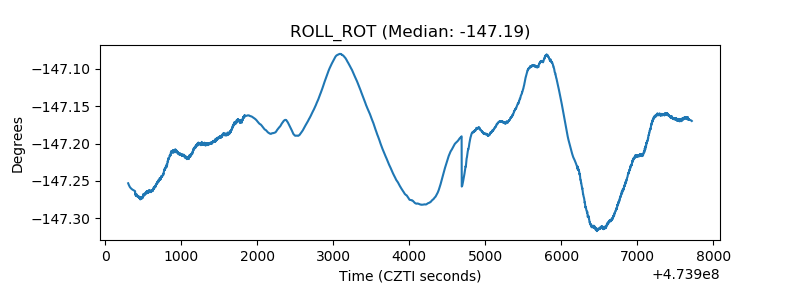 |
| _Roll_DEC | 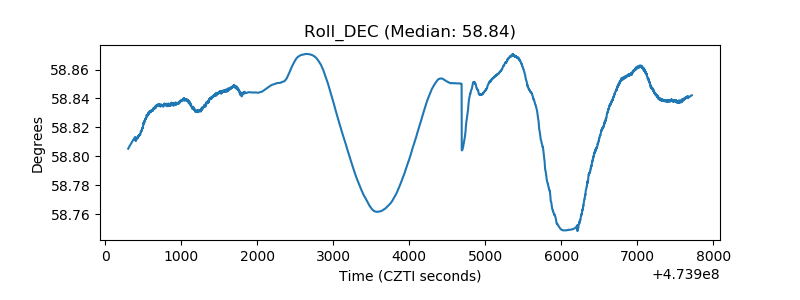 |
| _Roll_RA | 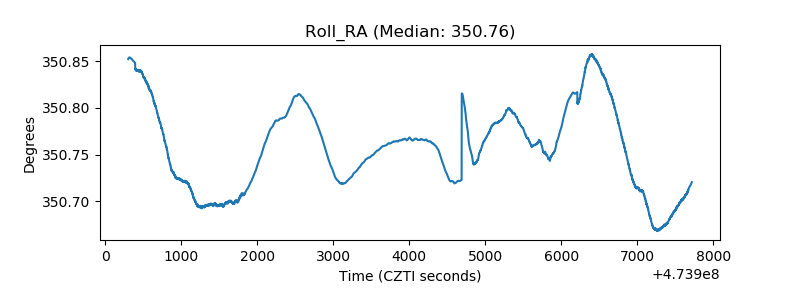 |
| Veto Counter | 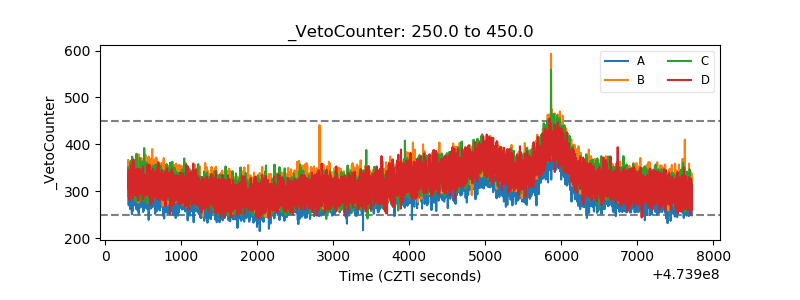 |