| Param | Original file | Final file |
|---|---|---|
| Filename | modeM0/AS1C09_003T01_9000006442_50182cztM0_level2.fits | modeM0/AS1C09_003T01_9000006442_50182cztM0_level2_quad_clean.evt |
| Size (bytes) | 3,998,229,120 | 124,755,840 |
| Size | 3.7 GB | 119.0 MB |
| Events in quadrant A | 44,180,707 | 312,775 |
| Events in quadrant B | 15,101,256 | 1,683,249 |
| Events in quadrant C | 43,783,242 | 122,758 |
| Events in quadrant D | 43,500,830 | 362,679 |
| Mode M9 | |||
|---|---|---|---|
| Quadrant | BADHDUFLAG | Total packets | Discarded packets |
| A | 0 | 9 | 0 |
| B | 0 | 9 | 0 |
| C | 0 | 9 | 0 |
| D | 0 | 9 | 0 |
| Mode M0 | |||
|---|---|---|---|
| Quadrant | BADHDUFLAG | Total packets | Discarded packets |
| A | 0 | 143844 | 2 |
| B | 0 | 57990 | 2 |
| C | 0 | 142854 | 2 |
| D | 0 | 142072 | 2 |
| Mode SS | |||
|---|---|---|---|
| Quadrant | BADHDUFLAG | Total packets | Discarded packets |
| A | 0 | 382 | 0 |
| B | 0 | 382 | 0 |
| C | 0 | 382 | 0 |
| D | 0 | 382 | 0 |
| Quadrant | Total seconds | Saturated seconds | Saturation percentage |
|---|---|---|---|
| A | 18781 | 15708 | 83.637719% |
| B | 18782 | 1989 | 10.589927% |
| C | 18781 | 17600 | 93.711730% |
| D | 18781 | 14832 | 78.973431% |
Noise dominated data is calculated using 1-second bins in cleaned event files. If a bin has >2000 counts, and if more than 50% of those come from <1% of pixels, then it is considered to be noise-dominated and hence unusable.
| Quadrant | # 1 sec bins | Bins with >0 counts | Bins with >2000 counts | High rate bins dominated by noise | Noise dominated (total time) | Noise dominated (detector-on time) | Marked lightcurve |
|---|---|---|---|---|---|---|---|
| A | 19661 | 18784 | 14449 | 14449 | 73.49% | 76.92% | 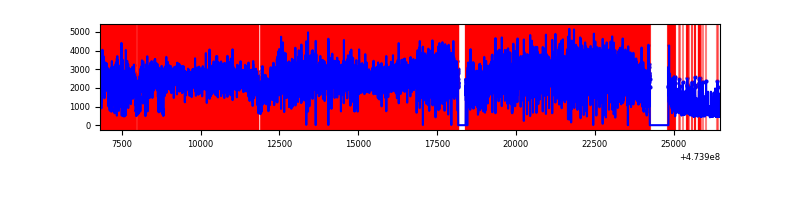 |
| B | 19662 | 18785 | 1211 | 1211 | 6.16% | 6.45% | 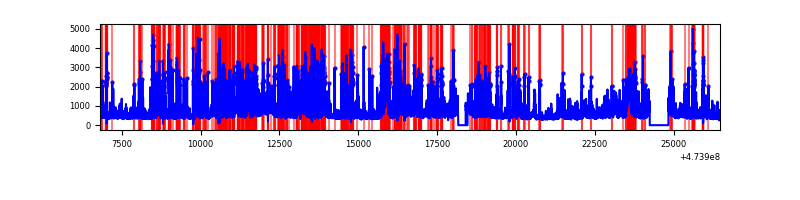 |
| C | 19661 | 18784 | 14666 | 14666 | 74.59% | 78.08% | 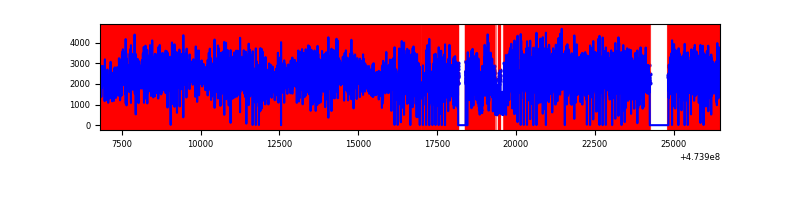 |
| D | 19661 | 18783 | 13930 | 13930 | 70.85% | 74.16% | 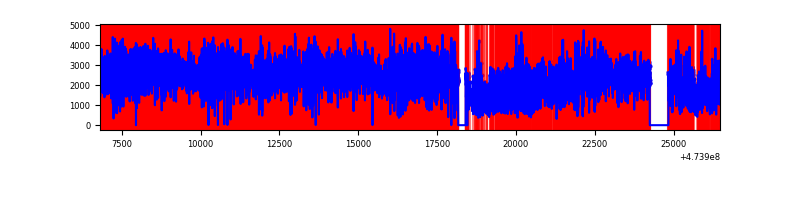 |
Top three noisy pixels from each quadrant. If the there are fewer than three noisy pixels in the level2.evt file, extra rows are filled as -1
| Pixel properties | Quadrant properties | ||||||
|---|---|---|---|---|---|---|---|
| Quadrant | DetID | PixID | Counts | Sigma | Mean | Median | Sigma |
| A | 6 | 250 | 19203016 | 70664.16 | 1066 | 1037 | 271.7 |
| A | 0 | 98 | 16691376 | 61421.21 | 1066 | 1037 | 271.7 |
| A | 8 | 8 | 802669 | 2950.04 | 1066 | 1037 | 271.7 |
| B | 4 | 206 | 3184482 | 8037.81 | 1876 | 1812 | 396.0 |
| B | 3 | 249 | 2317471 | 5848.18 | 1876 | 1812 | 396.0 |
| B | 8 | 128 | 209944 | 525.63 | 1876 | 1812 | 396.0 |
| C | 4 | 111 | 10784708 | 50560.69 | 702 | 693 | 213.3 |
| C | 15 | 197 | 6899611 | 32345.47 | 702 | 693 | 213.3 |
| C | 15 | 213 | 6690206 | 31363.68 | 702 | 693 | 213.3 |
| D | 15 | 168 | 10719918 | 32899.77 | 1048 | 1008 | 325.8 |
| D | 7 | 61 | 6596570 | 20243.89 | 1048 | 1008 | 325.8 |
| D | 12 | 6 | 3857595 | 11837.1 | 1048 | 1008 | 325.8 |
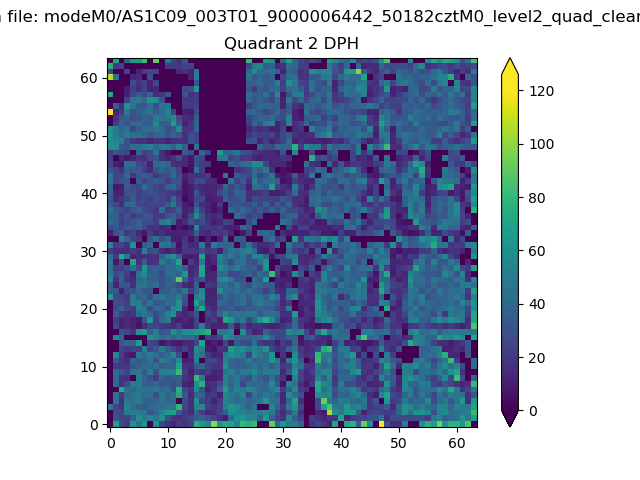
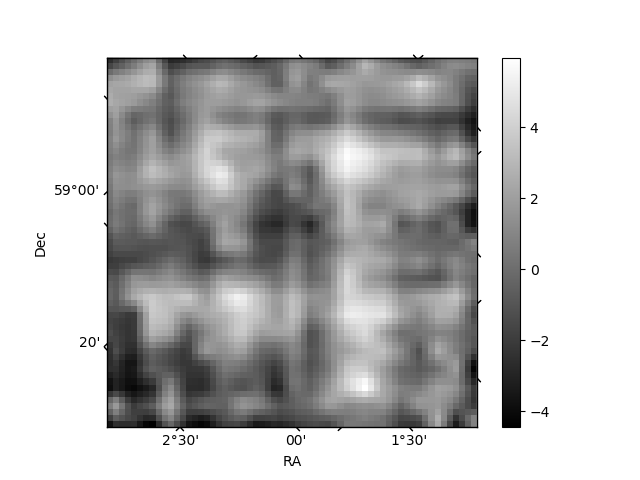
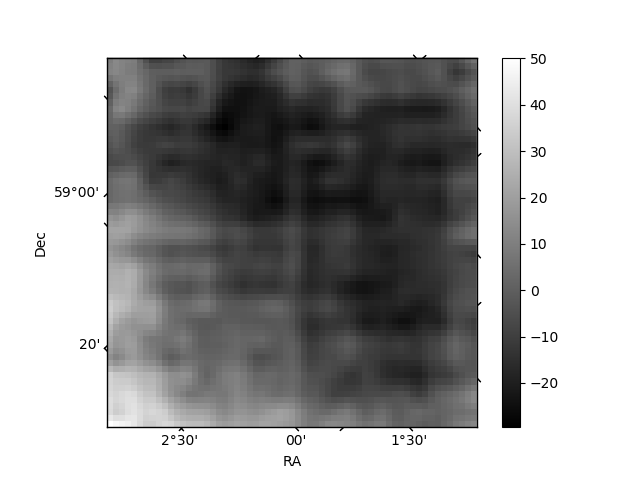
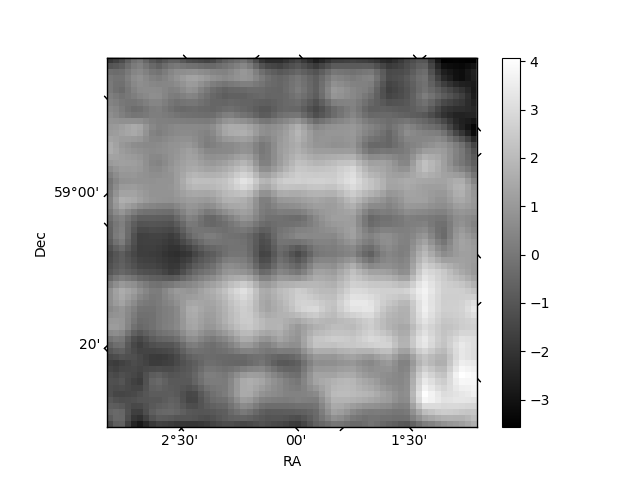
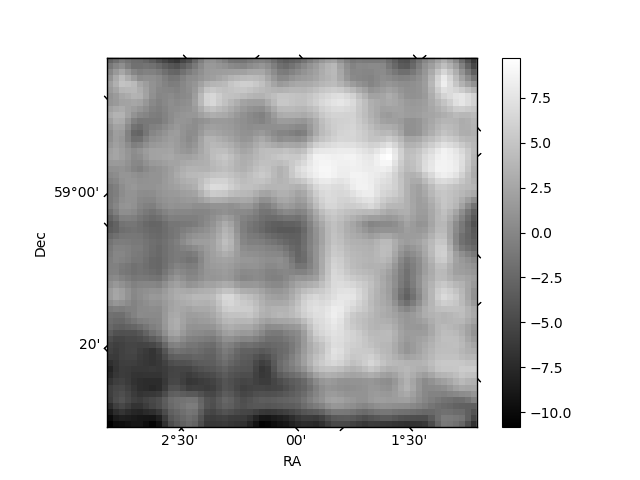
Histogram calculated using DETX and DETY for each event in the final _common_clean file
| Quadrant A | 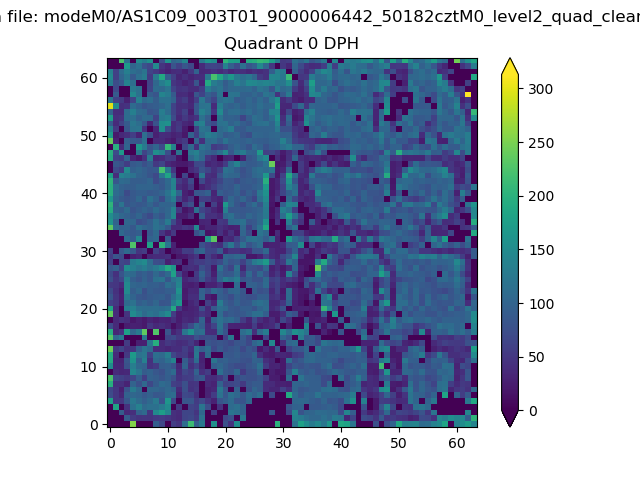 |
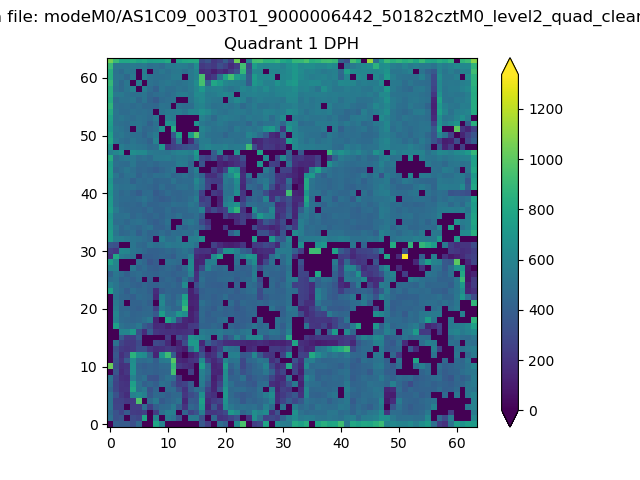 |
Quadrant B |
|---|---|---|---|
| Quadrant D | 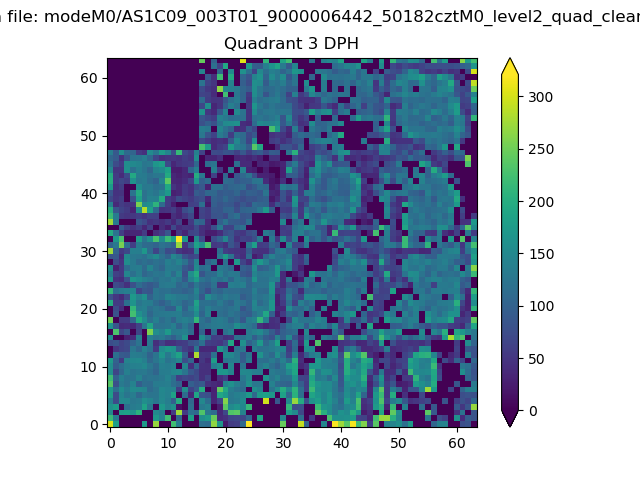 |
 |
Quadrant C |
| Plot type | Count rate plots | Images |
|---|---|---|
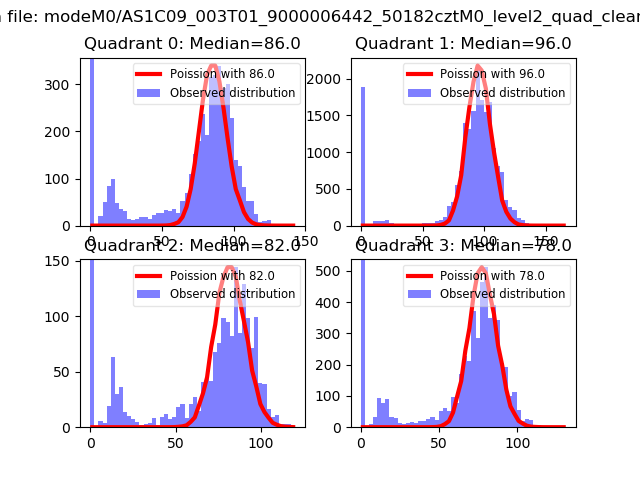
| Comparison with Poisson distribution Blue bars denote a histogram of data divided into 1 sec bins. Red curve is a Poisson curve with rate = median count rate of data. |
 |
 |
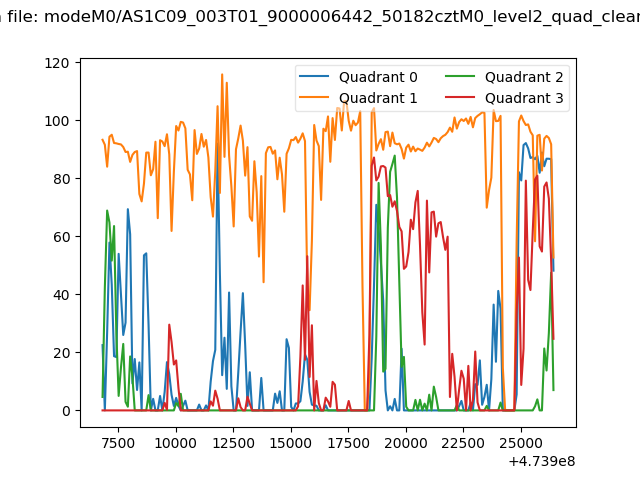
| Quadrant-wise count rates Data is divided into 100 sec bins |
 |
|
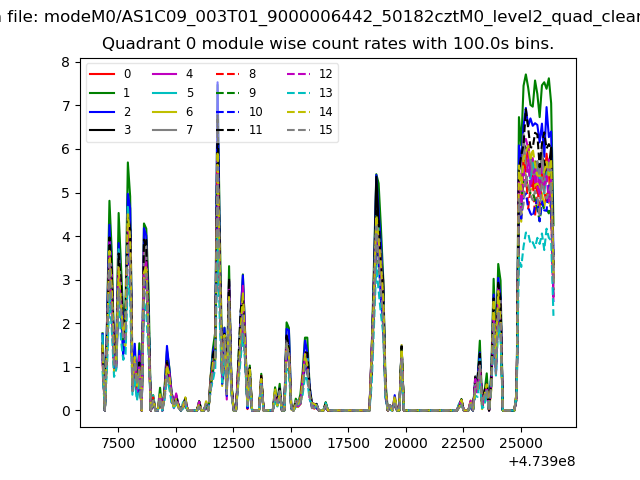
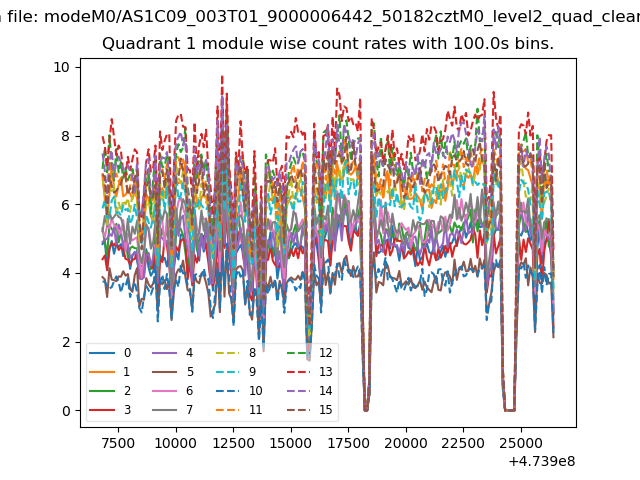
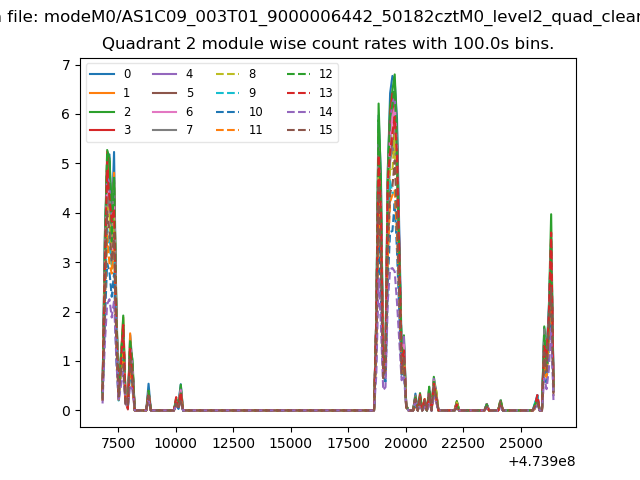
| Module-wise count rates for Quadrant A Data is divided into 100 sec bins |
 |
 |
| Module-wise count rates for Quadrant B Data is divided into 100 sec bins |
 |
 |
| Module-wise count rates for Quadrant C Data is divided into 100 sec bins |
 |
 |
| Module-wise count rates for Quadrant D Data is divided into 100 sec bins |
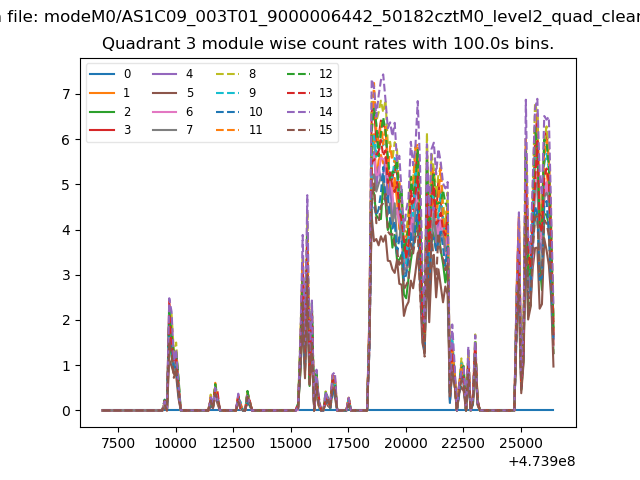 |
 |
| Parameter | Plot |
|---|---|
| CZT HV Monitor | 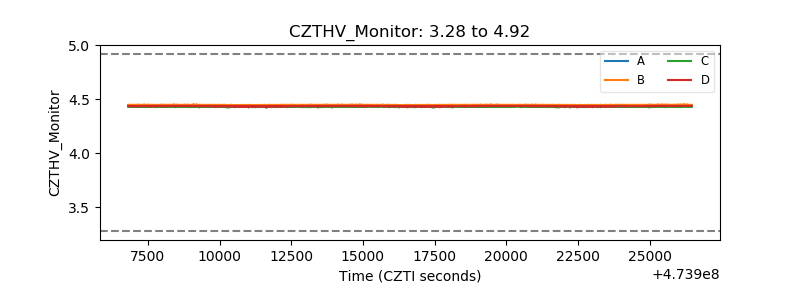 |
| D_VDD | 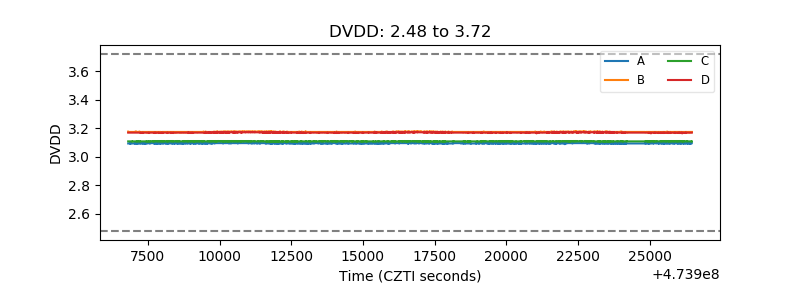 |
| Temperature 1 | 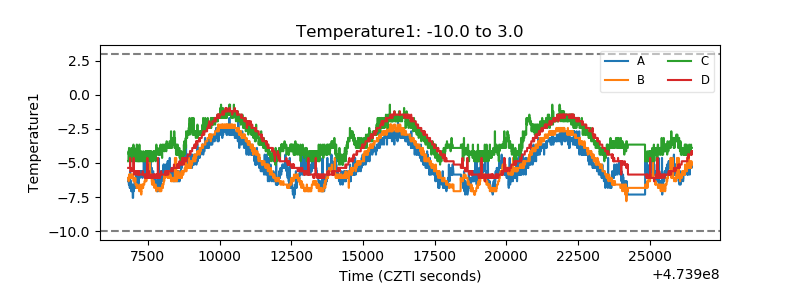 |
| Veto HV Monitor | 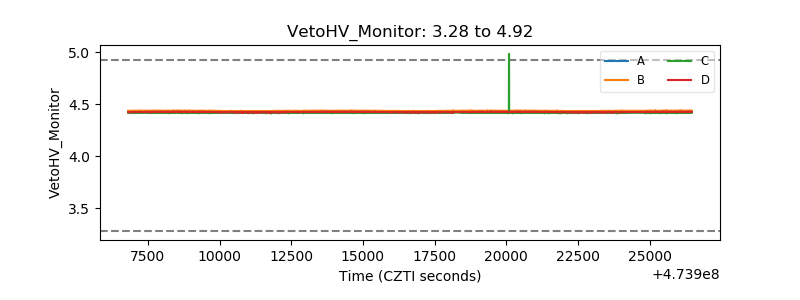 |
| Veto LLD | 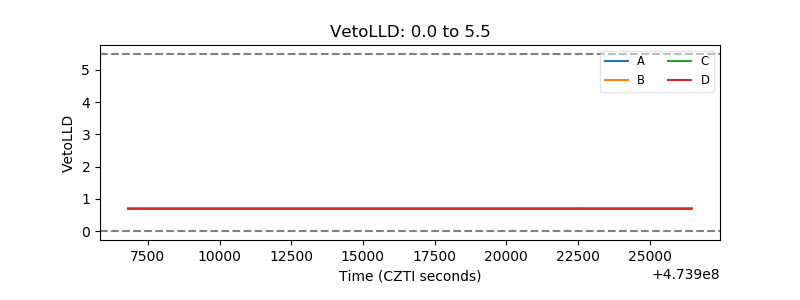 |
| Alpha Counter | 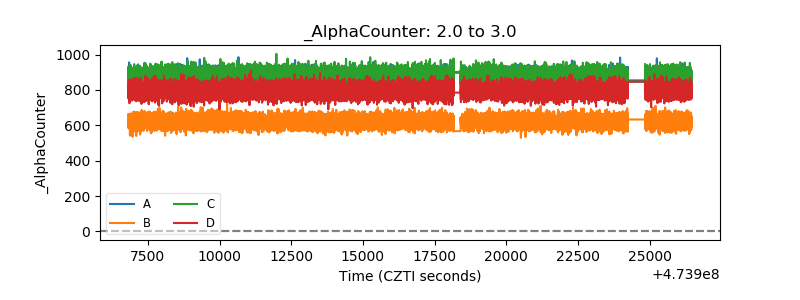 |
| _CPM_Rate | 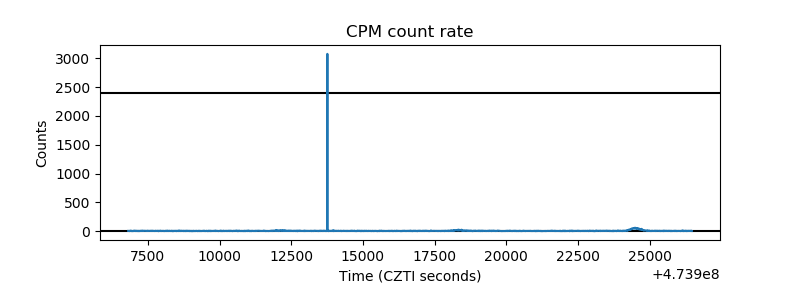 |
| CZT Counter | 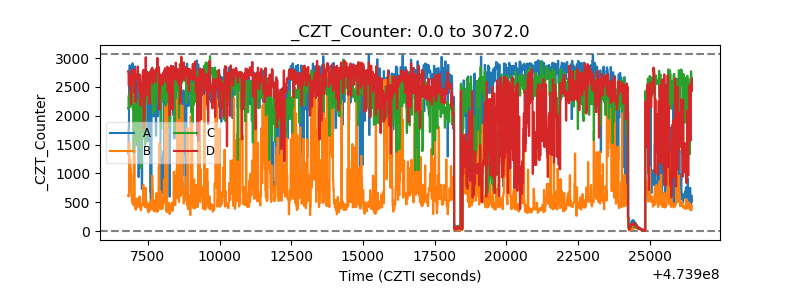 |
| +2.5 Volts monitor |  |
| +5 Volts monitor |  |
| _ROLL_ROT | 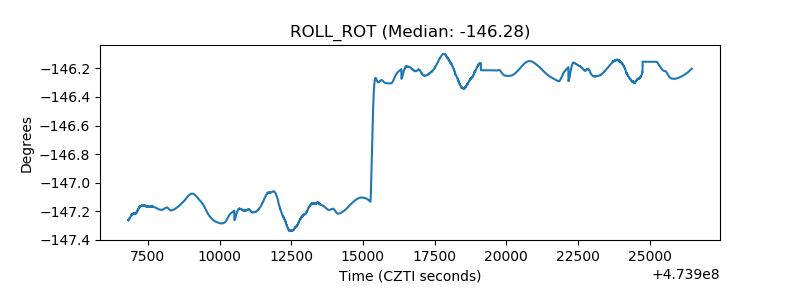 |
| _Roll_DEC | 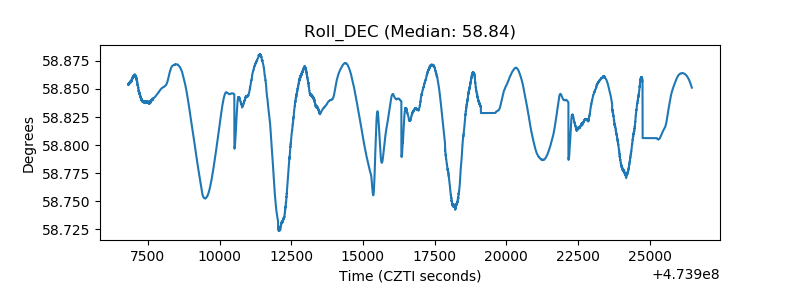 |
| _Roll_RA | 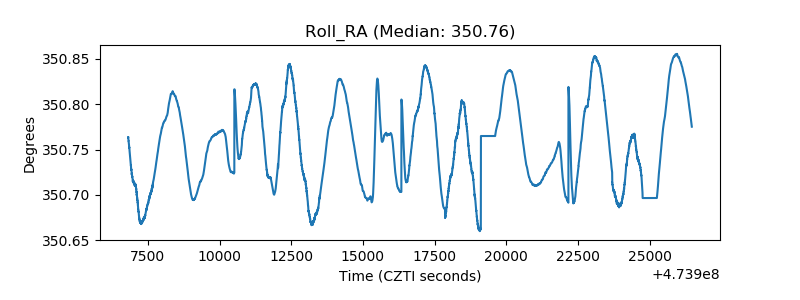 |
| Veto Counter | 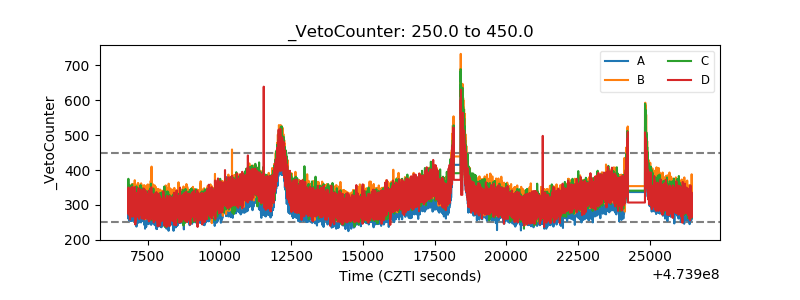 |