| Param | Original file | Final file |
|---|---|---|
| Filename | modeM0/AS1C09_003T01_9000006442_50183cztM0_level2.fits | modeM0/AS1C09_003T01_9000006442_50183cztM0_level2_quad_clean.evt |
| Size (bytes) | 1,029,533,760 | 72,561,600 |
| Size | 981.8 MB | 69.2 MB |
| Events in quadrant A | 6,251,845 | 557,830 |
| Events in quadrant B | 5,130,290 | 623,821 |
| Events in quadrant C | 14,597,033 | 206,473 |
| Events in quadrant D | 11,616,003 | 342,428 |
| Mode M9 | |||
|---|---|---|---|
| Quadrant | BADHDUFLAG | Total packets | Discarded packets |
| A | 0 | 7 | 0 |
| B | 0 | 7 | 0 |
| C | 0 | 7 | 0 |
| D | 0 | 7 | 0 |
| Mode M0 | |||
|---|---|---|---|
| Quadrant | BADHDUFLAG | Total packets | Discarded packets |
| A | 0 | 23362 | 1 |
| B | 0 | 19818 | 1 |
| C | 0 | 47869 | 1 |
| D | 0 | 39136 | 7 |
| Mode SS | |||
|---|---|---|---|
| Quadrant | BADHDUFLAG | Total packets | Discarded packets |
| A | 0 | 138 | 0 |
| B | 0 | 138 | 0 |
| C | 0 | 138 | 0 |
| D | 0 | 138 | 0 |
| Quadrant | Total seconds | Saturated seconds | Saturation percentage |
|---|---|---|---|
| A | 6678 | 644 | 9.643606% |
| B | 6679 | 542 | 8.114987% |
| C | 6679 | 4654 | 69.681090% |
| D | 6678 | 2756 | 41.269841% |
Noise dominated data is calculated using 1-second bins in cleaned event files. If a bin has >2000 counts, and if more than 50% of those come from <1% of pixels, then it is considered to be noise-dominated and hence unusable.
| Quadrant | # 1 sec bins | Bins with >0 counts | Bins with >2000 counts | High rate bins dominated by noise | Noise dominated (total time) | Noise dominated (detector-on time) | Marked lightcurve |
|---|---|---|---|---|---|---|---|
| A | 7442 | 6678 | 510 | 510 | 6.85% | 7.64% | 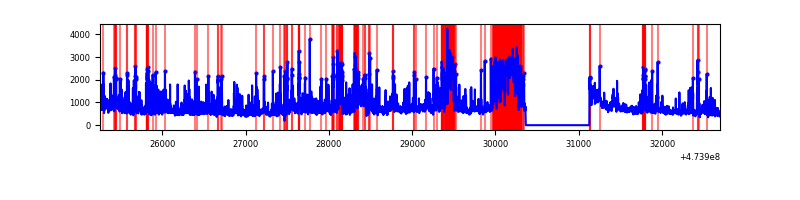 |
| B | 7444 | 6680 | 361 | 361 | 4.85% | 5.40% | 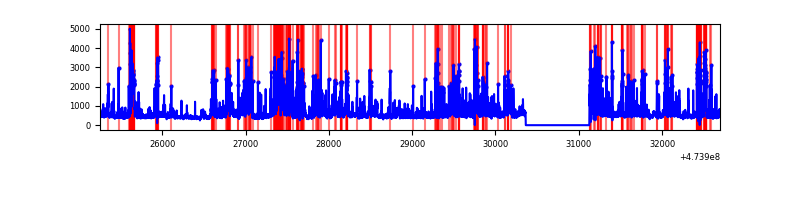 |
| C | 7444 | 6679 | 4338 | 4338 | 58.28% | 64.95% | 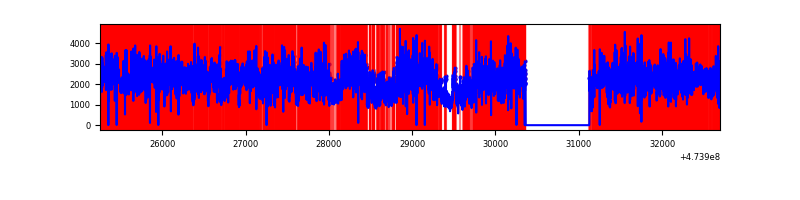 |
| D | 7443 | 6679 | 2708 | 2708 | 36.38% | 40.54% | 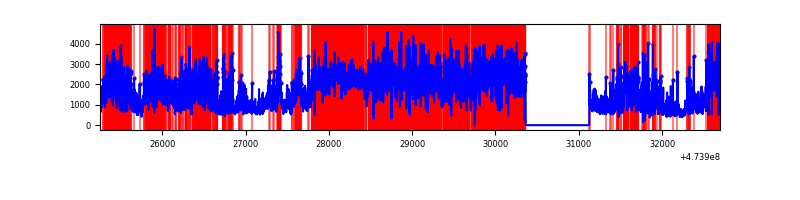 |
Top three noisy pixels from each quadrant. If the there are fewer than three noisy pixels in the level2.evt file, extra rows are filled as -1
| Pixel properties | Quadrant properties | ||||||
|---|---|---|---|---|---|---|---|
| Quadrant | DetID | PixID | Counts | Sigma | Mean | Median | Sigma |
| A | 0 | 98 | 984944 | 5835.95 | 672 | 653 | 168.7 |
| A | 8 | 8 | 677099 | 4010.71 | 672 | 653 | 168.7 |
| A | 4 | 156 | 578720 | 3427.41 | 672 | 653 | 168.7 |
| B | 4 | 206 | 1035648 | 7280.9 | 668 | 647 | 142.2 |
| B | 3 | 249 | 761748 | 5354.1 | 668 | 647 | 142.2 |
| B | 5 | 185 | 219943 | 1542.68 | 668 | 647 | 142.2 |
| C | 15 | 213 | 5585965 | 47157.17 | 424 | 423 | 118.4 |
| C | 4 | 111 | 4709482 | 39757.27 | 424 | 423 | 118.4 |
| C | 15 | 230 | 601374 | 5073.66 | 424 | 423 | 118.4 |
| D | 12 | 6 | 2683676 | 16890.36 | 555 | 535 | 158.9 |
| D | 15 | 168 | 1686510 | 10613.2 | 555 | 535 | 158.9 |
| D | 15 | 185 | 1308775 | 8235.36 | 555 | 535 | 158.9 |
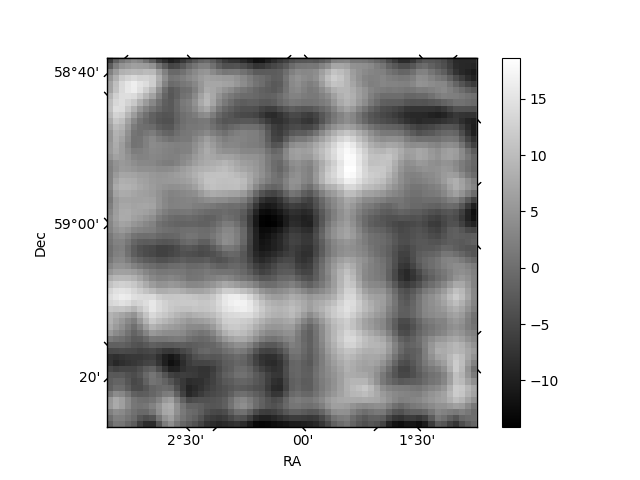
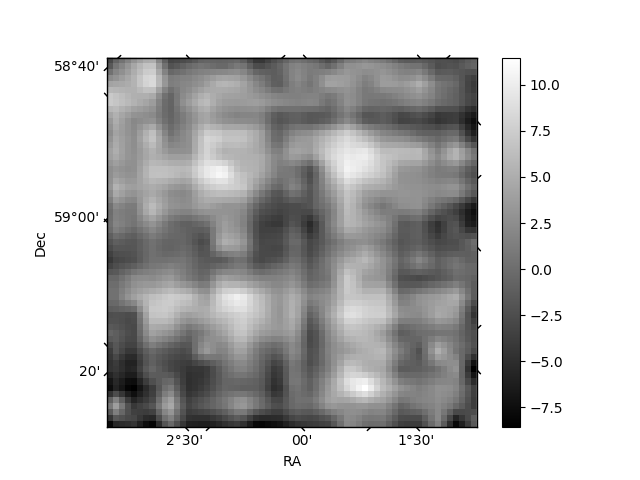
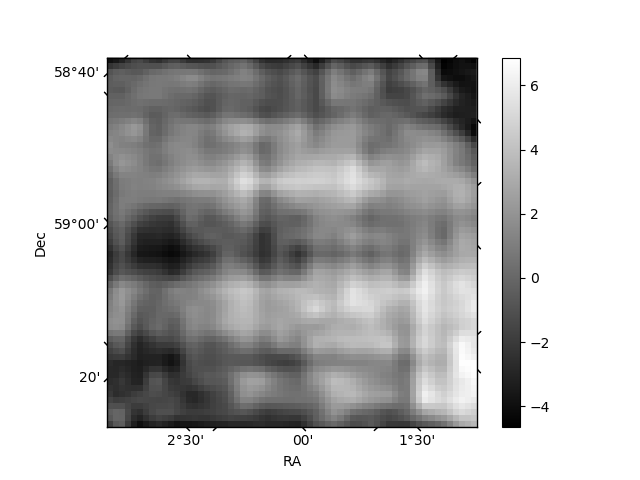
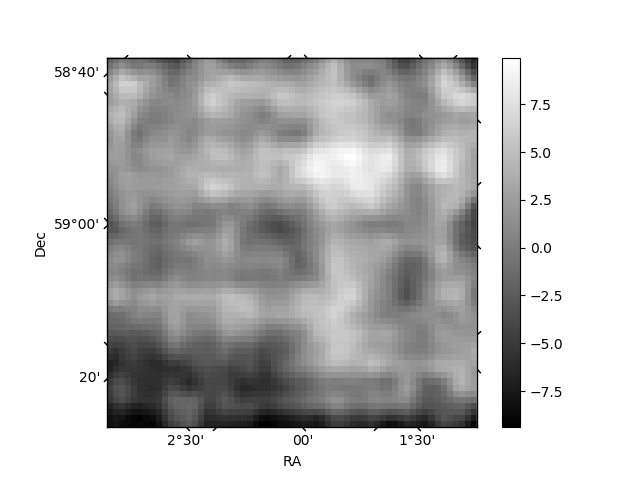
Histogram calculated using DETX and DETY for each event in the final _common_clean file
| Quadrant A | 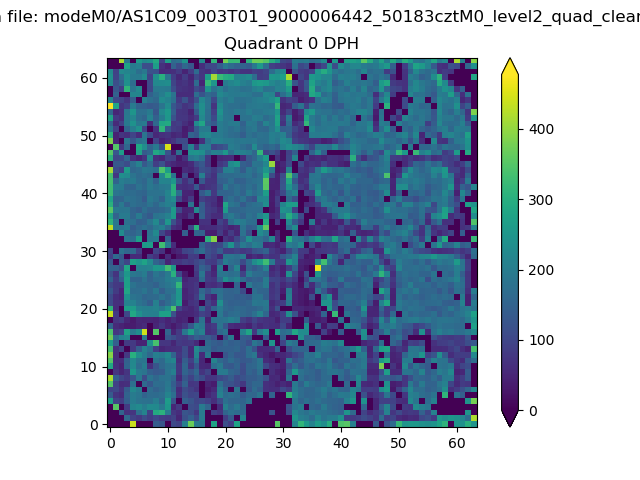 |
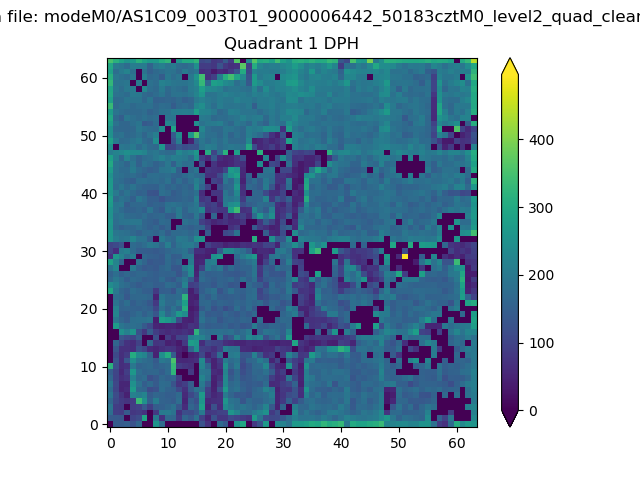 |
Quadrant B |
|---|---|---|---|
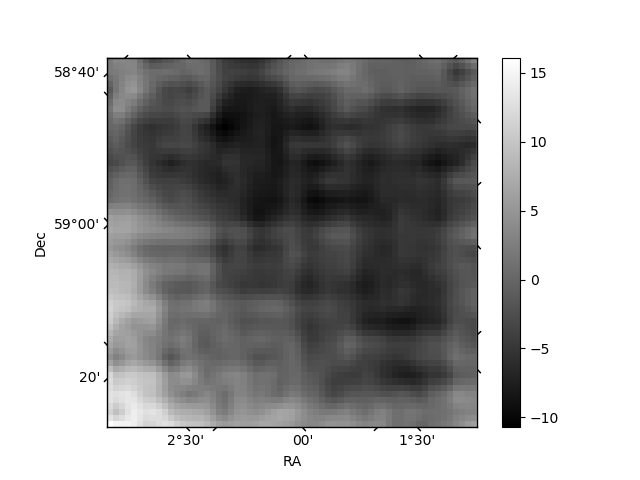
| Quadrant D | 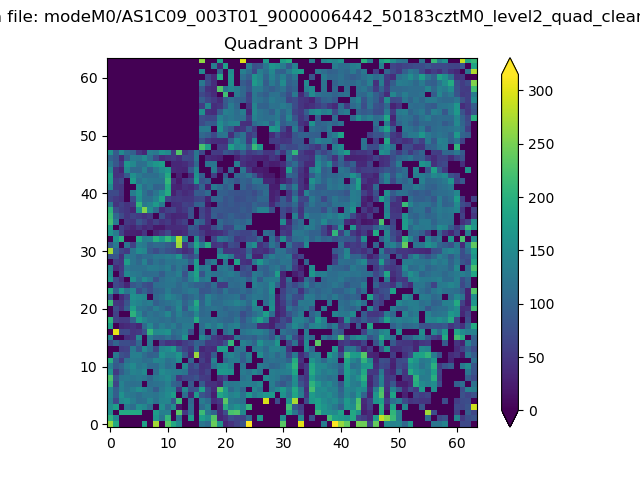 |
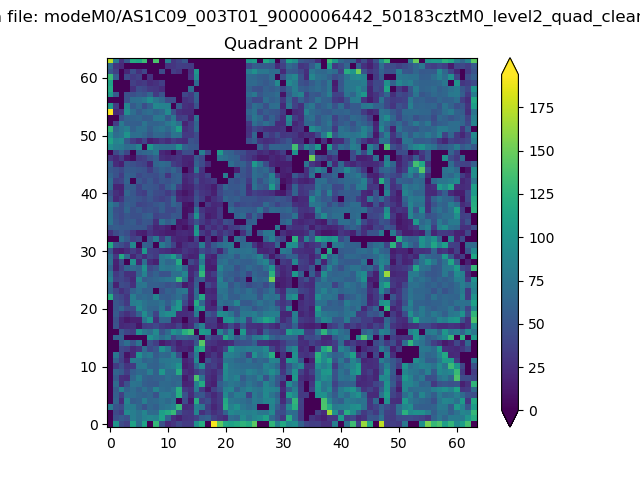 |
Quadrant C |
| Plot type | Count rate plots | Images |
|---|---|---|
| Comparison with Poisson distribution Blue bars denote a histogram of data divided into 1 sec bins. Red curve is a Poisson curve with rate = median count rate of data. |
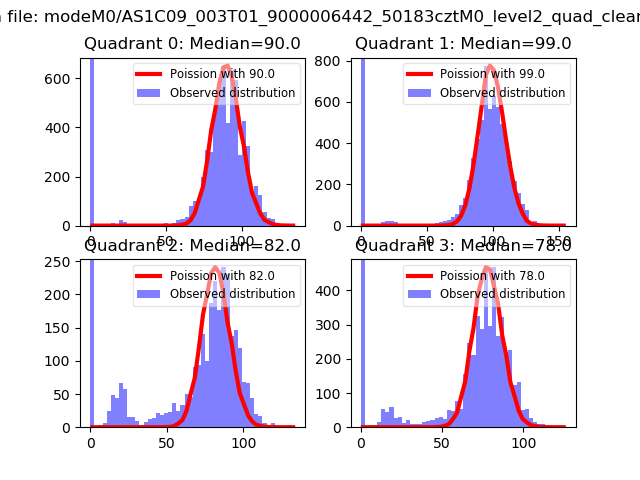 |
 |
| Quadrant-wise count rates Data is divided into 100 sec bins |
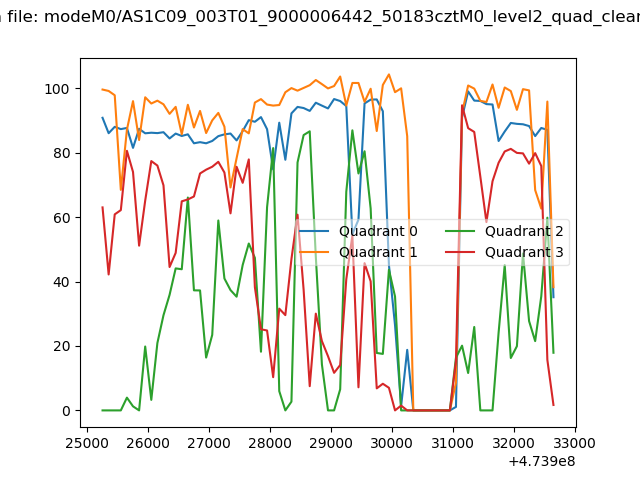 |
|
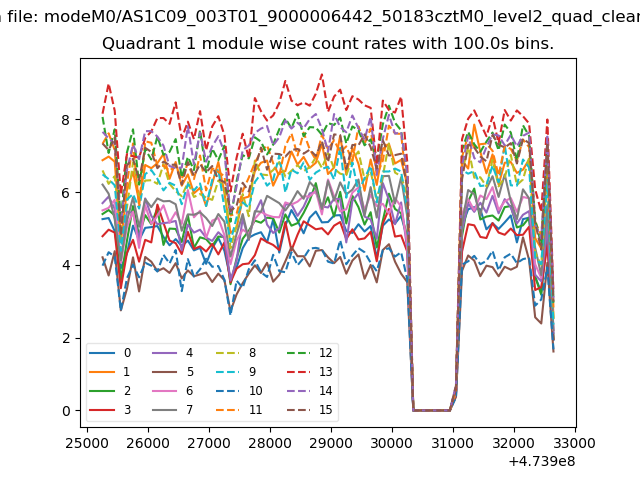
| Module-wise count rates for Quadrant A Data is divided into 100 sec bins |
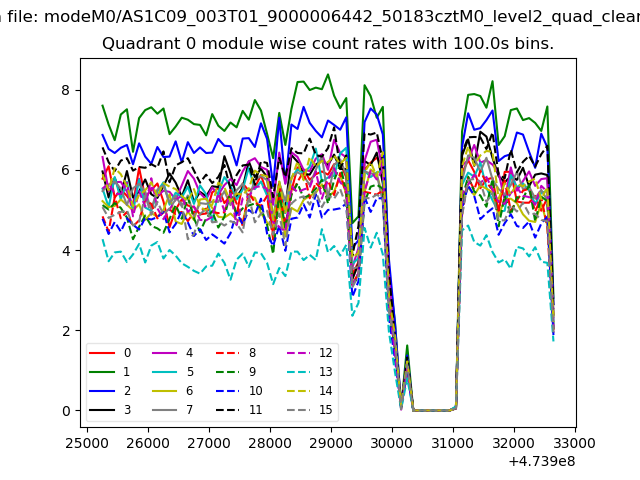 |
 |
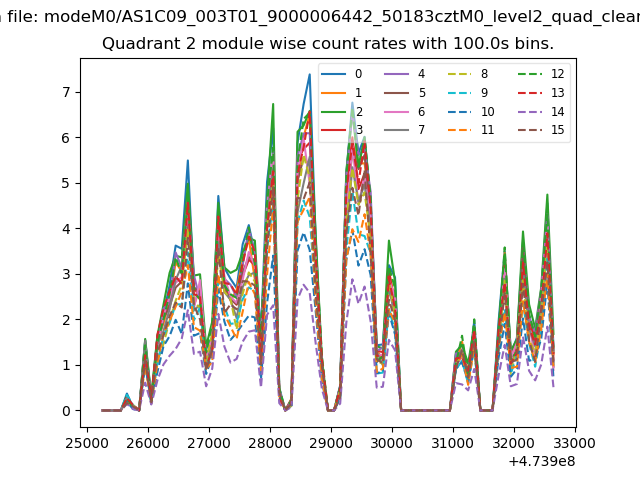
| Module-wise count rates for Quadrant B Data is divided into 100 sec bins |
 |
 |
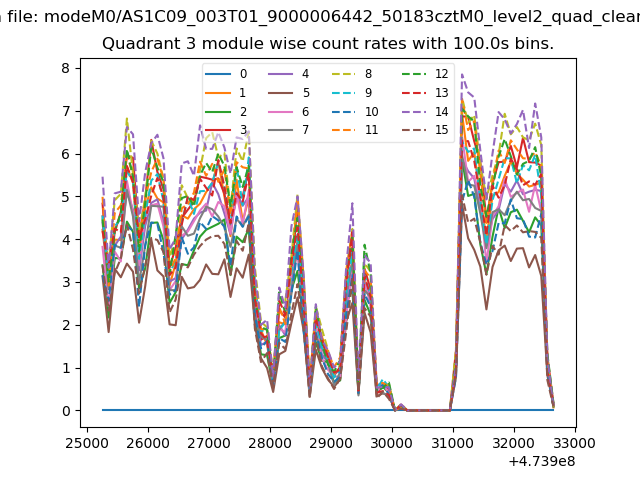
| Module-wise count rates for Quadrant C Data is divided into 100 sec bins |
 |
 |
| Module-wise count rates for Quadrant D Data is divided into 100 sec bins |
 |
 |
| Parameter | Plot |
|---|---|
| CZT HV Monitor | 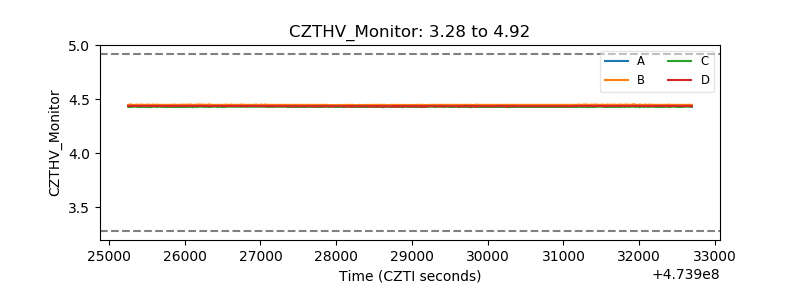 |
| D_VDD | 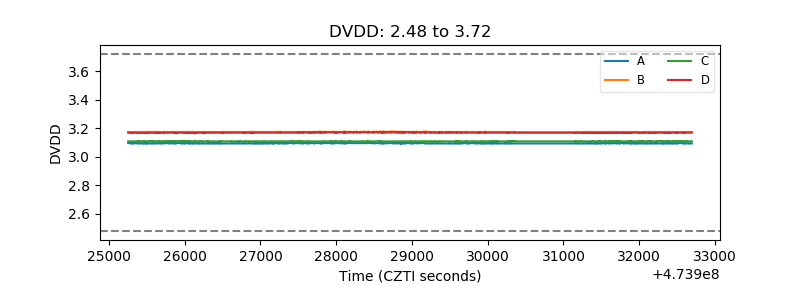 |
| Temperature 1 | 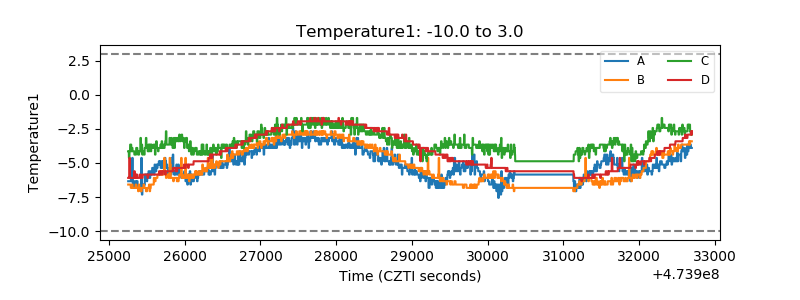 |
| Veto HV Monitor | 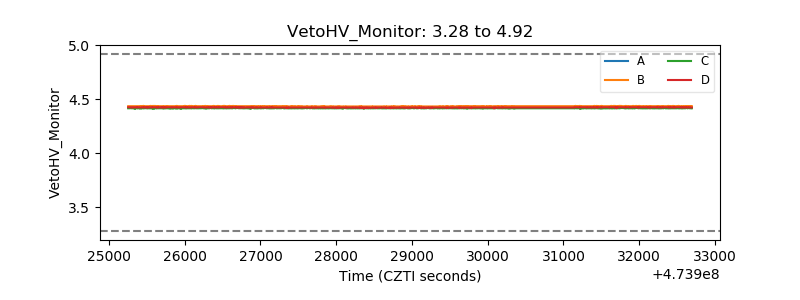 |
| Veto LLD | 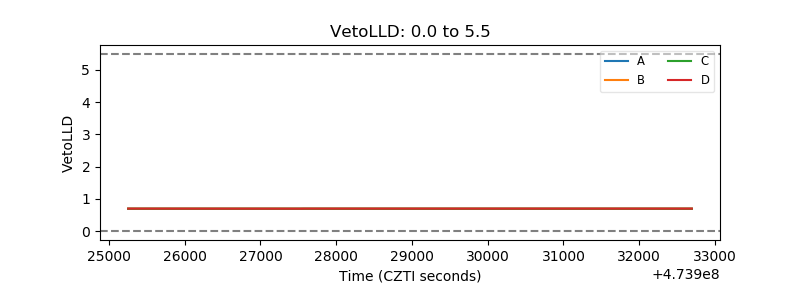 |
| Alpha Counter | 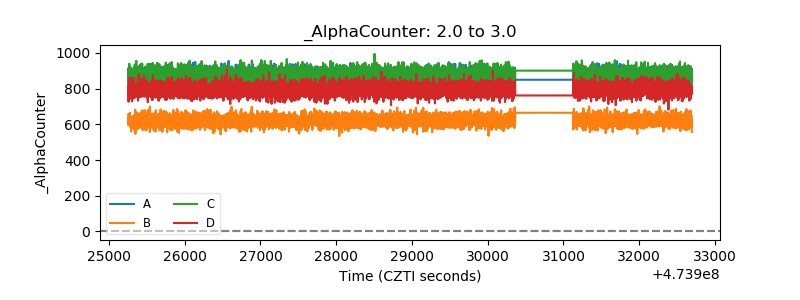 |
| _CPM_Rate | 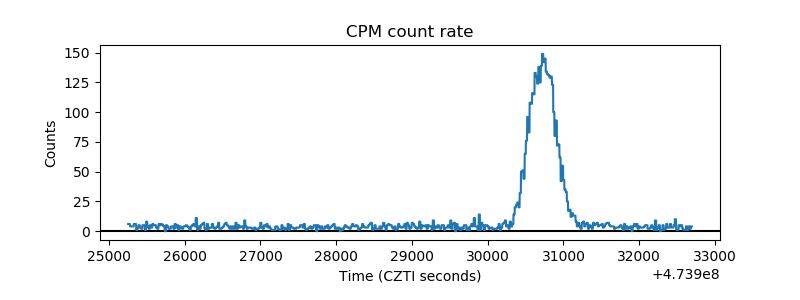 |
| CZT Counter | 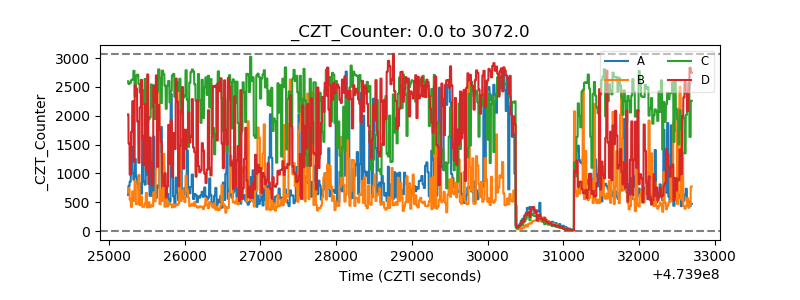 |
| +2.5 Volts monitor |  |
| +5 Volts monitor | 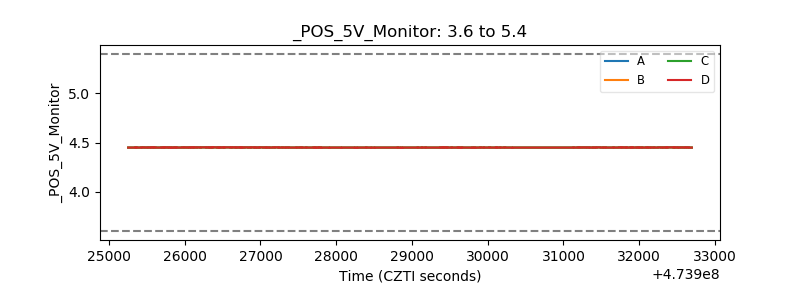 |
| _ROLL_ROT | 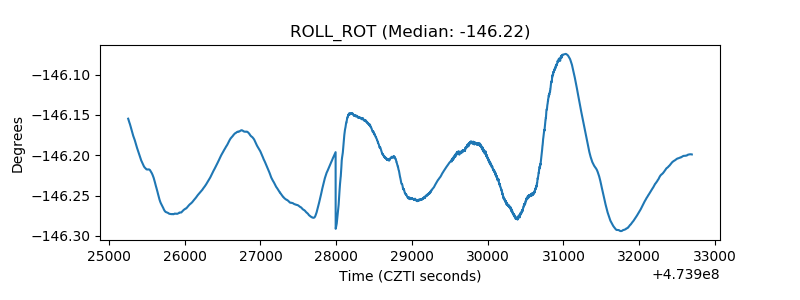 |
| _Roll_DEC | 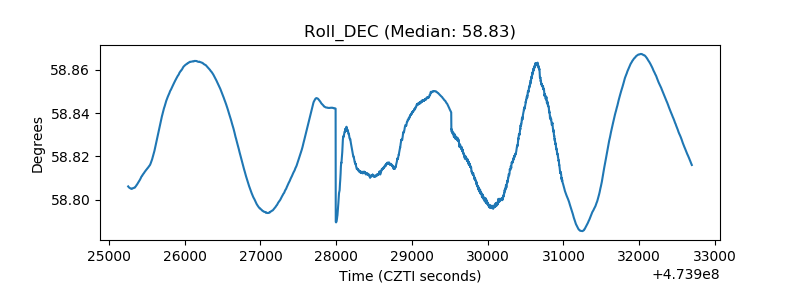 |
| _Roll_RA | 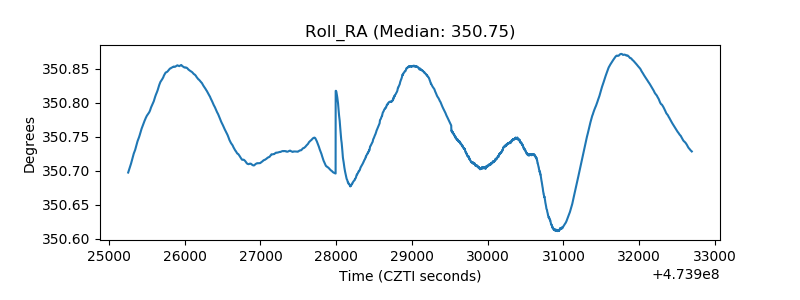 |
| Veto Counter | 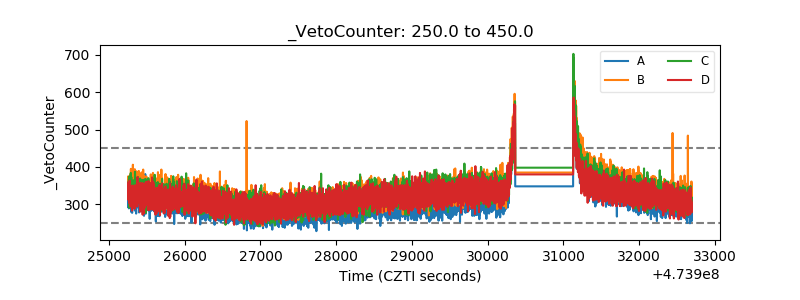 |