| Param | Original file | Final file |
|---|---|---|
| Filename | modeM0/AS1C09_003T01_9000006442_50184cztM0_level2.fits | modeM0/AS1C09_003T01_9000006442_50184cztM0_level2_quad_clean.evt |
| Size (bytes) | 965,223,360 | 61,433,280 |
| Size | 920.5 MB | 58.6 MB |
| Events in quadrant A | 6,046,031 | 517,538 |
| Events in quadrant B | 4,701,204 | 553,524 |
| Events in quadrant C | 13,801,081 | 63,280 |
| Events in quadrant D | 10,724,603 | 311,531 |
| Mode M9 | |||
|---|---|---|---|
| Quadrant | BADHDUFLAG | Total packets | Discarded packets |
| A | 0 | 9 | 0 |
| B | 0 | 9 | 0 |
| C | 0 | 9 | 0 |
| D | 0 | 9 | 0 |
| Mode M0 | |||
|---|---|---|---|
| Quadrant | BADHDUFLAG | Total packets | Discarded packets |
| A | 0 | 22212 | 1 |
| B | 0 | 18033 | 2 |
| C | 0 | 44943 | 1 |
| D | 0 | 35937 | 1 |
| Mode SS | |||
|---|---|---|---|
| Quadrant | BADHDUFLAG | Total packets | Discarded packets |
| A | 0 | 122 | 0 |
| B | 0 | 122 | 0 |
| C | 0 | 122 | 0 |
| D | 0 | 122 | 0 |
| Quadrant | Total seconds | Saturated seconds | Saturation percentage |
|---|---|---|---|
| A | 5917 | 555 | 9.379753% |
| B | 5916 | 603 | 10.192698% |
| C | 5916 | 5294 | 89.486139% |
| D | 5916 | 2555 | 43.187965% |
Noise dominated data is calculated using 1-second bins in cleaned event files. If a bin has >2000 counts, and if more than 50% of those come from <1% of pixels, then it is considered to be noise-dominated and hence unusable.
| Quadrant | # 1 sec bins | Bins with >0 counts | Bins with >2000 counts | High rate bins dominated by noise | Noise dominated (total time) | Noise dominated (detector-on time) | Marked lightcurve |
|---|---|---|---|---|---|---|---|
| A | 6837 | 5918 | 402 | 402 | 5.88% | 6.79% | 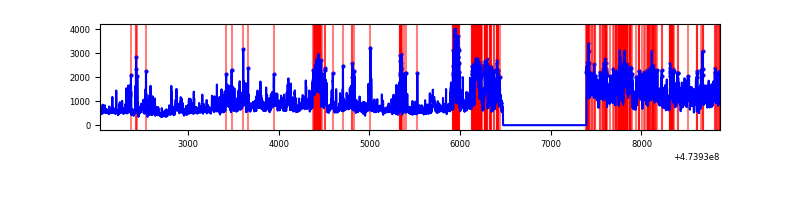 |
| B | 6836 | 5917 | 357 | 357 | 5.22% | 6.03% | 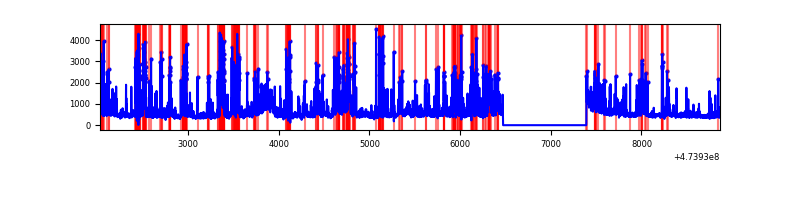 |
| C | 6836 | 5917 | 4684 | 4684 | 68.52% | 79.16% | 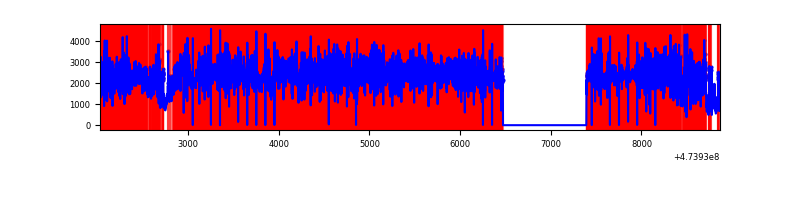 |
| D | 6836 | 5917 | 2640 | 2640 | 38.62% | 44.62% | 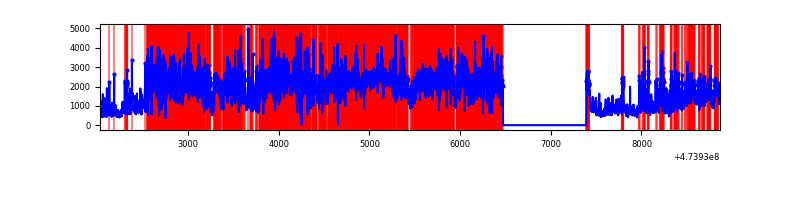 |
Top three noisy pixels from each quadrant. If the there are fewer than three noisy pixels in the level2.evt file, extra rows are filled as -1
| Pixel properties | Quadrant properties | ||||||
|---|---|---|---|---|---|---|---|
| Quadrant | DetID | PixID | Counts | Sigma | Mean | Median | Sigma |
| A | 6 | 250 | 991161 | 6636.43 | 598 | 583 | 149.3 |
| A | 4 | 4 | 774713 | 5186.33 | 598 | 583 | 149.3 |
| A | 8 | 8 | 449982 | 3010.77 | 598 | 583 | 149.3 |
| B | 4 | 206 | 1347799 | 10650.22 | 586 | 565 | 126.5 |
| B | 3 | 249 | 263033 | 2074.87 | 586 | 565 | 126.5 |
| B | 5 | 172 | 146157 | 1150.94 | 586 | 565 | 126.5 |
| C | 15 | 213 | 6869928 | 98069.9 | 245 | 243 | 70.0 |
| C | 4 | 111 | 3528273 | 50365.27 | 245 | 243 | 70.0 |
| C | 15 | 230 | 616345 | 8795.32 | 245 | 243 | 70.0 |
| D | 15 | 185 | 2015028 | 14093.92 | 500 | 484 | 142.9 |
| D | 12 | 6 | 1180748 | 8257.22 | 500 | 484 | 142.9 |
| D | 15 | 108 | 993910 | 6950.09 | 500 | 484 | 142.9 |
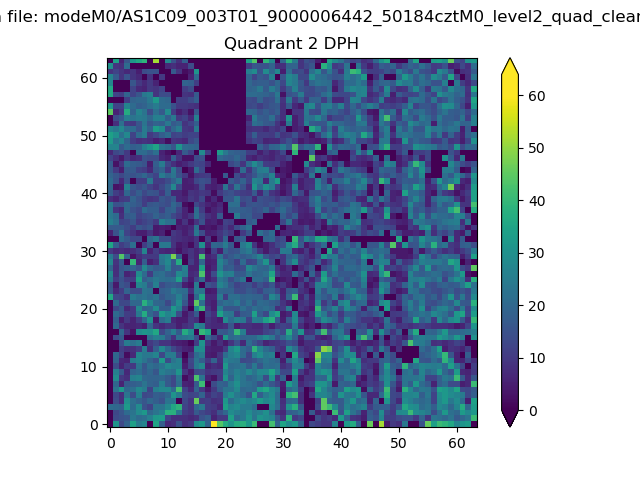
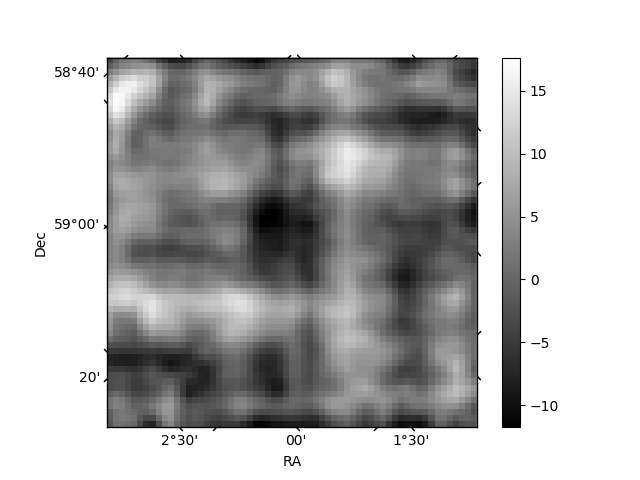
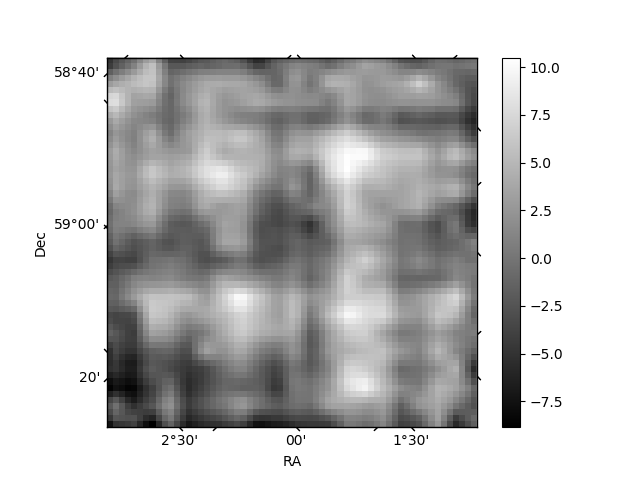
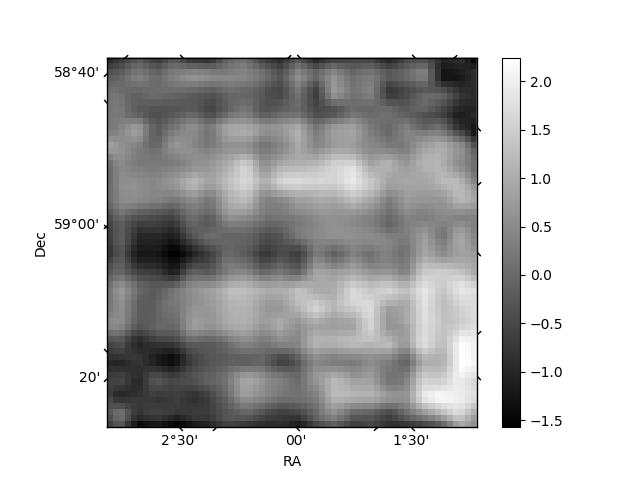
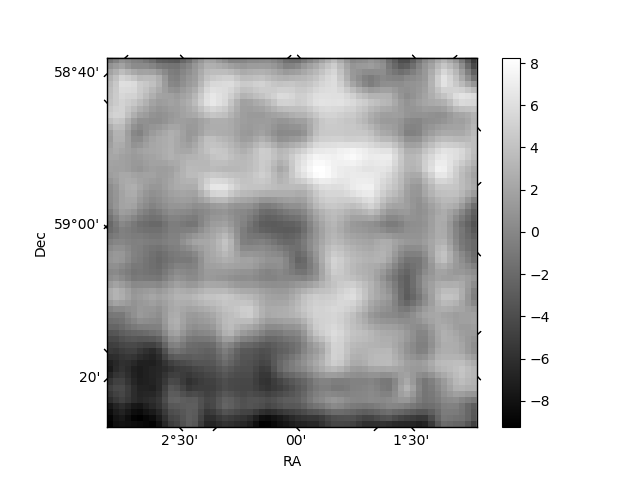
Histogram calculated using DETX and DETY for each event in the final _common_clean file
| Quadrant A | 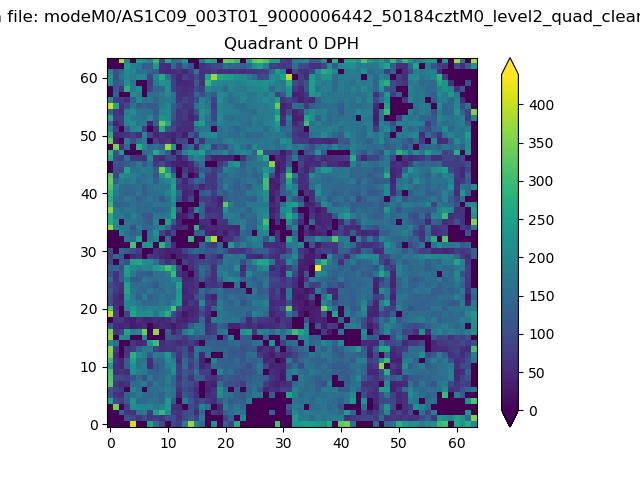 |
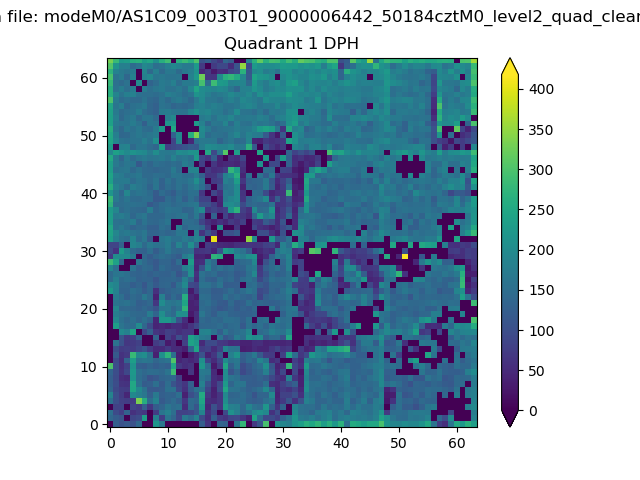 |
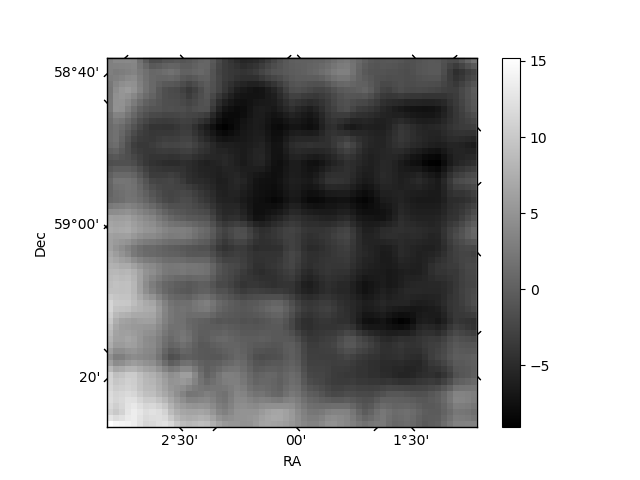
Quadrant B |
|---|---|---|---|
| Quadrant D | 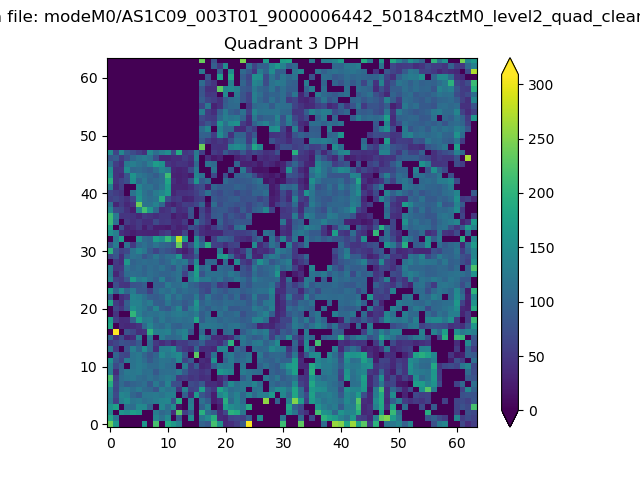 |
 |
Quadrant C |
| Plot type | Count rate plots | Images |
|---|---|---|
| Comparison with Poisson distribution Blue bars denote a histogram of data divided into 1 sec bins. Red curve is a Poisson curve with rate = median count rate of data. |
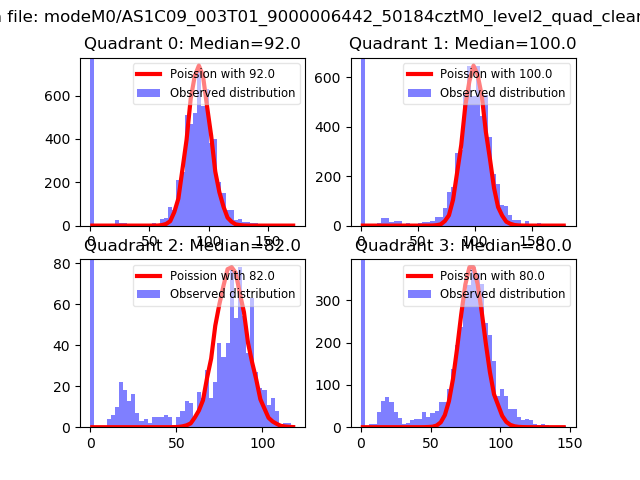 |
 |
| Quadrant-wise count rates Data is divided into 100 sec bins |
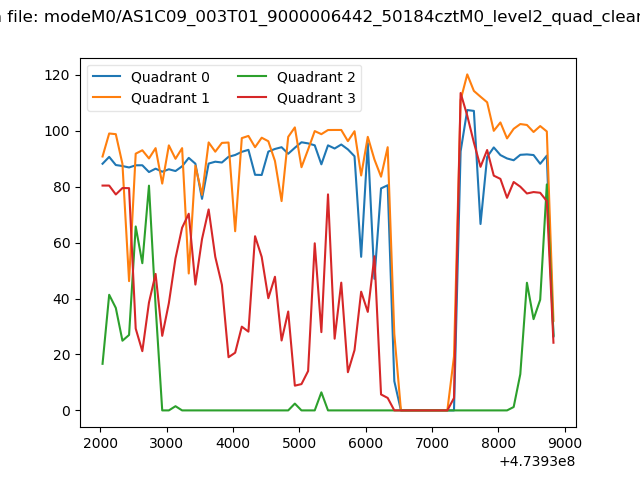 |
|
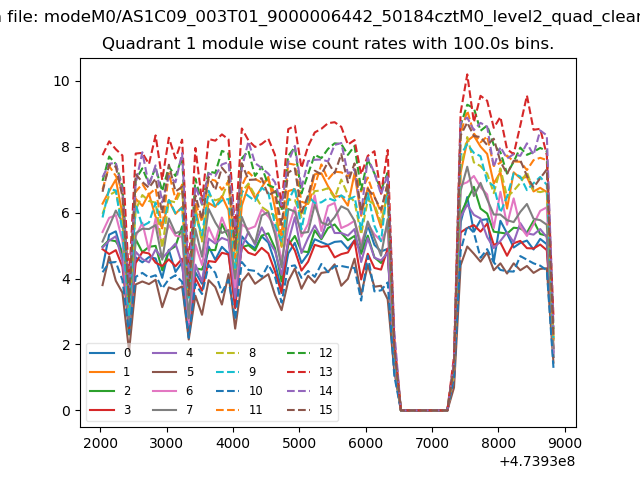
| Module-wise count rates for Quadrant A Data is divided into 100 sec bins |
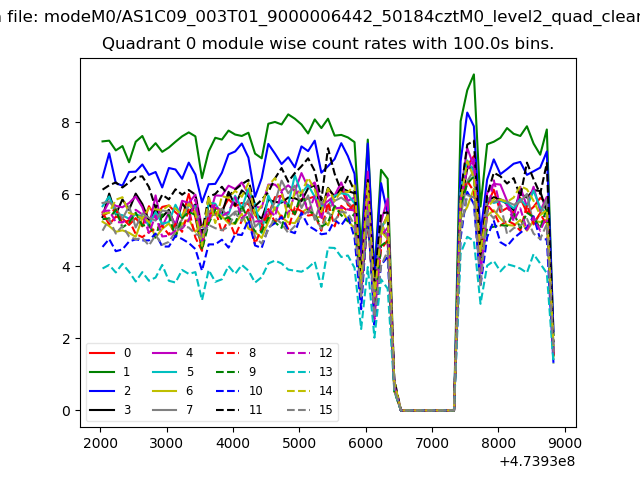 |
 |
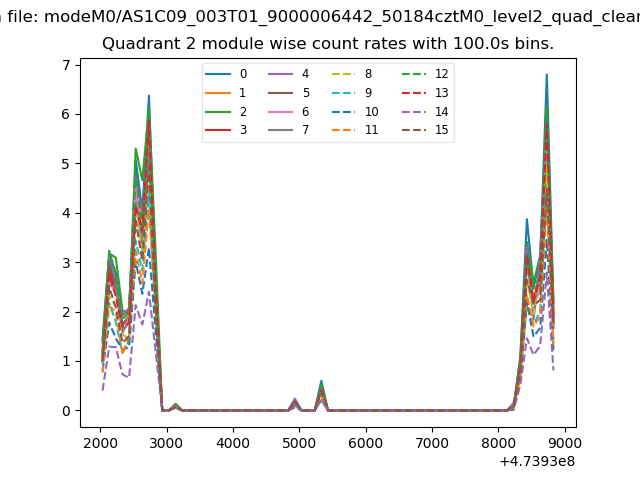
| Module-wise count rates for Quadrant B Data is divided into 100 sec bins |
 |
 |
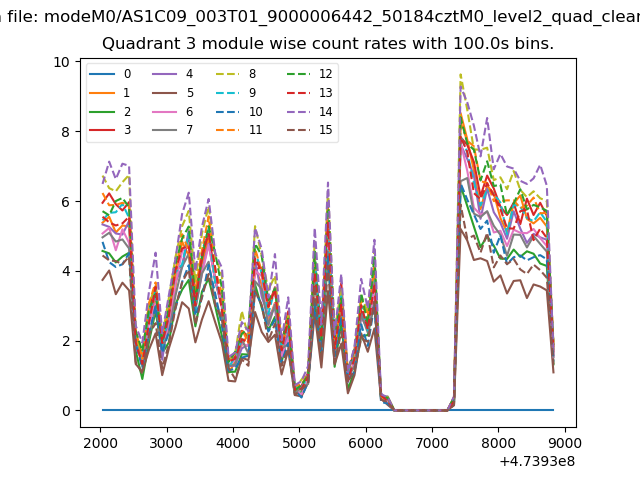
| Module-wise count rates for Quadrant C Data is divided into 100 sec bins |
 |
 |
| Module-wise count rates for Quadrant D Data is divided into 100 sec bins |
 |
 |
| Parameter | Plot |
|---|---|
| CZT HV Monitor | 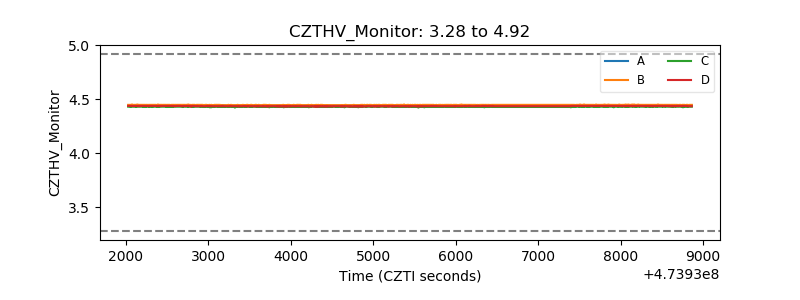 |
| D_VDD | 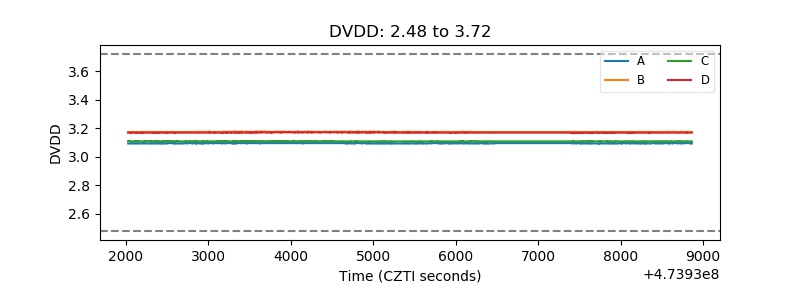 |
| Temperature 1 | 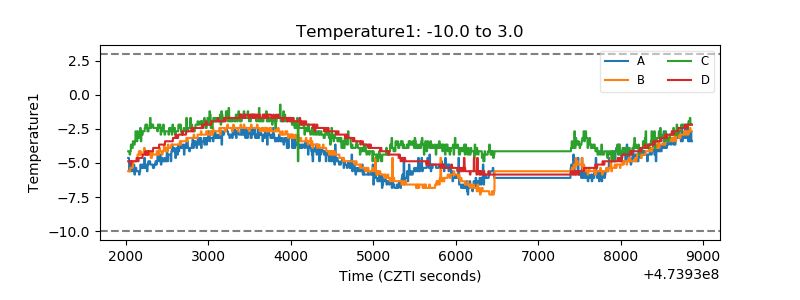 |
| Veto HV Monitor | 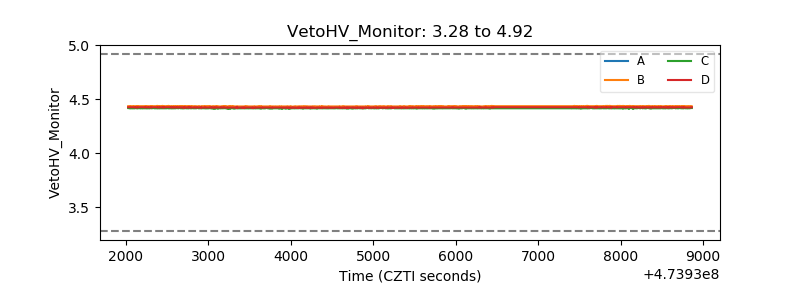 |
| Veto LLD | 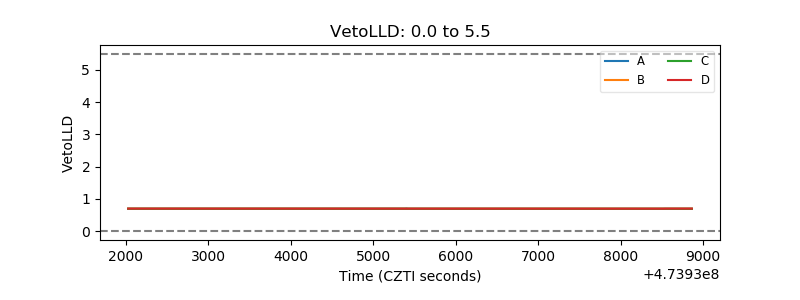 |
| Alpha Counter | 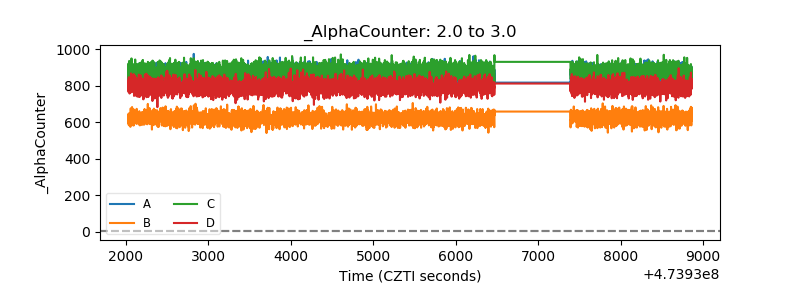 |
| _CPM_Rate | 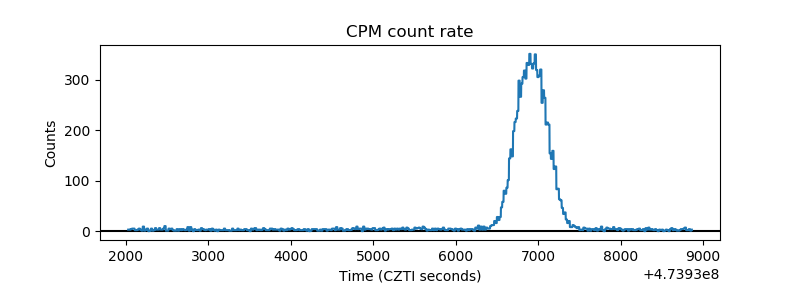 |
| CZT Counter | 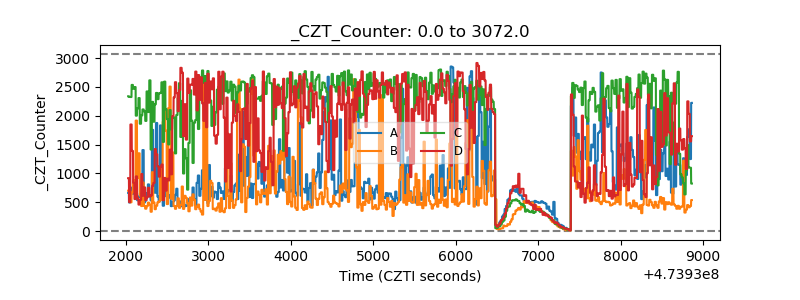 |
| +2.5 Volts monitor |  |
| +5 Volts monitor |  |
| _ROLL_ROT | 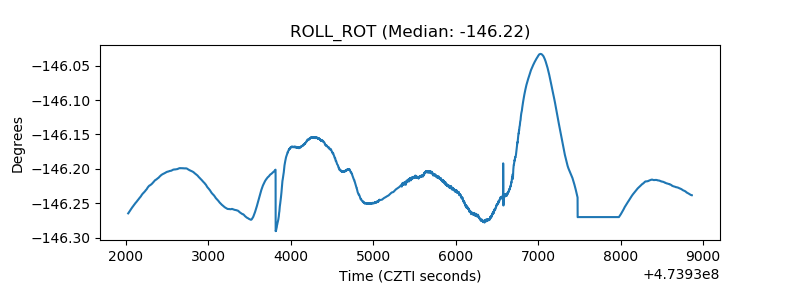 |
| _Roll_DEC | 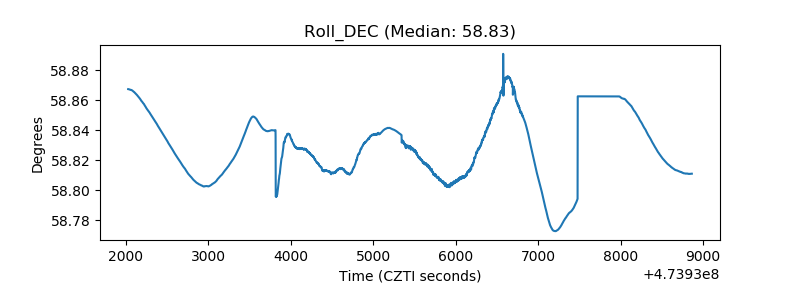 |
| _Roll_RA | 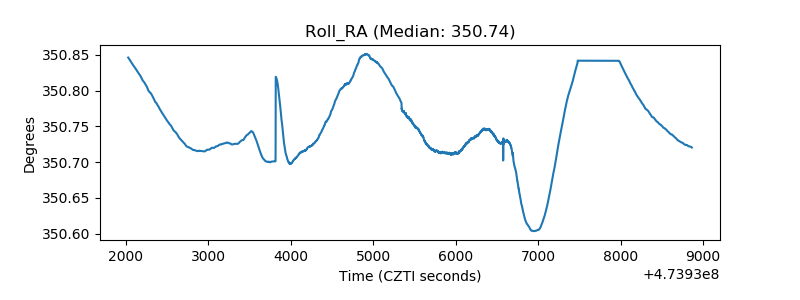 |
| Veto Counter | 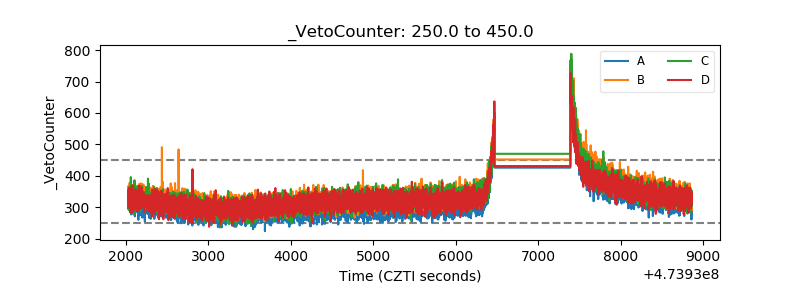 |