| Param | Original file | Final file |
|---|---|---|
| Filename | modeM0/AS1C09_003T01_9000006442_50187cztM0_level2.fits | modeM0/AS1C09_003T01_9000006442_50187cztM0_level2_quad_clean.evt |
| Size (bytes) | 1,072,730,880 | 56,027,520 |
| Size | 1023.0 MB | 53.4 MB |
| Events in quadrant A | 8,866,428 | 454,061 |
| Events in quadrant B | 4,444,127 | 574,295 |
| Events in quadrant C | 13,228,156 | 88,419 |
| Events in quadrant D | 12,730,103 | 179,207 |
| Mode M9 | |||
|---|---|---|---|
| Quadrant | BADHDUFLAG | Total packets | Discarded packets |
| A | 0 | 11 | 0 |
| B | 0 | 11 | 0 |
| C | 0 | 11 | 0 |
| D | 0 | 11 | 0 |
| Mode M0 | |||
|---|---|---|---|
| Quadrant | BADHDUFLAG | Total packets | Discarded packets |
| A | 0 | 30342 | 1 |
| B | 0 | 17120 | 1 |
| C | 0 | 43174 | 1 |
| D | 0 | 41790 | 1 |
| Mode SS | |||
|---|---|---|---|
| Quadrant | BADHDUFLAG | Total packets | Discarded packets |
| A | 0 | 116 | 0 |
| B | 0 | 116 | 0 |
| C | 0 | 116 | 0 |
| D | 0 | 116 | 0 |
| Quadrant | Total seconds | Saturated seconds | Saturation percentage |
|---|---|---|---|
| A | 5722 | 1451 | 25.358266% |
| B | 5722 | 464 | 8.109053% |
| C | 5723 | 4937 | 86.265944% |
| D | 5723 | 3991 | 69.736152% |
Noise dominated data is calculated using 1-second bins in cleaned event files. If a bin has >2000 counts, and if more than 50% of those come from <1% of pixels, then it is considered to be noise-dominated and hence unusable.
| Quadrant | # 1 sec bins | Bins with >0 counts | Bins with >2000 counts | High rate bins dominated by noise | Noise dominated (total time) | Noise dominated (detector-on time) | Marked lightcurve |
|---|---|---|---|---|---|---|---|
| A | 6842 | 5723 | 1394 | 1394 | 20.37% | 24.36% | 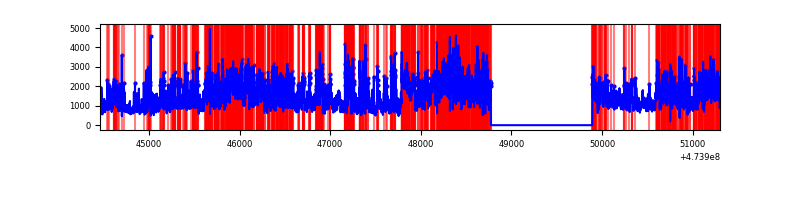 |
| B | 6842 | 5723 | 278 | 278 | 4.06% | 4.86% | 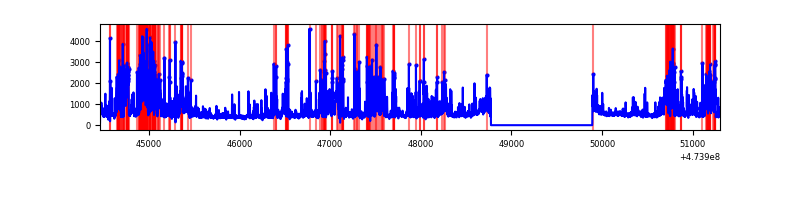 |
| C | 6843 | 5724 | 4270 | 4270 | 62.40% | 74.60% | 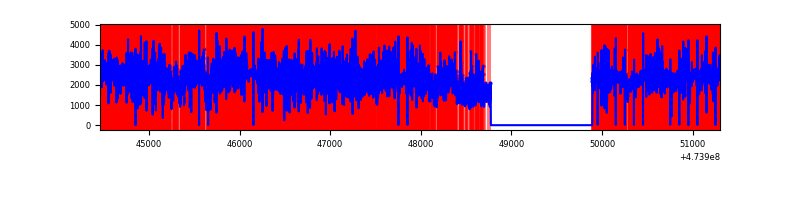 |
| D | 6843 | 5724 | 3815 | 3815 | 55.75% | 66.65% | 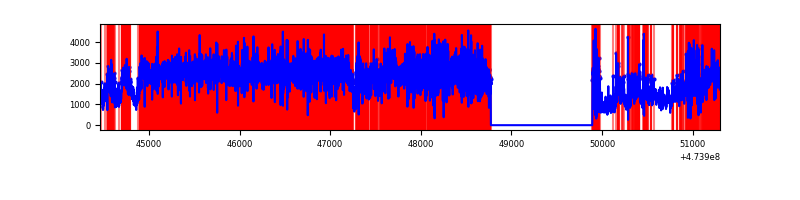 |
Top three noisy pixels from each quadrant. If the there are fewer than three noisy pixels in the level2.evt file, extra rows are filled as -1
| Pixel properties | Quadrant properties | ||||||
|---|---|---|---|---|---|---|---|
| Quadrant | DetID | PixID | Counts | Sigma | Mean | Median | Sigma |
| A | 4 | 4 | 3699134 | 26300.64 | 559 | 547 | 140.6 |
| A | 0 | 98 | 725791 | 5157.21 | 559 | 547 | 140.6 |
| A | 6 | 250 | 662538 | 4707.42 | 559 | 547 | 140.6 |
| B | 4 | 206 | 1273538 | 10045.74 | 589 | 569 | 126.7 |
| B | 3 | 249 | 215577 | 1696.75 | 589 | 569 | 126.7 |
| B | 5 | 172 | 174143 | 1369.77 | 589 | 569 | 126.7 |
| C | 4 | 111 | 5154546 | 65447.78 | 277 | 275 | 78.8 |
| C | 15 | 213 | 4397140 | 55830.41 | 277 | 275 | 78.8 |
| C | 15 | 230 | 686158 | 8709.19 | 277 | 275 | 78.8 |
| D | 15 | 185 | 3072221 | 25856.07 | 414 | 400 | 118.8 |
| D | 8 | 192 | 1861339 | 15663.86 | 414 | 400 | 118.8 |
| D | 15 | 168 | 1582654 | 13318.12 | 414 | 400 | 118.8 |
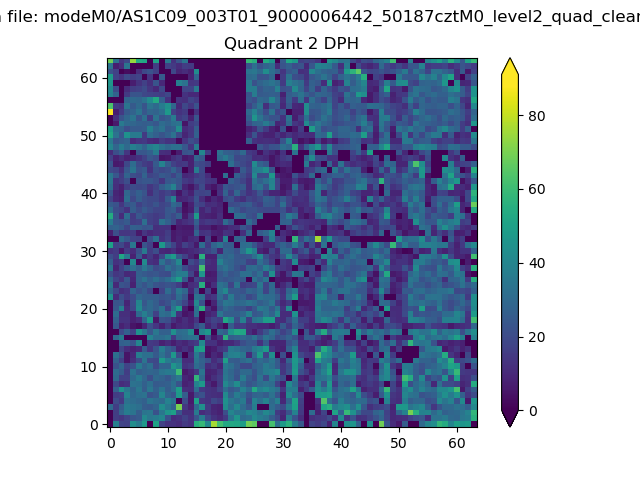
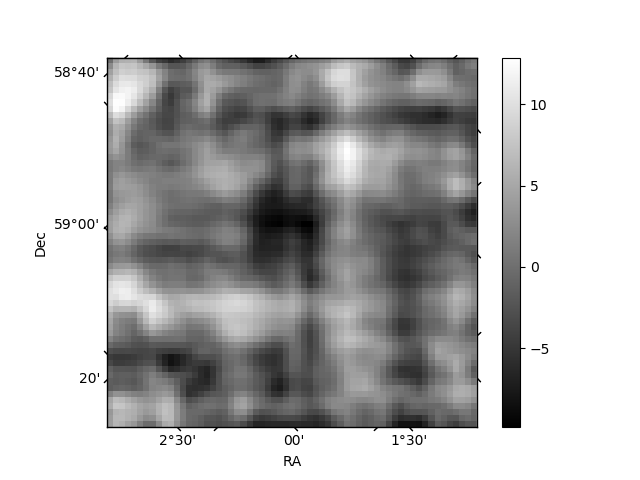
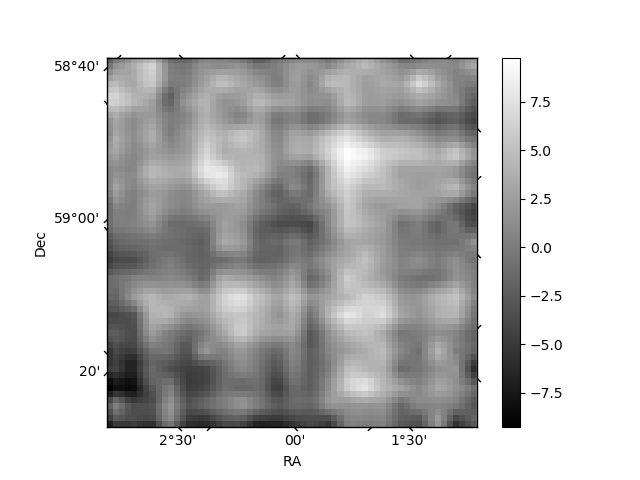
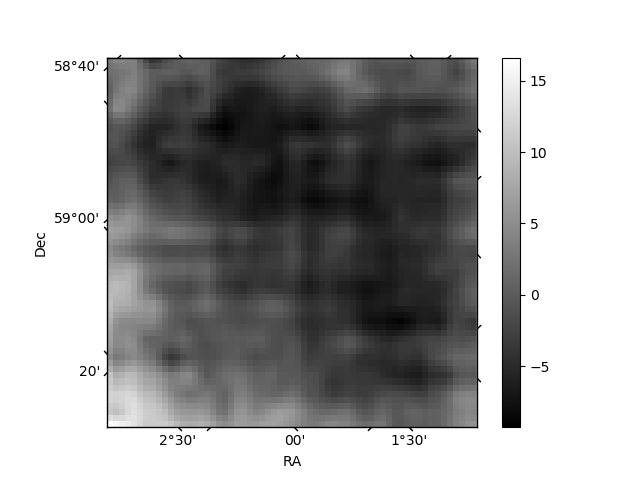
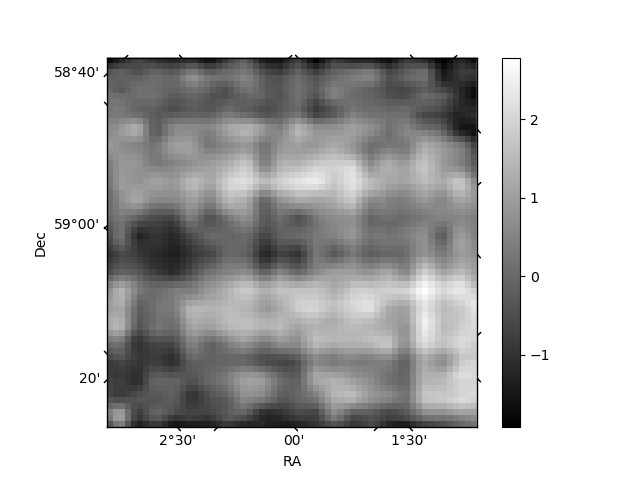
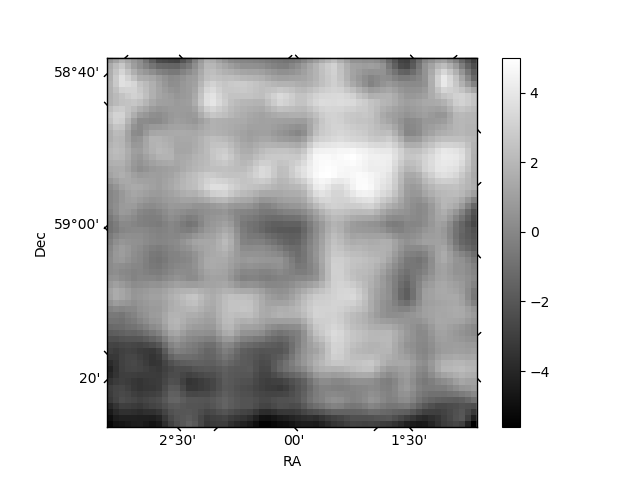
Histogram calculated using DETX and DETY for each event in the final _common_clean file
| Quadrant A | 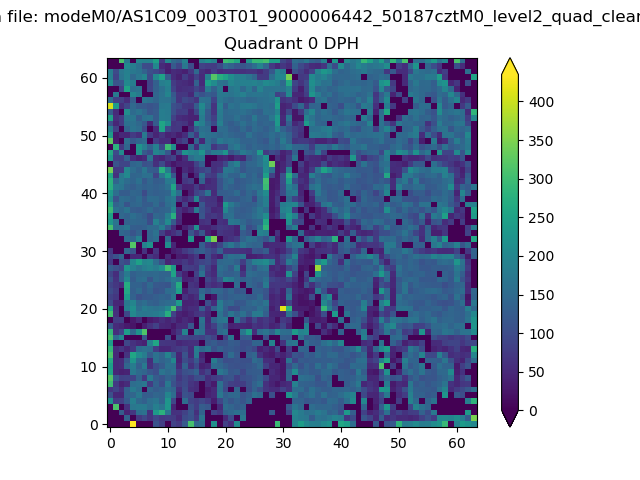 |
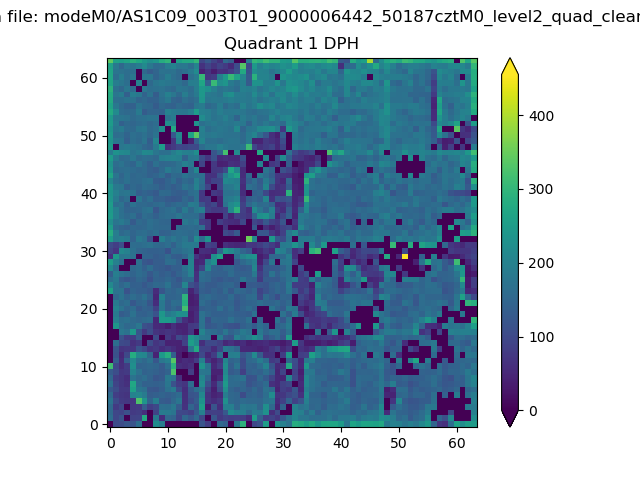 |
Quadrant B |
|---|---|---|---|
| Quadrant D | 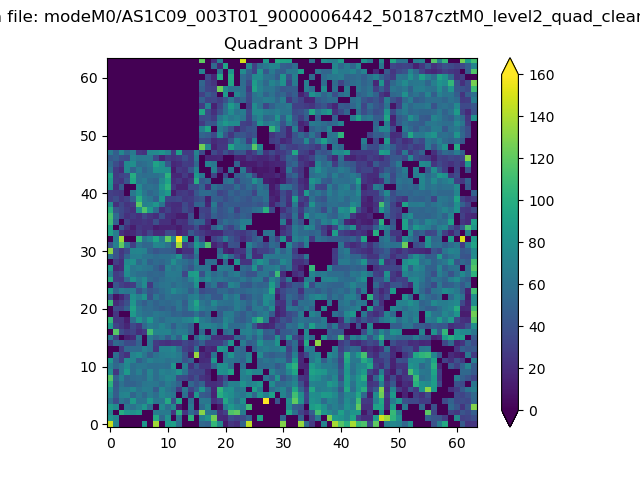 |
 |
Quadrant C |
| Plot type | Count rate plots | Images |
|---|---|---|
| Comparison with Poisson distribution Blue bars denote a histogram of data divided into 1 sec bins. Red curve is a Poisson curve with rate = median count rate of data. |
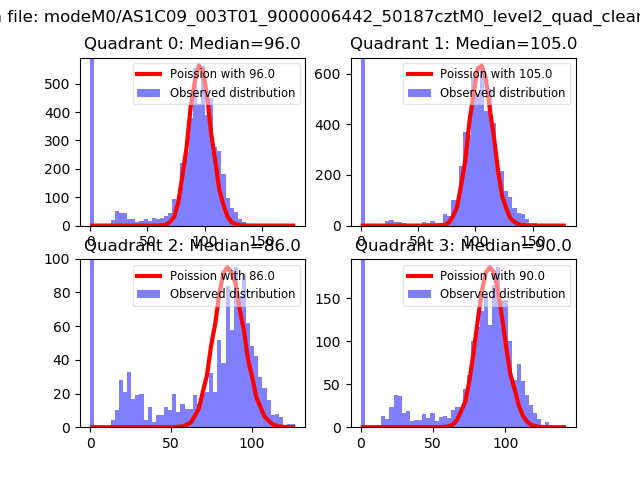 |
 |
| Quadrant-wise count rates Data is divided into 100 sec bins |
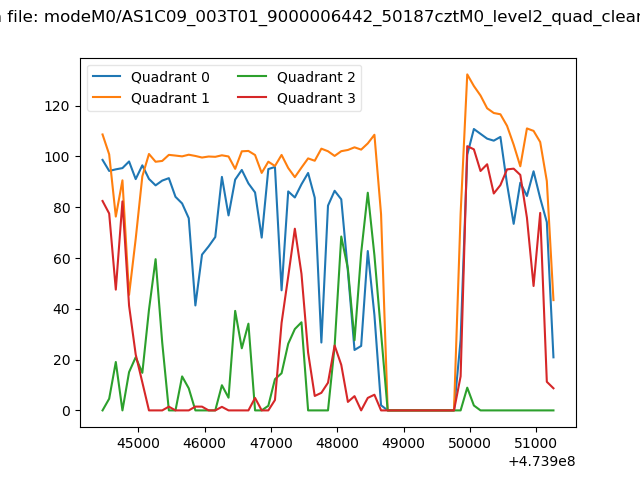 |
|
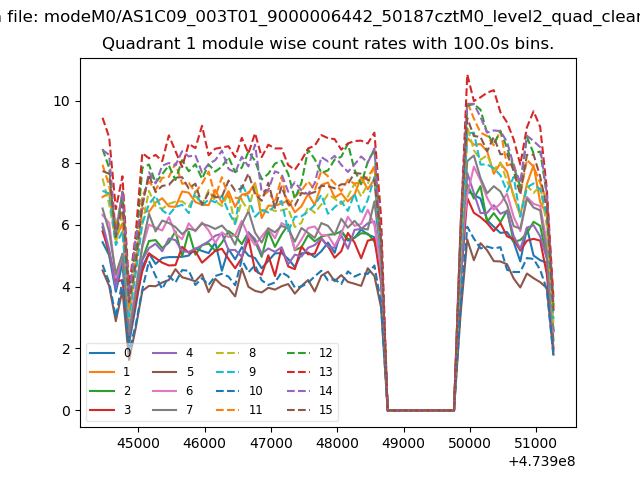
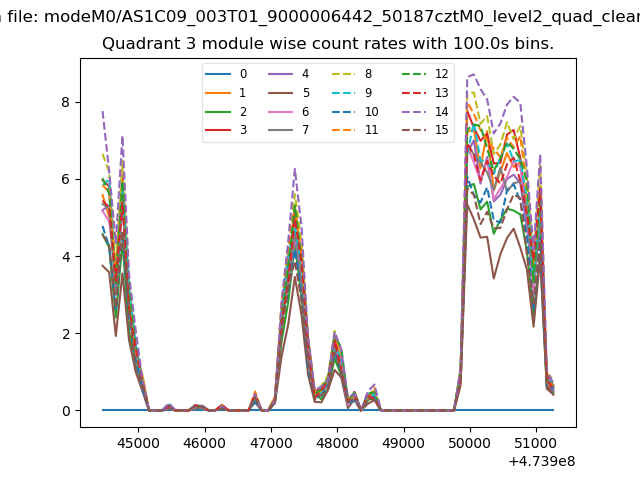
| Module-wise count rates for Quadrant A Data is divided into 100 sec bins |
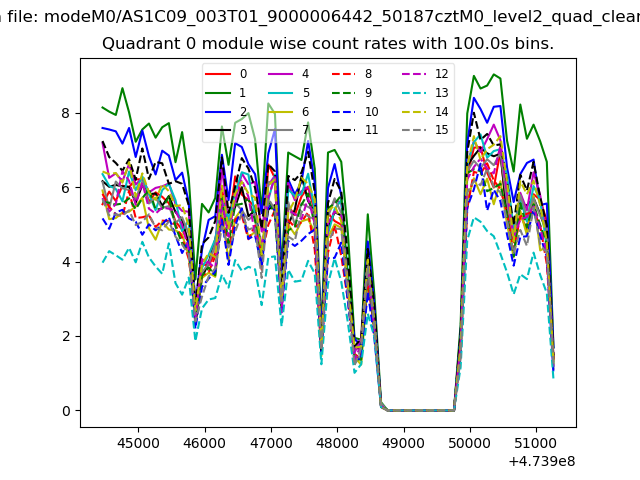 |
 |
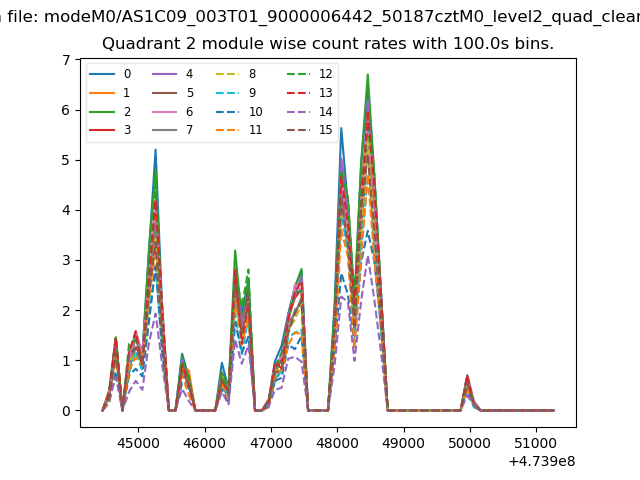
| Module-wise count rates for Quadrant B Data is divided into 100 sec bins |
 |
 |
| Module-wise count rates for Quadrant C Data is divided into 100 sec bins |
 |
 |
| Module-wise count rates for Quadrant D Data is divided into 100 sec bins |
 |
 |
| Parameter | Plot |
|---|---|
| CZT HV Monitor |  |
| D_VDD | 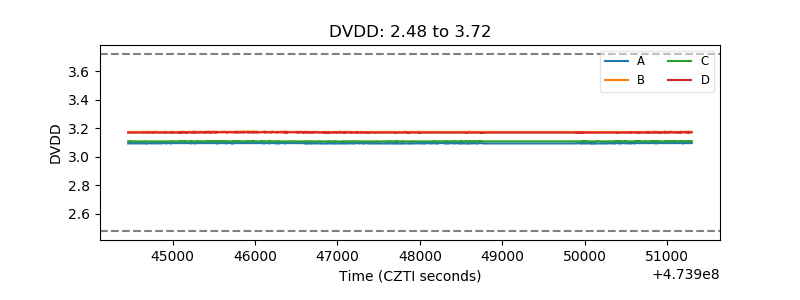 |
| Temperature 1 | 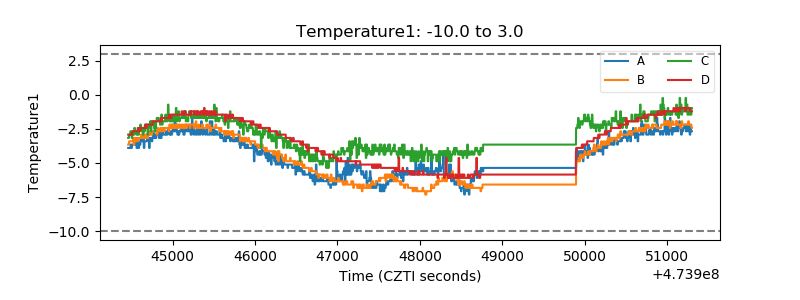 |
| Veto HV Monitor | 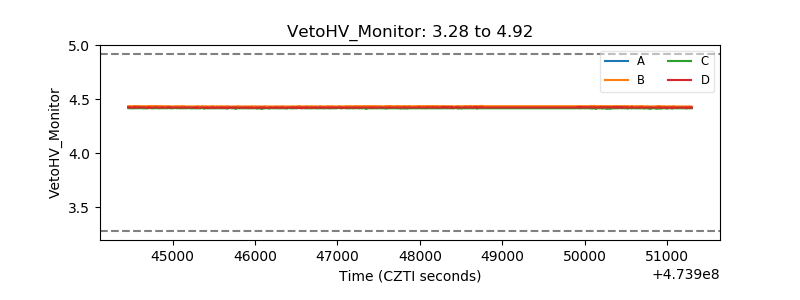 |
| Veto LLD | 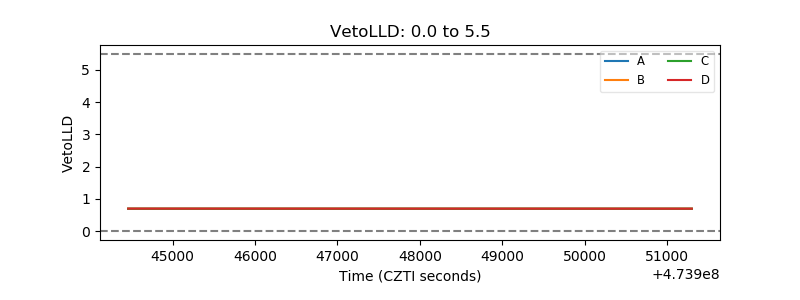 |
| Alpha Counter | 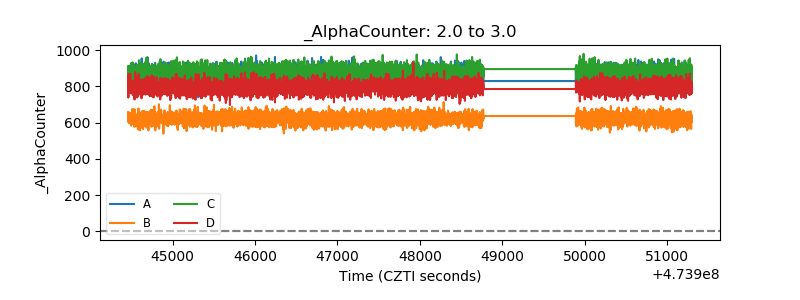 |
| _CPM_Rate | 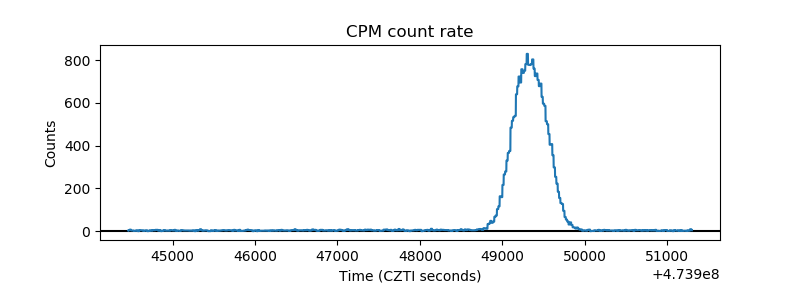 |
| CZT Counter | 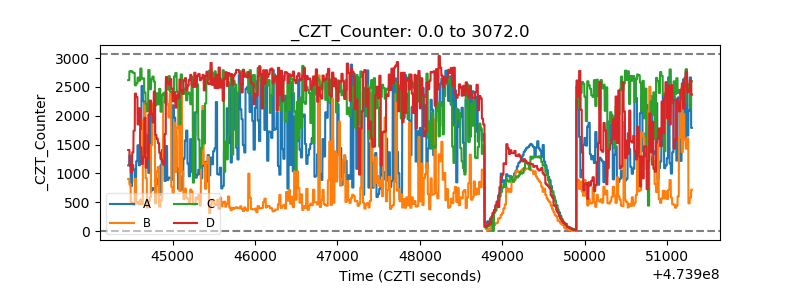 |
| +2.5 Volts monitor | 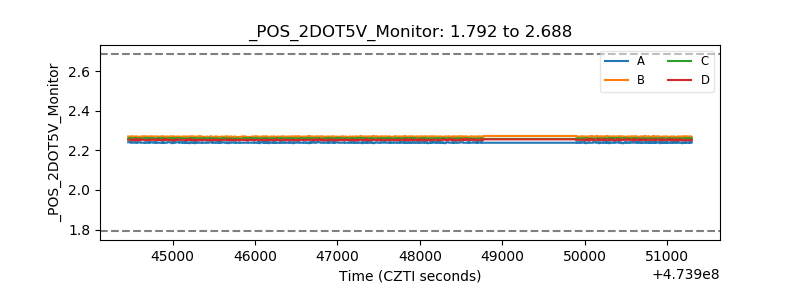 |
| +5 Volts monitor |  |
| _ROLL_ROT | 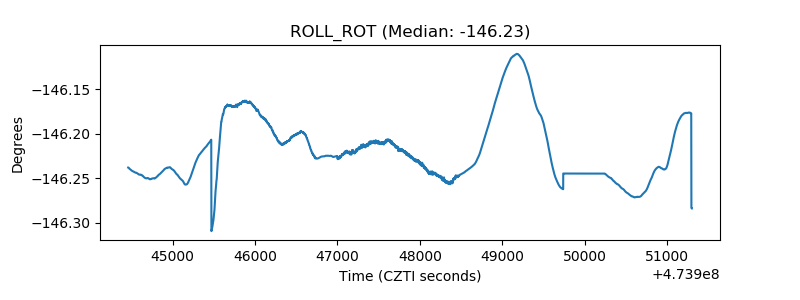 |
| _Roll_DEC | 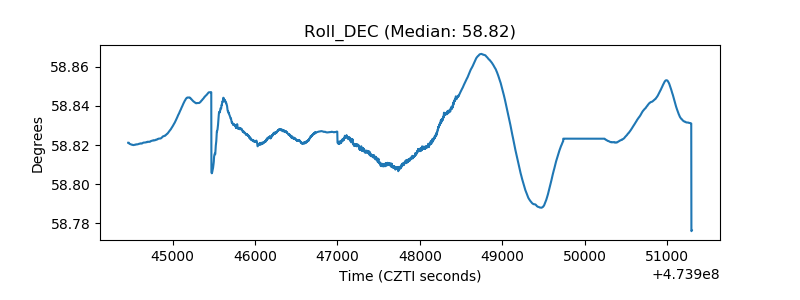 |
| _Roll_RA | 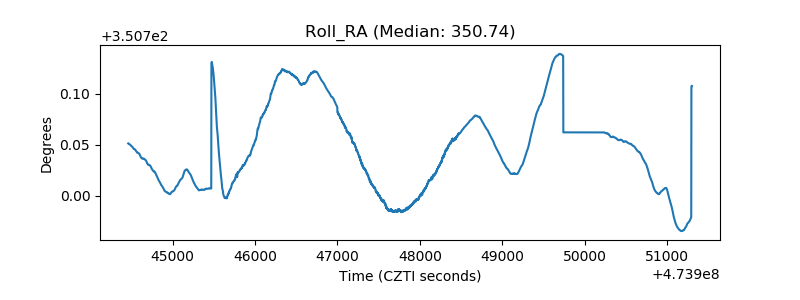 |
| Veto Counter | 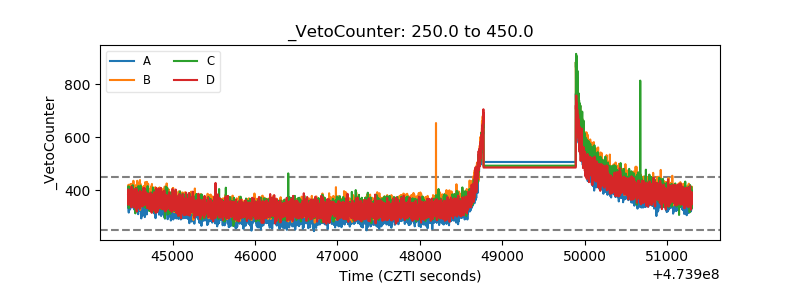 |