| Param | Original file | Final file |
|---|---|---|
| Filename | modeM0/AS1C09_003T01_9000006442_50188cztM0_level2.fits | modeM0/AS1C09_003T01_9000006442_50188cztM0_level2_quad_clean.evt |
| Size (bytes) | 1,079,579,520 | 66,360,960 |
| Size | 1.0 GB | 63.3 MB |
| Events in quadrant A | 8,093,803 | 546,003 |
| Events in quadrant B | 4,322,382 | 665,401 |
| Events in quadrant C | 13,867,802 | 87,736 |
| Events in quadrant D | 13,190,639 | 267,661 |
| Mode M9 | |||
|---|---|---|---|
| Quadrant | BADHDUFLAG | Total packets | Discarded packets |
| A | 0 | 11 | 0 |
| B | 0 | 11 | 0 |
| C | 0 | 11 | 0 |
| D | 0 | 11 | 0 |
| Mode M0 | |||
|---|---|---|---|
| Quadrant | BADHDUFLAG | Total packets | Discarded packets |
| A | 0 | 28513 | 4 |
| B | 0 | 17198 | 1 |
| C | 0 | 45544 | 1 |
| D | 0 | 43512 | 1 |
| Mode SS | |||
|---|---|---|---|
| Quadrant | BADHDUFLAG | Total packets | Discarded packets |
| A | 0 | 130 | 0 |
| B | 0 | 130 | 0 |
| C | 0 | 130 | 0 |
| D | 0 | 130 | 0 |
| Quadrant | Total seconds | Saturated seconds | Saturation percentage |
|---|---|---|---|
| A | 6330 | 1148 | 18.135861% |
| B | 6330 | 282 | 4.454976% |
| C | 6332 | 5492 | 86.734049% |
| D | 6332 | 3714 | 58.654454% |
Noise dominated data is calculated using 1-second bins in cleaned event files. If a bin has >2000 counts, and if more than 50% of those come from <1% of pixels, then it is considered to be noise-dominated and hence unusable.
| Quadrant | # 1 sec bins | Bins with >0 counts | Bins with >2000 counts | High rate bins dominated by noise | Noise dominated (total time) | Noise dominated (detector-on time) | Marked lightcurve |
|---|---|---|---|---|---|---|---|
| A | 7506 | 6332 | 1040 | 1040 | 13.86% | 16.42% | 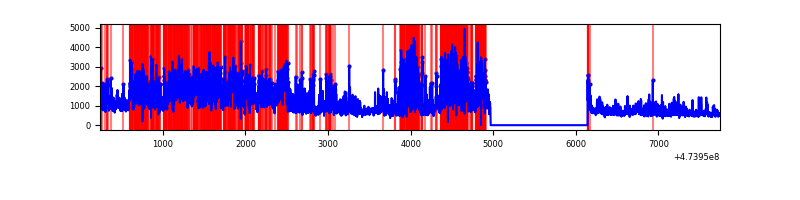 |
| B | 7506 | 6332 | 173 | 173 | 2.30% | 2.73% | 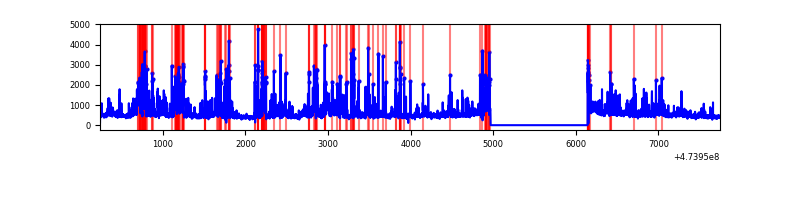 |
| C | 7507 | 6332 | 4416 | 4416 | 58.83% | 69.74% | 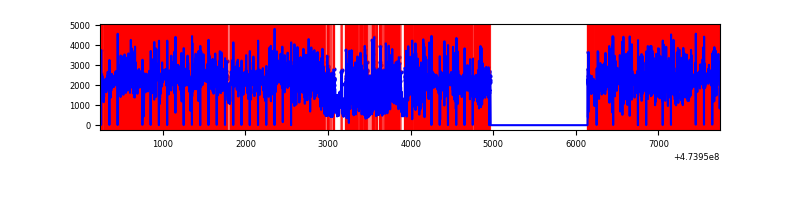 |
| D | 7507 | 6332 | 3608 | 3608 | 48.06% | 56.98% | 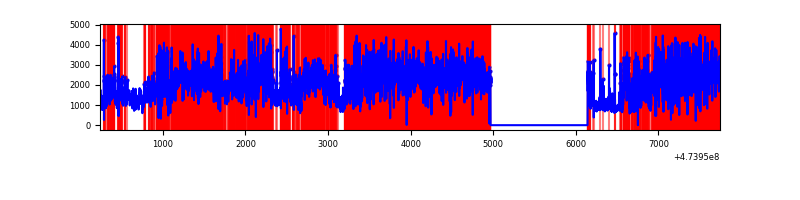 |
Top three noisy pixels from each quadrant. If the there are fewer than three noisy pixels in the level2.evt file, extra rows are filled as -1
| Pixel properties | Quadrant properties | ||||||
|---|---|---|---|---|---|---|---|
| Quadrant | DetID | PixID | Counts | Sigma | Mean | Median | Sigma |
| A | 4 | 4 | 2024696 | 12528.66 | 641 | 626 | 161.6 |
| A | 0 | 98 | 970825 | 6005.37 | 641 | 626 | 161.6 |
| A | 6 | 250 | 893670 | 5527.8 | 641 | 626 | 161.6 |
| B | 4 | 206 | 738191 | 5241.86 | 664 | 640 | 140.7 |
| B | 3 | 249 | 310151 | 2199.73 | 664 | 640 | 140.7 |
| B | 5 | 172 | 123740 | 874.89 | 664 | 640 | 140.7 |
| C | 4 | 111 | 7481857 | 110491.4 | 240 | 239 | 67.7 |
| C | 15 | 213 | 2529279 | 37349.83 | 240 | 239 | 67.7 |
| C | 15 | 230 | 1726051 | 25487.45 | 240 | 239 | 67.7 |
| D | 8 | 192 | 2311806 | 15900.3 | 504 | 486 | 145.4 |
| D | 12 | 6 | 1896743 | 13044.95 | 504 | 486 | 145.4 |
| D | 15 | 185 | 1818551 | 12507.04 | 504 | 486 | 145.4 |
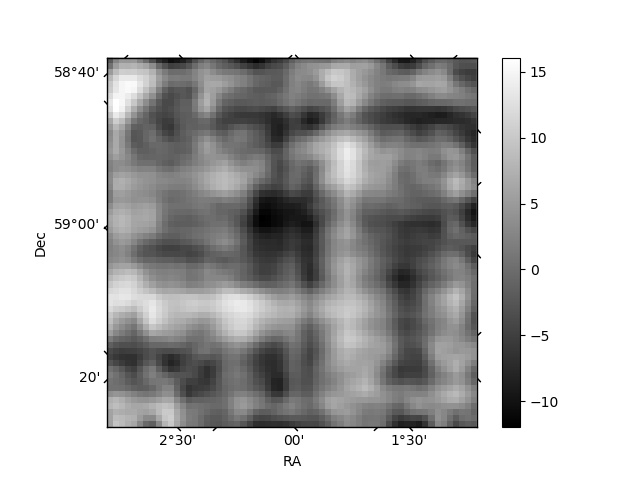
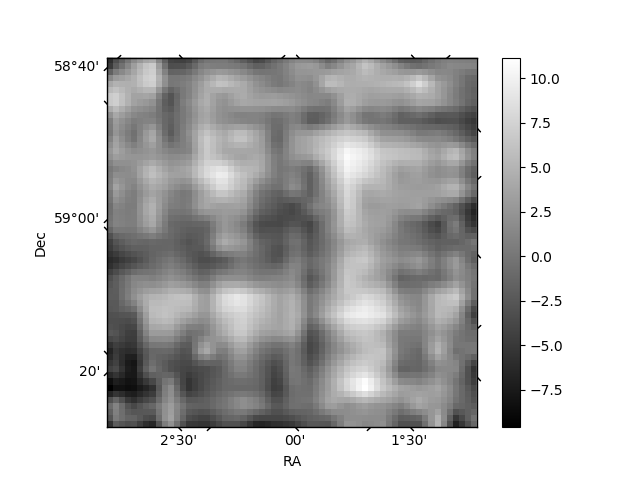
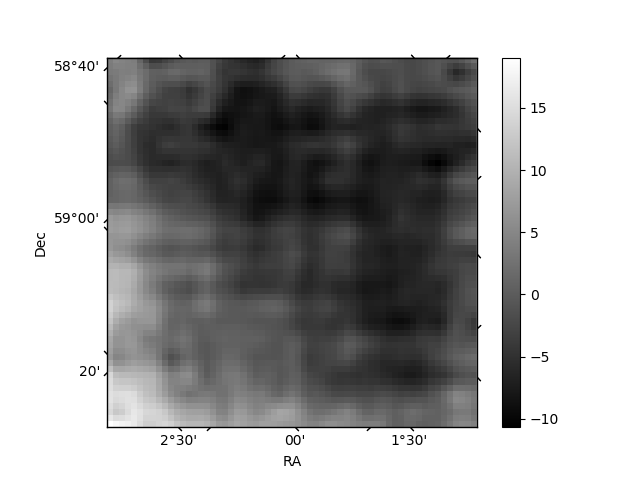
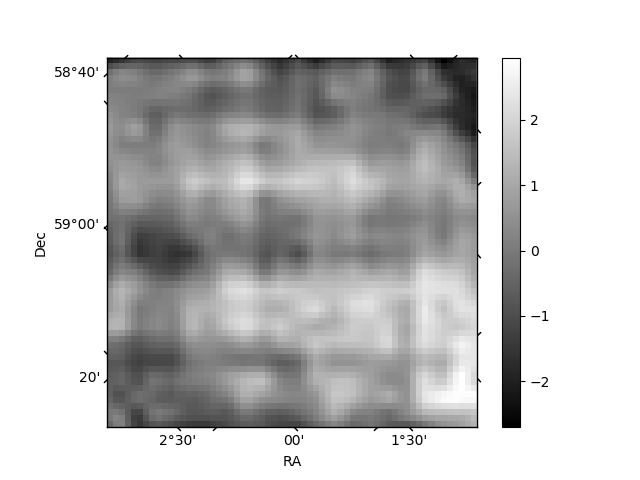
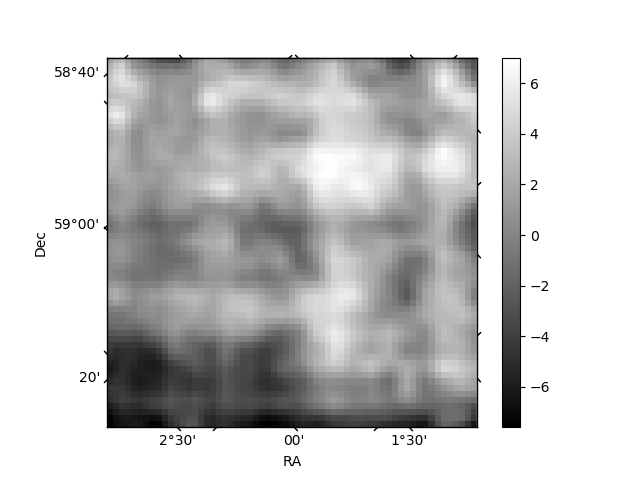
Histogram calculated using DETX and DETY for each event in the final _common_clean file
| Quadrant A | 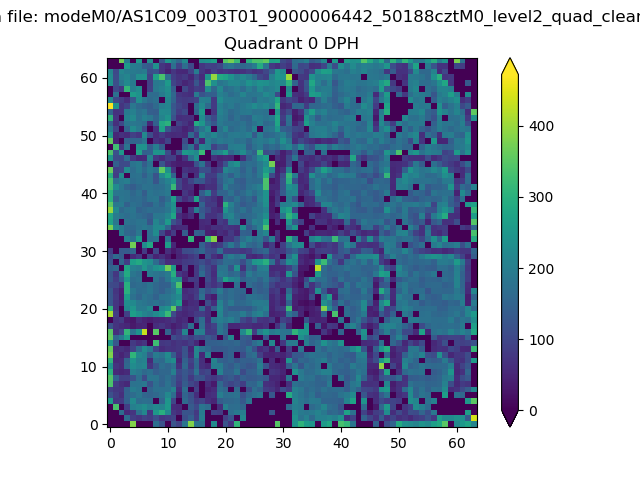 |
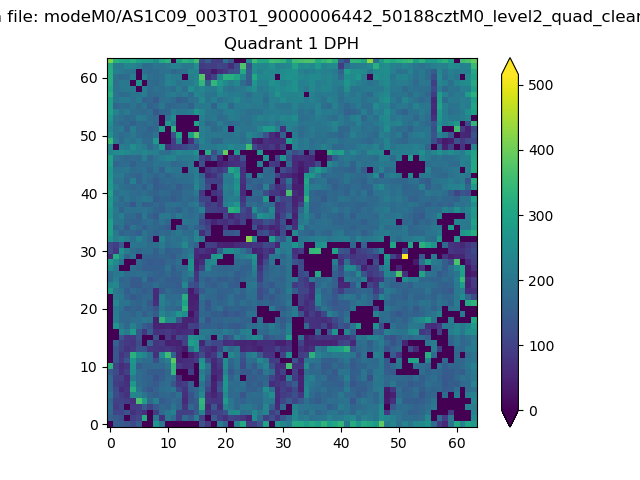 |
Quadrant B |
|---|---|---|---|
| Quadrant D | 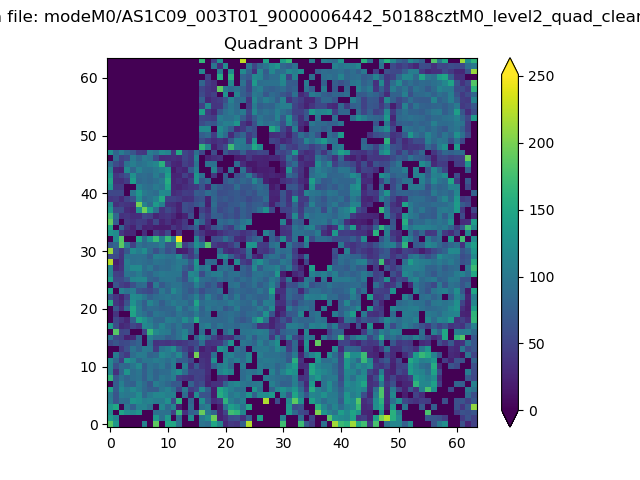 |
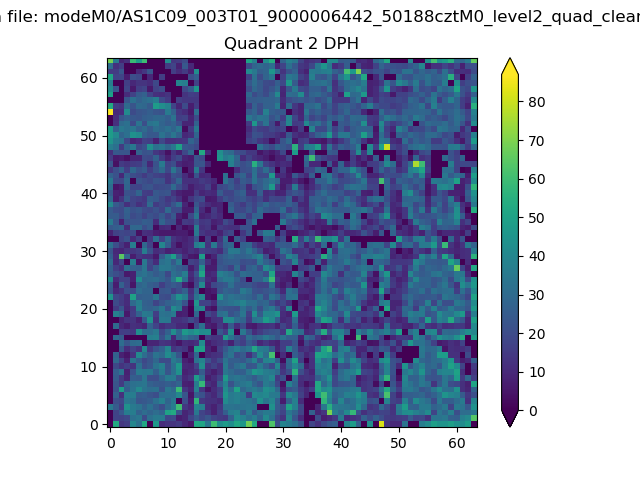 |
Quadrant C |
| Plot type | Count rate plots | Images |
|---|---|---|
| Comparison with Poisson distribution Blue bars denote a histogram of data divided into 1 sec bins. Red curve is a Poisson curve with rate = median count rate of data. |
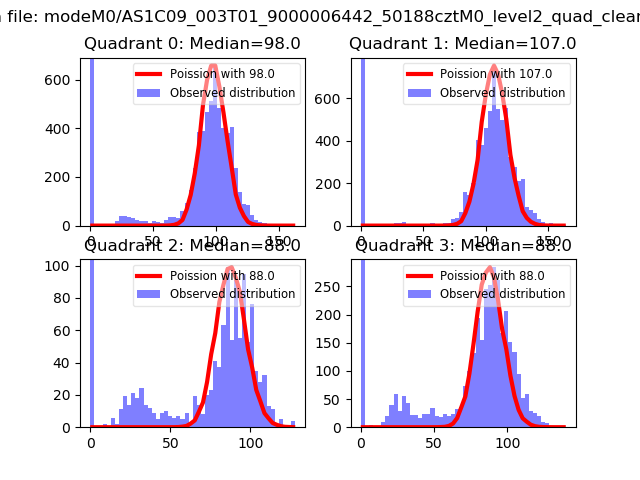 |
 |
| Quadrant-wise count rates Data is divided into 100 sec bins |
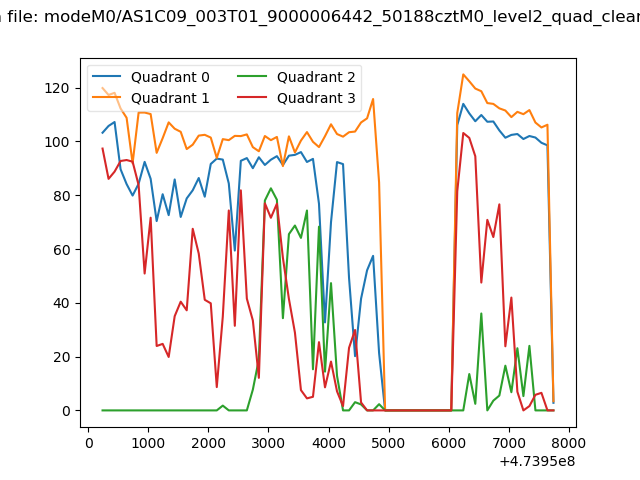 |
|
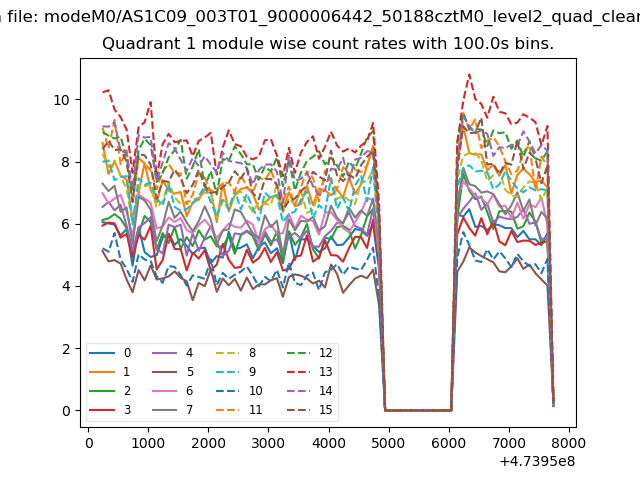
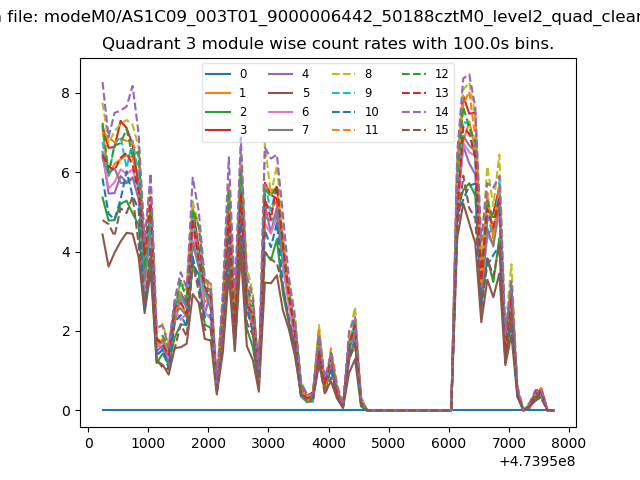
| Module-wise count rates for Quadrant A Data is divided into 100 sec bins |
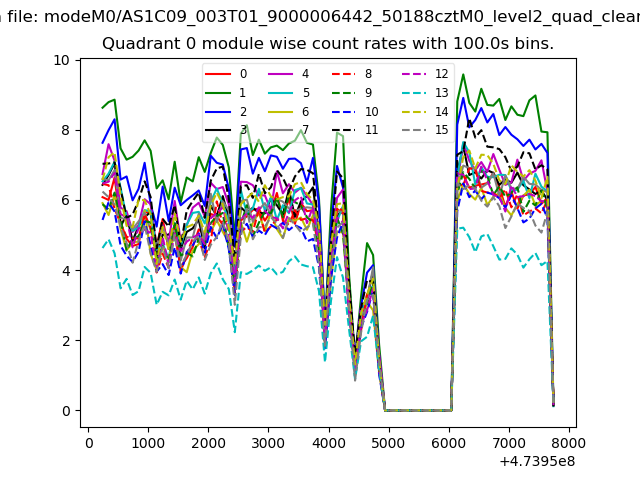 |
 |
| Module-wise count rates for Quadrant B Data is divided into 100 sec bins |
 |
 |
| Module-wise count rates for Quadrant C Data is divided into 100 sec bins |
 |
 |
| Module-wise count rates for Quadrant D Data is divided into 100 sec bins |
 |
 |
| Parameter | Plot |
|---|---|
| CZT HV Monitor | 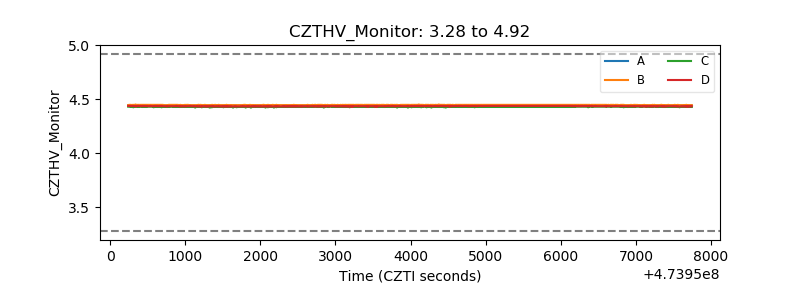 |
| D_VDD | 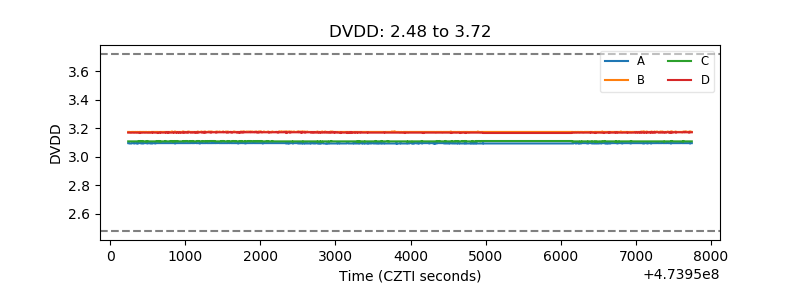 |
| Temperature 1 | 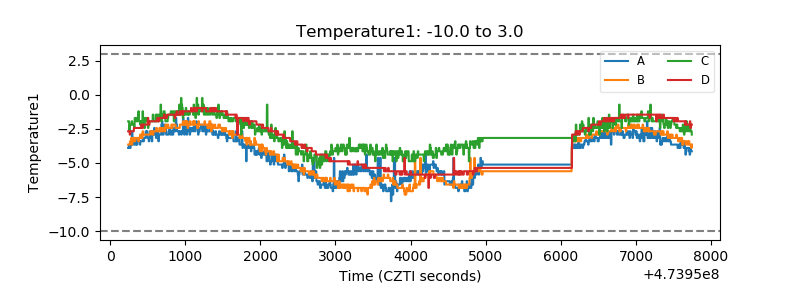 |
| Veto HV Monitor | 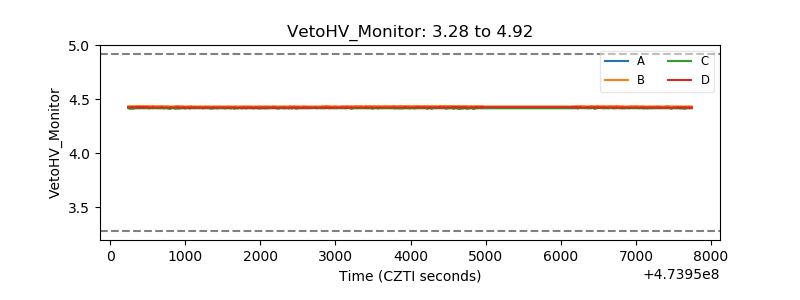 |
| Veto LLD | 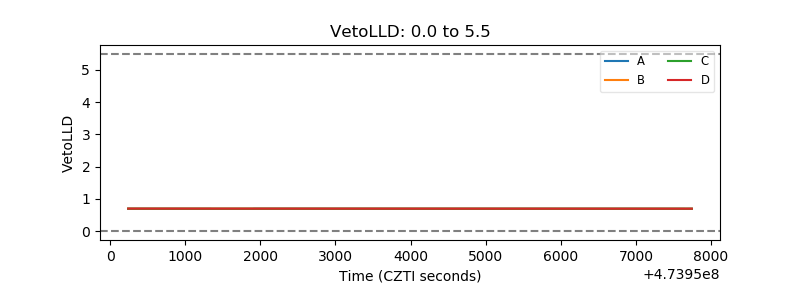 |
| Alpha Counter | 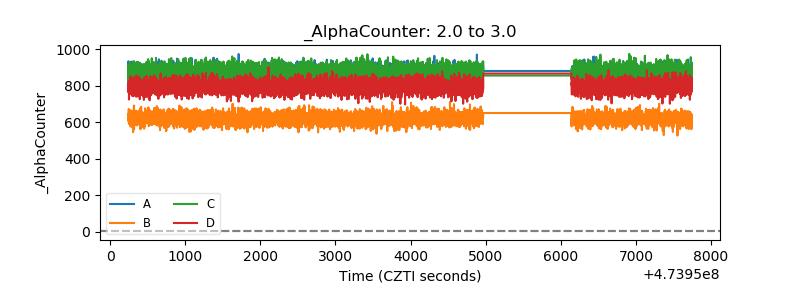 |
| _CPM_Rate | 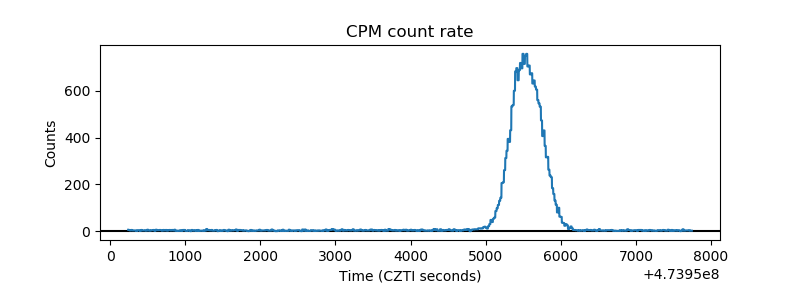 |
| CZT Counter | 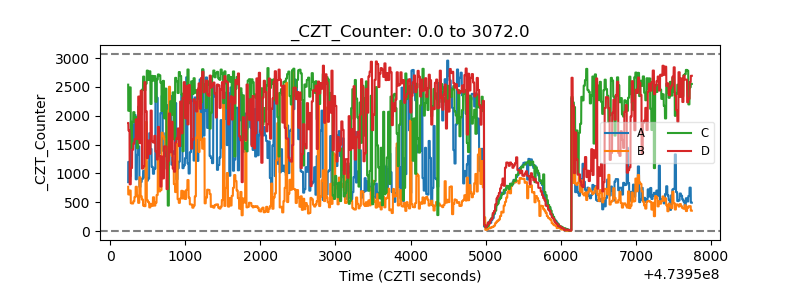 |
| +2.5 Volts monitor |  |
| +5 Volts monitor | 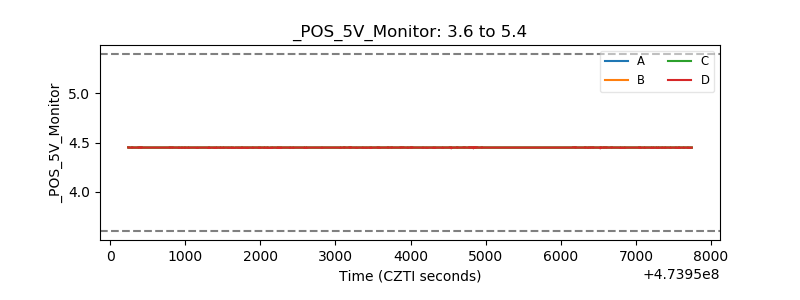 |
| _ROLL_ROT | 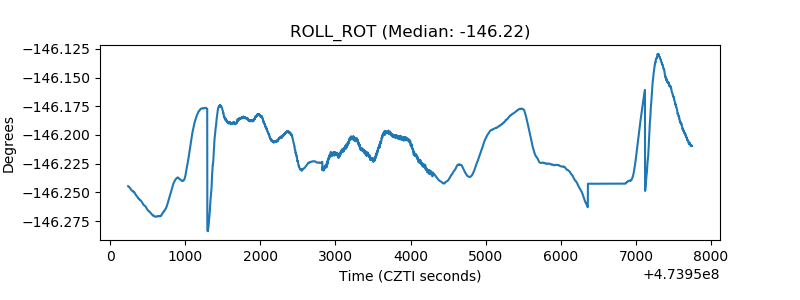 |
| _Roll_DEC | 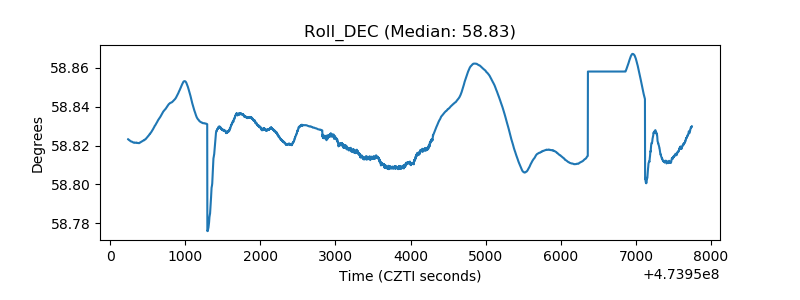 |
| _Roll_RA | 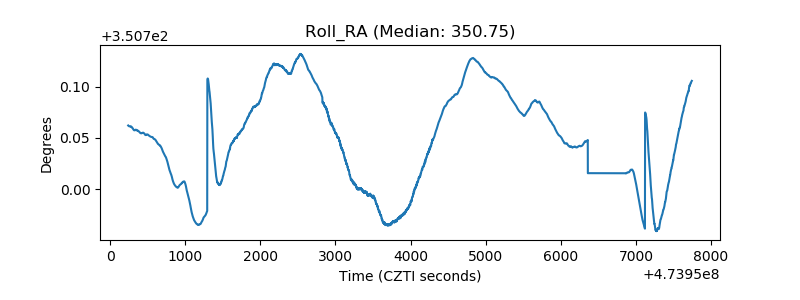 |
| Veto Counter | 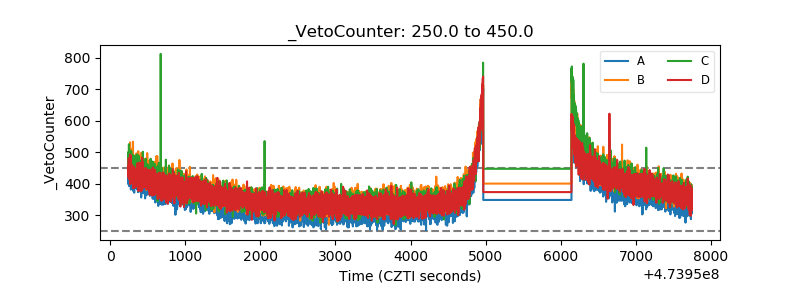 |