| Param | Original file | Final file |
|---|---|---|
| Filename | modeM0/AS1C09_003T01_9000006442_50189cztM0_level2.fits | modeM0/AS1C09_003T01_9000006442_50189cztM0_level2_quad_clean.evt |
| Size (bytes) | 995,238,720 | 56,854,080 |
| Size | 949.1 MB | 54.2 MB |
| Events in quadrant A | 6,355,126 | 478,169 |
| Events in quadrant B | 3,575,172 | 618,820 |
| Events in quadrant C | 13,865,363 | 26,785 |
| Events in quadrant D | 12,590,453 | 186,508 |
| Mode M9 | |||
|---|---|---|---|
| Quadrant | BADHDUFLAG | Total packets | Discarded packets |
| A | 0 | 11 | 0 |
| B | 0 | 11 | 0 |
| C | 0 | 11 | 0 |
| D | 0 | 11 | 0 |
| Mode M0 | |||
|---|---|---|---|
| Quadrant | BADHDUFLAG | Total packets | Discarded packets |
| A | 0 | 22838 | 1 |
| B | 0 | 14673 | 1 |
| C | 0 | 45149 | 1 |
| D | 0 | 41476 | 5 |
| Mode SS | |||
|---|---|---|---|
| Quadrant | BADHDUFLAG | Total packets | Discarded packets |
| A | 0 | 120 | 0 |
| B | 0 | 120 | 0 |
| C | 0 | 120 | 0 |
| D | 0 | 120 | 0 |
| Quadrant | Total seconds | Saturated seconds | Saturation percentage |
|---|---|---|---|
| A | 5878 | 1198 | 20.381082% |
| B | 5879 | 169 | 2.874639% |
| C | 5879 | 5648 | 96.070760% |
| D | 5878 | 4071 | 69.258251% |
Noise dominated data is calculated using 1-second bins in cleaned event files. If a bin has >2000 counts, and if more than 50% of those come from <1% of pixels, then it is considered to be noise-dominated and hence unusable.
| Quadrant | # 1 sec bins | Bins with >0 counts | Bins with >2000 counts | High rate bins dominated by noise | Noise dominated (total time) | Noise dominated (detector-on time) | Marked lightcurve |
|---|---|---|---|---|---|---|---|
| A | 7003 | 5879 | 982 | 982 | 14.02% | 16.70% | 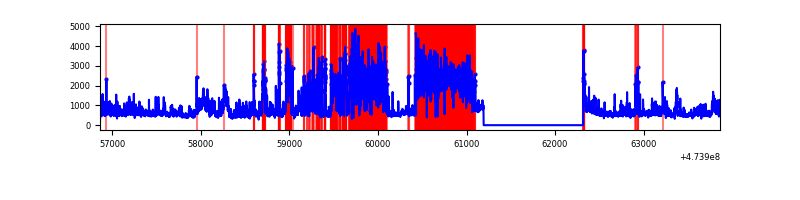 |
| B | 7004 | 5880 | 51 | 51 | 0.73% | 0.87% | 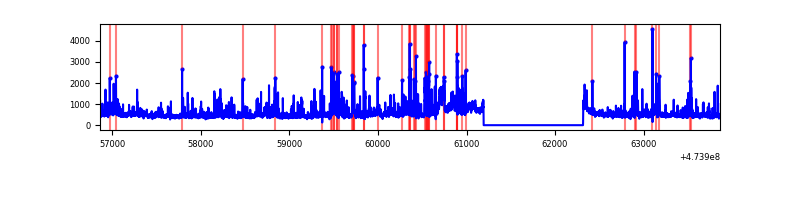 |
| C | 7004 | 5879 | 4847 | 4847 | 69.20% | 82.45% | 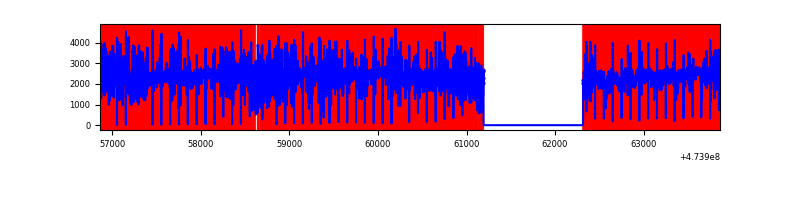 |
| D | 7003 | 5879 | 3552 | 3552 | 50.72% | 60.42% | 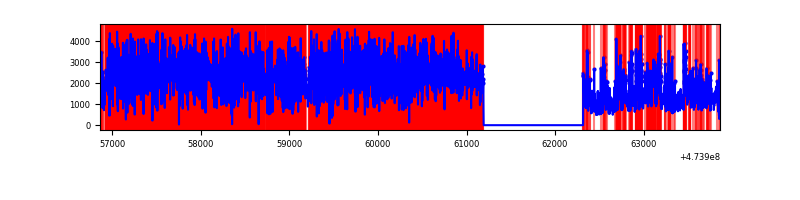 |
Top three noisy pixels from each quadrant. If the there are fewer than three noisy pixels in the level2.evt file, extra rows are filled as -1
| Pixel properties | Quadrant properties | ||||||
|---|---|---|---|---|---|---|---|
| Quadrant | DetID | PixID | Counts | Sigma | Mean | Median | Sigma |
| A | 0 | 98 | 2102856 | 14640.16 | 573 | 559 | 143.6 |
| A | 12 | 250 | 420105 | 2921.67 | 573 | 559 | 143.6 |
| A | 4 | 4 | 356675 | 2479.95 | 573 | 559 | 143.6 |
| B | 4 | 206 | 372385 | 2877.34 | 617 | 596 | 129.2 |
| B | 5 | 172 | 134286 | 1034.65 | 617 | 596 | 129.2 |
| B | 3 | 249 | 107678 | 828.73 | 617 | 596 | 129.2 |
| C | 4 | 111 | 8901863 | 175731.23 | 176 | 175 | 50.7 |
| C | 15 | 230 | 1419787 | 28025.04 | 176 | 175 | 50.7 |
| C | 15 | 213 | 1059903 | 20920.45 | 176 | 175 | 50.7 |
| D | 12 | 6 | 3635295 | 30846.4 | 407 | 391 | 117.8 |
| D | 8 | 192 | 1819811 | 15439.9 | 407 | 391 | 117.8 |
| D | 15 | 185 | 1150035 | 9756.07 | 407 | 391 | 117.8 |
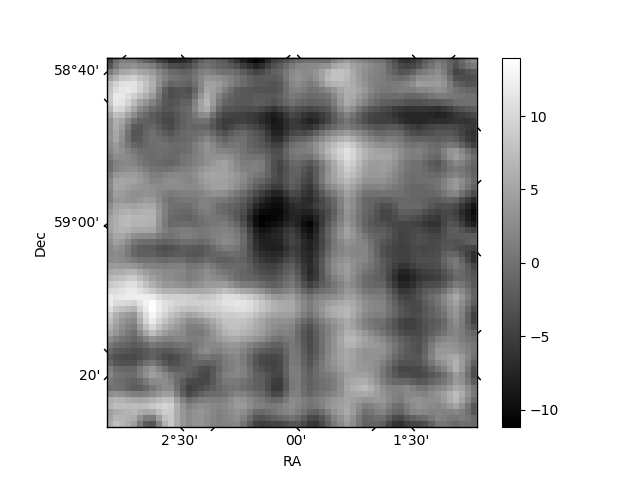
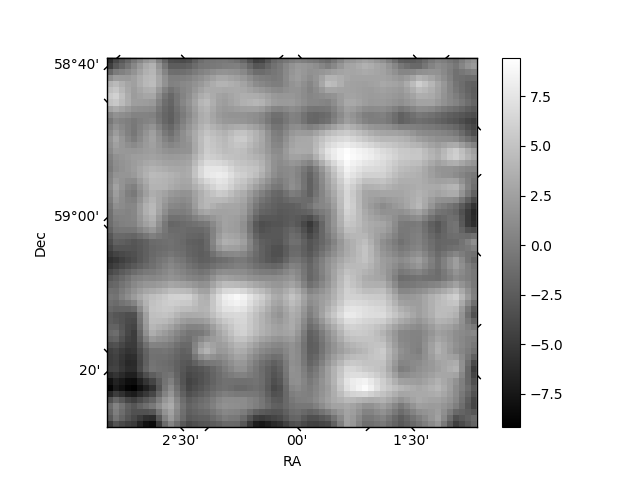
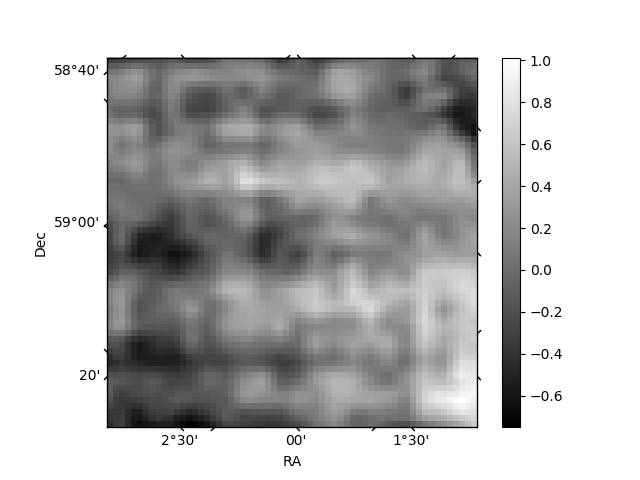
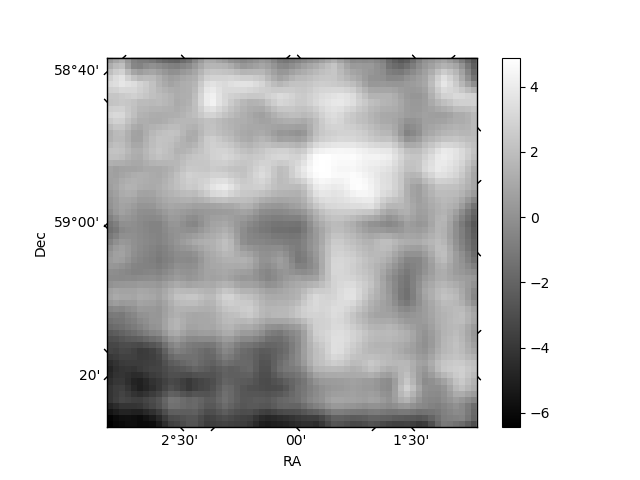
Histogram calculated using DETX and DETY for each event in the final _common_clean file
| Quadrant A | 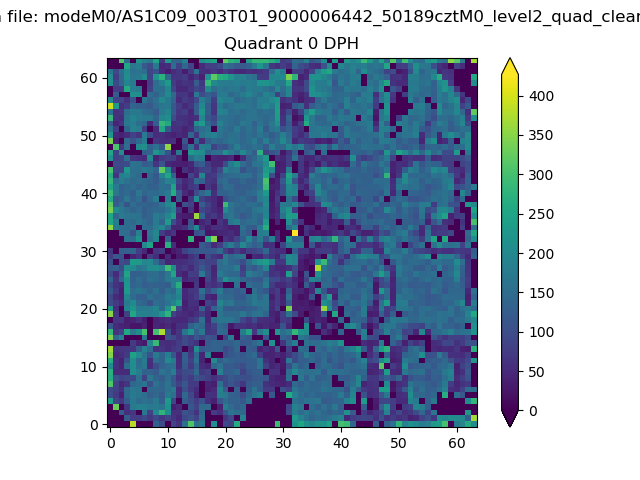 |
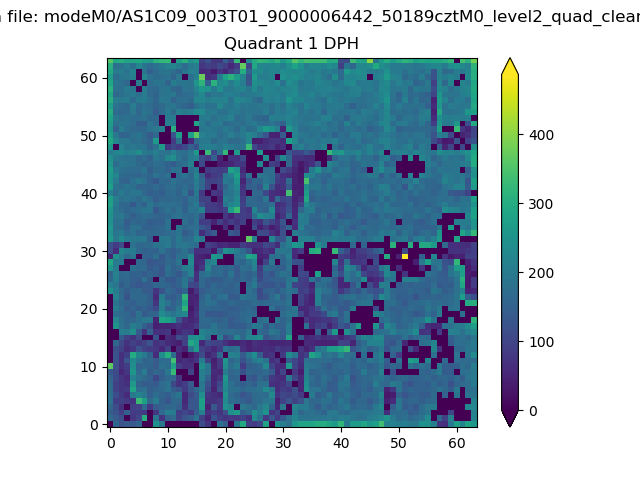 |
Quadrant B |
|---|---|---|---|
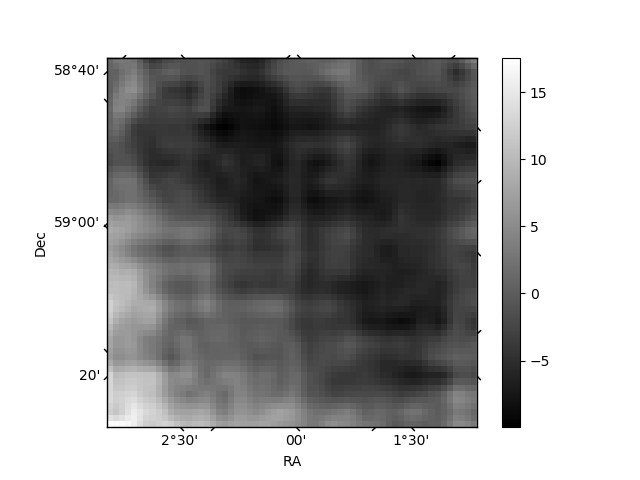
| Quadrant D | 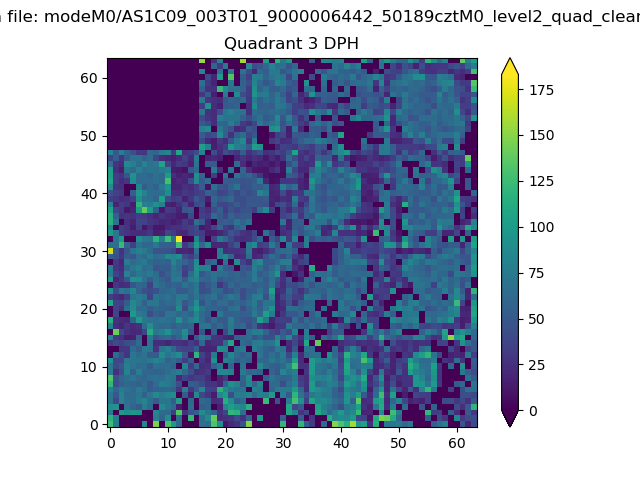 |
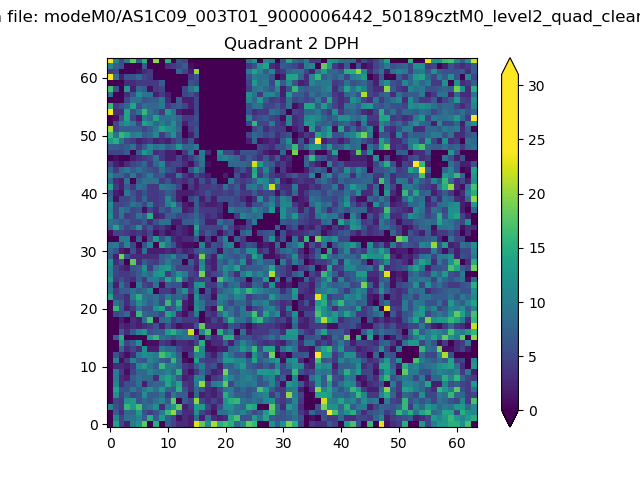 |
Quadrant C |
| Plot type | Count rate plots | Images |
|---|---|---|
| Comparison with Poisson distribution Blue bars denote a histogram of data divided into 1 sec bins. Red curve is a Poisson curve with rate = median count rate of data. |
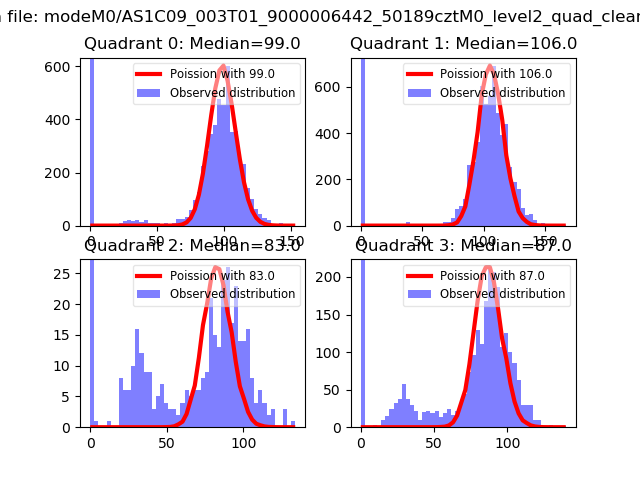 |
 |
| Quadrant-wise count rates Data is divided into 100 sec bins |
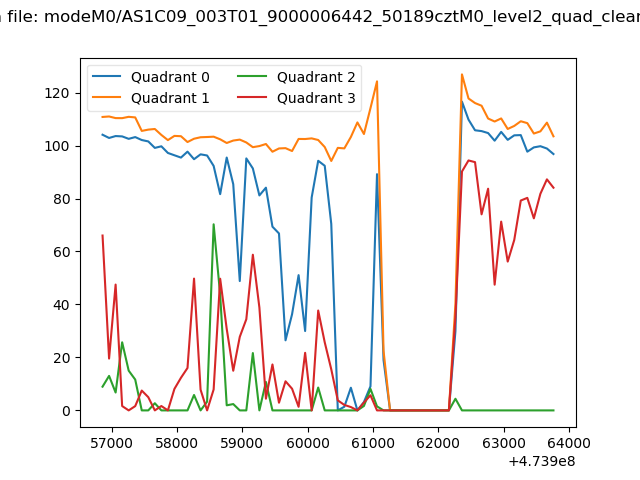 |
|
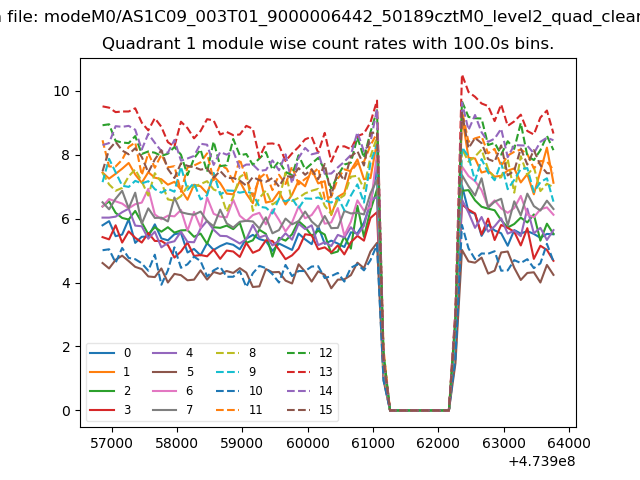
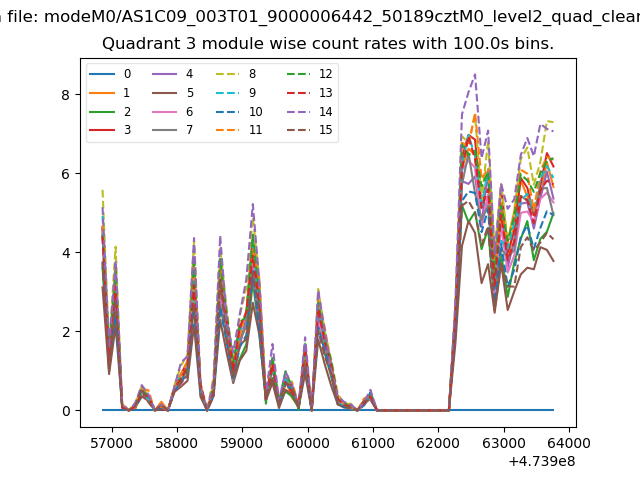
| Module-wise count rates for Quadrant A Data is divided into 100 sec bins |
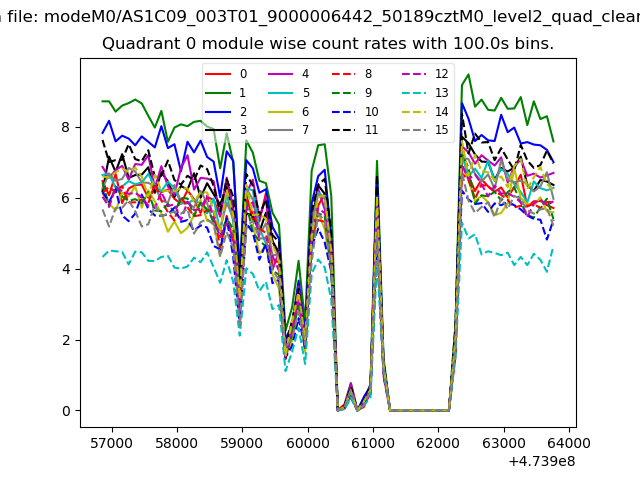 |
 |
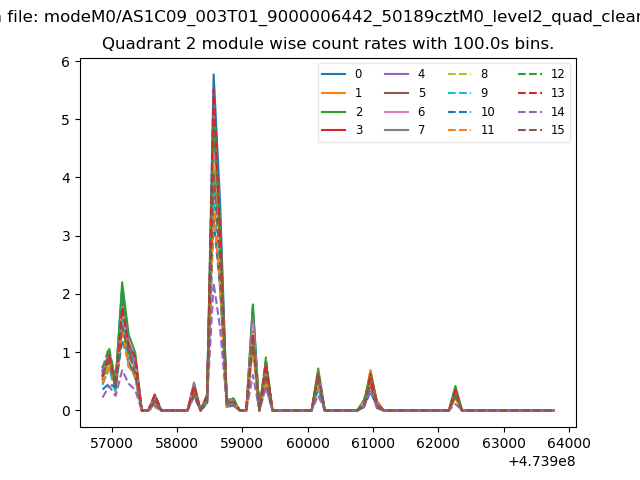
| Module-wise count rates for Quadrant B Data is divided into 100 sec bins |
 |
 |
| Module-wise count rates for Quadrant C Data is divided into 100 sec bins |
 |
 |
| Module-wise count rates for Quadrant D Data is divided into 100 sec bins |
 |
 |
| Parameter | Plot |
|---|---|
| CZT HV Monitor | 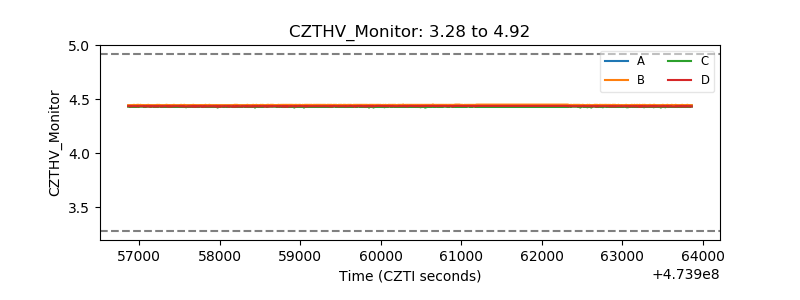 |
| D_VDD | 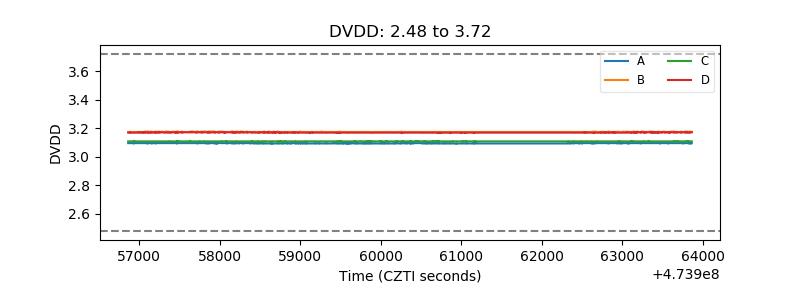 |
| Temperature 1 | 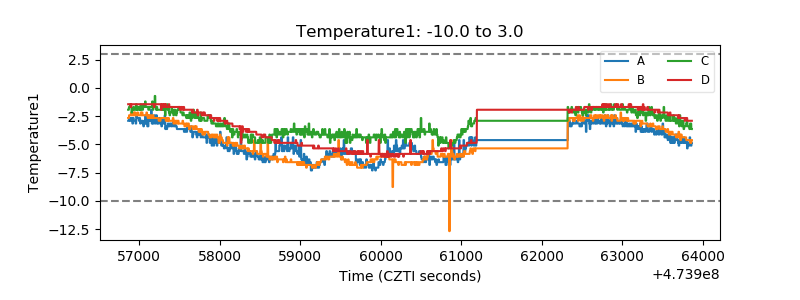 |
| Veto HV Monitor | 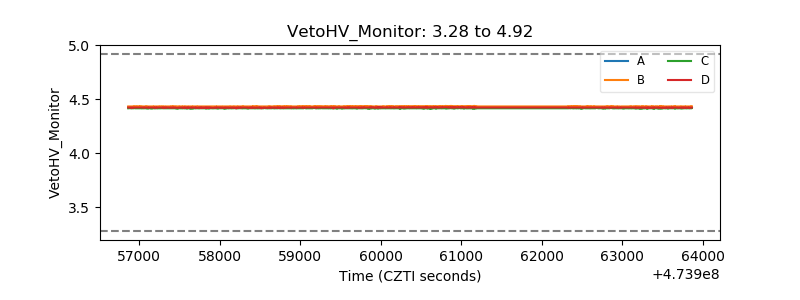 |
| Veto LLD | 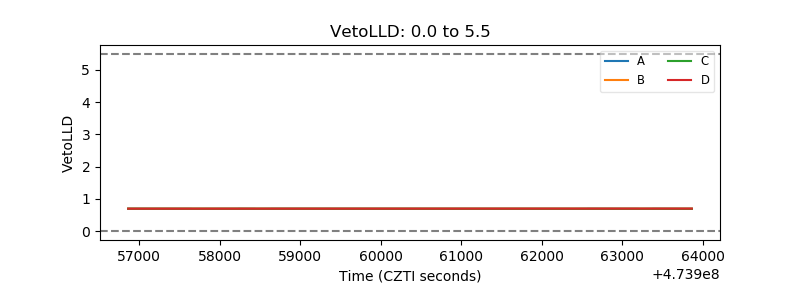 |
| Alpha Counter | 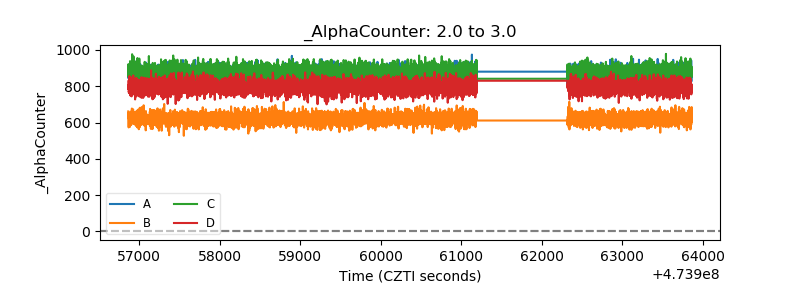 |
| _CPM_Rate | 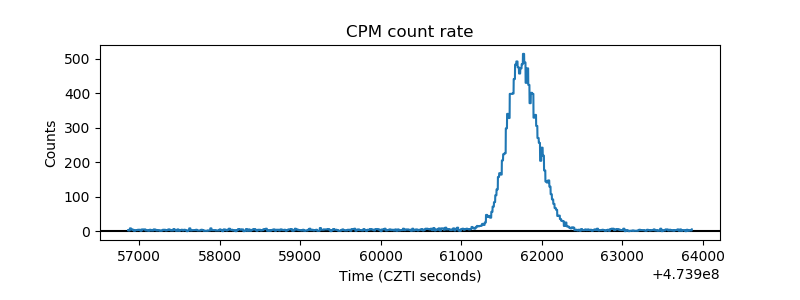 |
| CZT Counter | 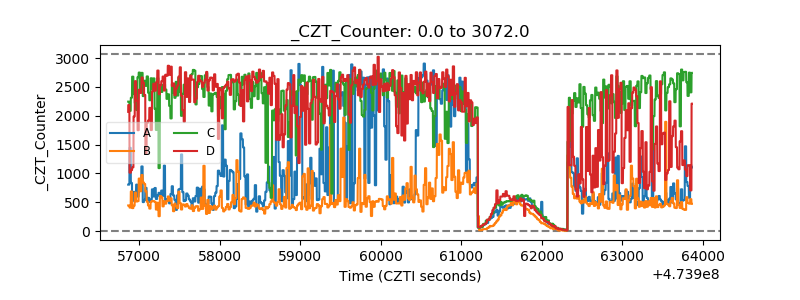 |
| +2.5 Volts monitor |  |
| +5 Volts monitor | 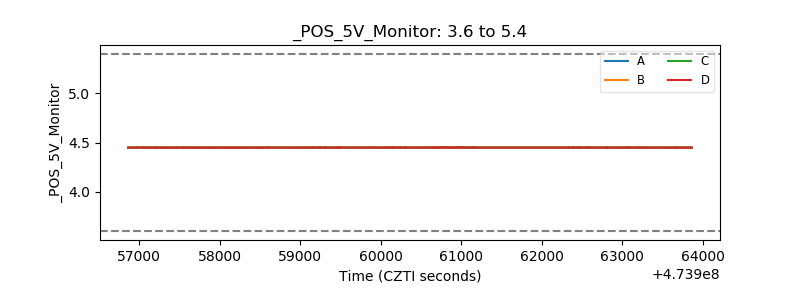 |
| _ROLL_ROT | 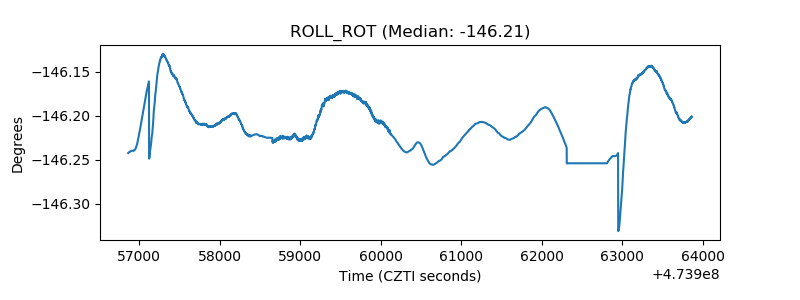 |
| _Roll_DEC | 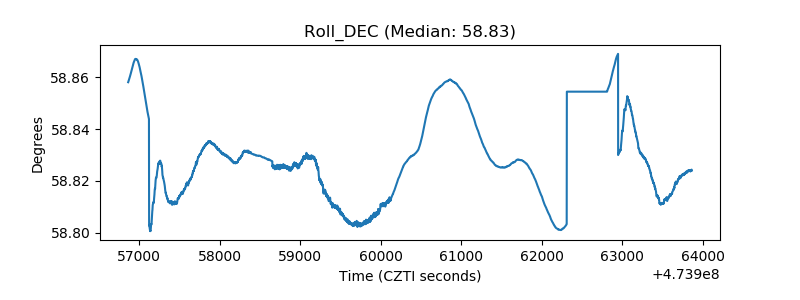 |
| _Roll_RA | 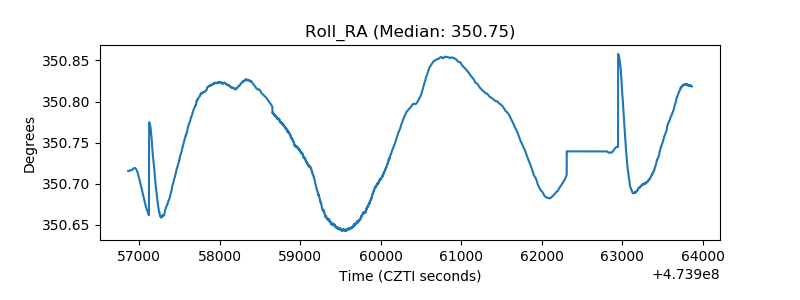 |
| Veto Counter | 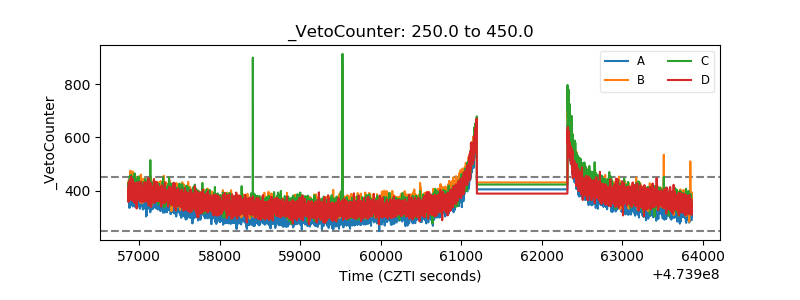 |