| Param | Original file | Final file |
|---|---|---|
| Filename | modeM0/AS1C09_003T01_9000006442_50191cztM0_level2.fits | modeM0/AS1C09_003T01_9000006442_50191cztM0_level2_quad_clean.evt |
| Size (bytes) | 1,109,646,720 | 63,673,920 |
| Size | 1.0 GB | 60.7 MB |
| Events in quadrant A | 8,039,892 | 473,071 |
| Events in quadrant B | 6,682,366 | 562,332 |
| Events in quadrant C | 14,789,607 | 33,702 |
| Events in quadrant D | 11,053,972 | 397,568 |
| Mode M9 | |||
|---|---|---|---|
| Quadrant | BADHDUFLAG | Total packets | Discarded packets |
| A | 0 | 7 | 0 |
| B | 0 | 7 | 0 |
| C | 0 | 7 | 0 |
| D | 0 | 7 | 0 |
| Mode M0 | |||
|---|---|---|---|
| Quadrant | BADHDUFLAG | Total packets | Discarded packets |
| A | 0 | 28378 | 1 |
| B | 0 | 24488 | 1 |
| C | 0 | 48385 | 1 |
| D | 0 | 37444 | 1 |
| Mode SS | |||
|---|---|---|---|
| Quadrant | BADHDUFLAG | Total packets | Discarded packets |
| A | 0 | 134 | 0 |
| B | 0 | 134 | 0 |
| C | 0 | 134 | 0 |
| D | 0 | 134 | 0 |
| Quadrant | Total seconds | Saturated seconds | Saturation percentage |
|---|---|---|---|
| A | 6609 | 1739 | 26.312604% |
| B | 6609 | 1257 | 19.019519% |
| C | 6609 | 6289 | 95.158118% |
| D | 6609 | 2203 | 33.333333% |
Noise dominated data is calculated using 1-second bins in cleaned event files. If a bin has >2000 counts, and if more than 50% of those come from <1% of pixels, then it is considered to be noise-dominated and hence unusable.
| Quadrant | # 1 sec bins | Bins with >0 counts | Bins with >2000 counts | High rate bins dominated by noise | Noise dominated (total time) | Noise dominated (detector-on time) | Marked lightcurve |
|---|---|---|---|---|---|---|---|
| A | 7244 | 6610 | 1430 | 1430 | 19.74% | 21.63% | 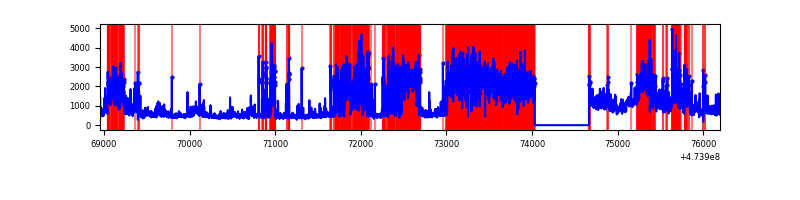 |
| B | 7244 | 6610 | 863 | 863 | 11.91% | 13.06% | 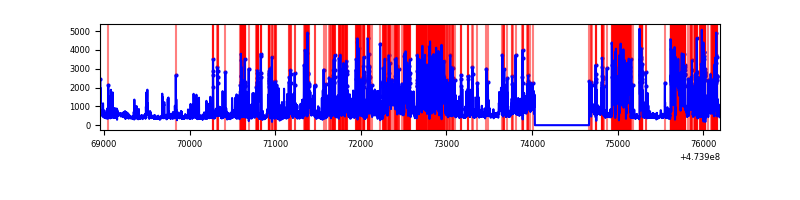 |
| C | 7243 | 6608 | 4884 | 4884 | 67.43% | 73.91% | 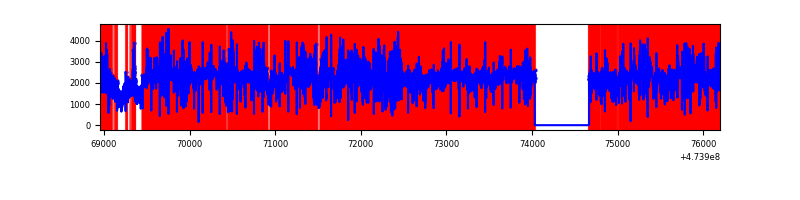 |
| D | 7244 | 6610 | 2280 | 2280 | 31.47% | 34.49% | 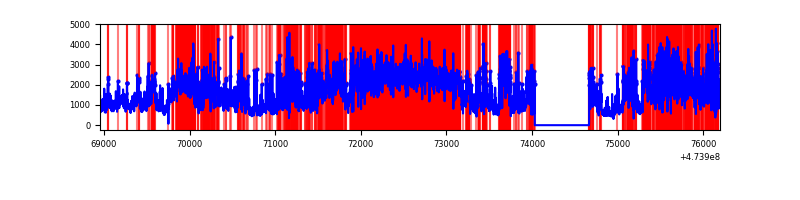 |
Top three noisy pixels from each quadrant. If the there are fewer than three noisy pixels in the level2.evt file, extra rows are filled as -1
| Pixel properties | Quadrant properties | ||||||
|---|---|---|---|---|---|---|---|
| Quadrant | DetID | PixID | Counts | Sigma | Mean | Median | Sigma |
| A | 0 | 98 | 3006427 | 19094.53 | 625 | 609 | 157.4 |
| A | 4 | 4 | 756259 | 4800.28 | 625 | 609 | 157.4 |
| A | 8 | 8 | 583032 | 3699.86 | 625 | 609 | 157.4 |
| B | 4 | 206 | 2825241 | 21227.73 | 627 | 604 | 133.1 |
| B | 12 | 3 | 536701 | 4028.88 | 627 | 604 | 133.1 |
| B | 6 | 255 | 234853 | 1760.43 | 627 | 604 | 133.1 |
| C | 4 | 111 | 10057682 | 195759.18 | 166 | 163 | 51.4 |
| C | 15 | 213 | 2791828 | 54336.86 | 166 | 163 | 51.4 |
| C | 15 | 197 | 575208 | 11192.65 | 166 | 163 | 51.4 |
| D | 15 | 106 | 1733594 | 10238.7 | 598 | 577 | 169.3 |
| D | 15 | 108 | 1558751 | 9205.72 | 598 | 577 | 169.3 |
| D | 8 | 192 | 737164 | 4351.77 | 598 | 577 | 169.3 |
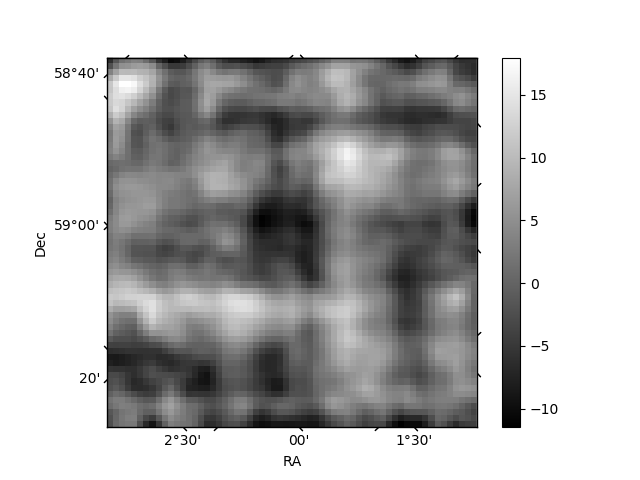
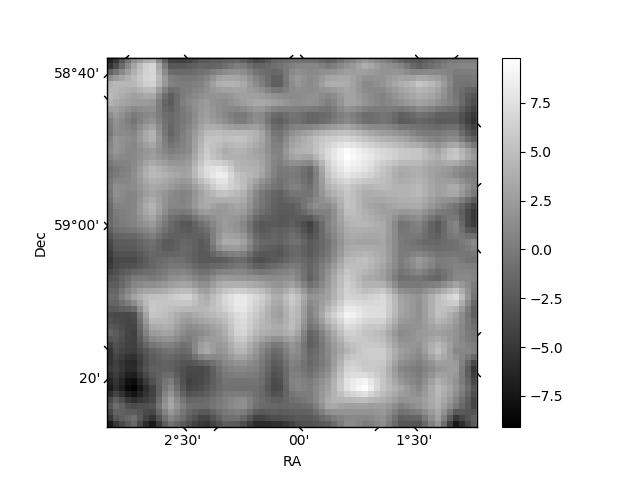
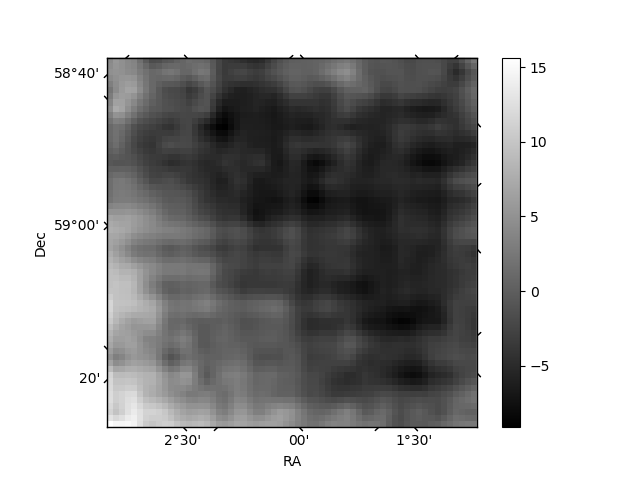
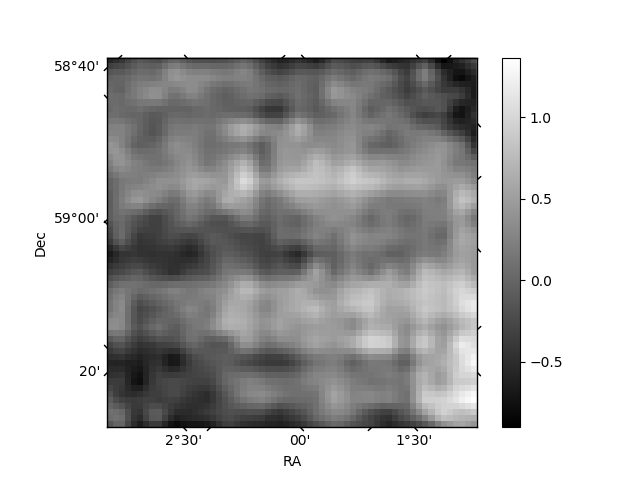
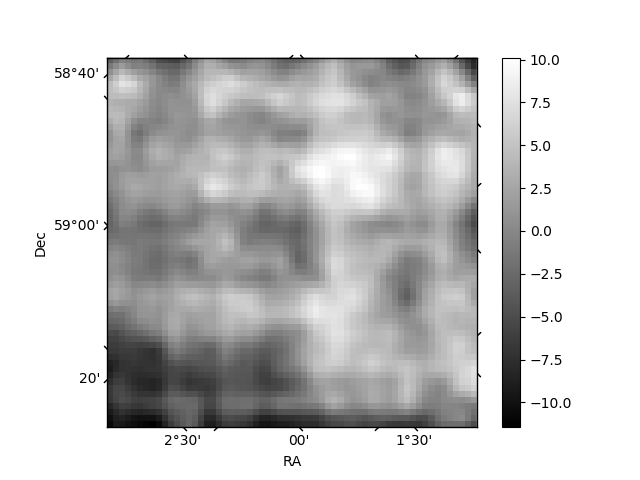
Histogram calculated using DETX and DETY for each event in the final _common_clean file
| Quadrant A | 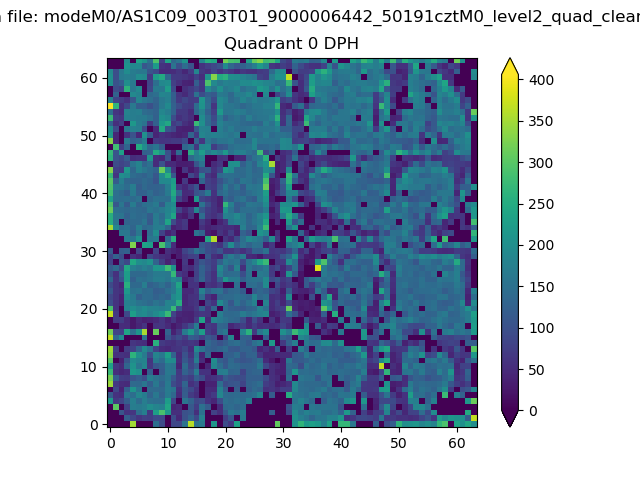 |
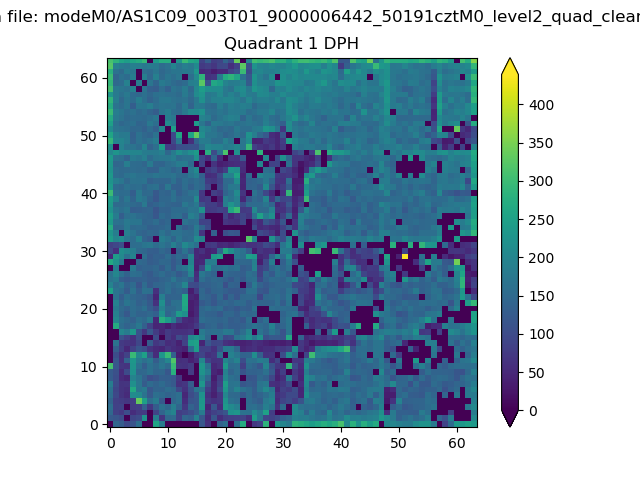 |
Quadrant B |
|---|---|---|---|
| Quadrant D | 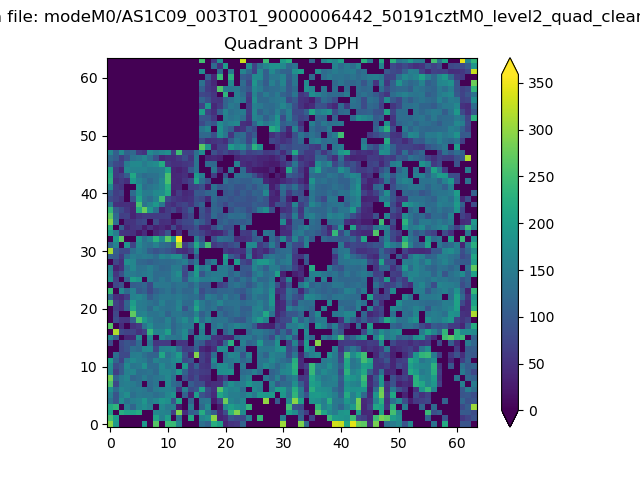 |
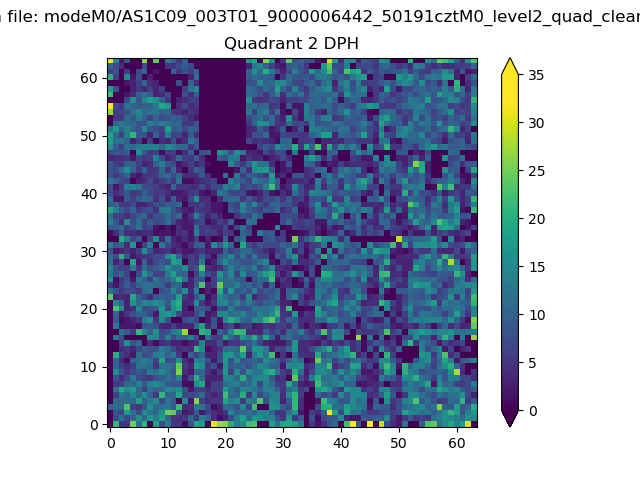 |
Quadrant C |
| Plot type | Count rate plots | Images |
|---|---|---|
| Comparison with Poisson distribution Blue bars denote a histogram of data divided into 1 sec bins. Red curve is a Poisson curve with rate = median count rate of data. |
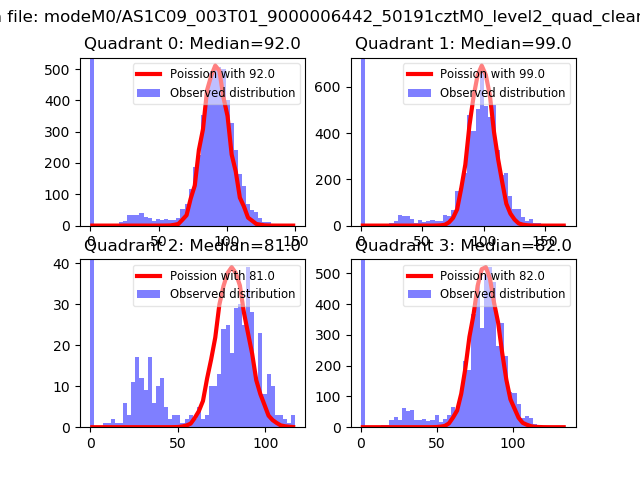 |
 |
| Quadrant-wise count rates Data is divided into 100 sec bins |
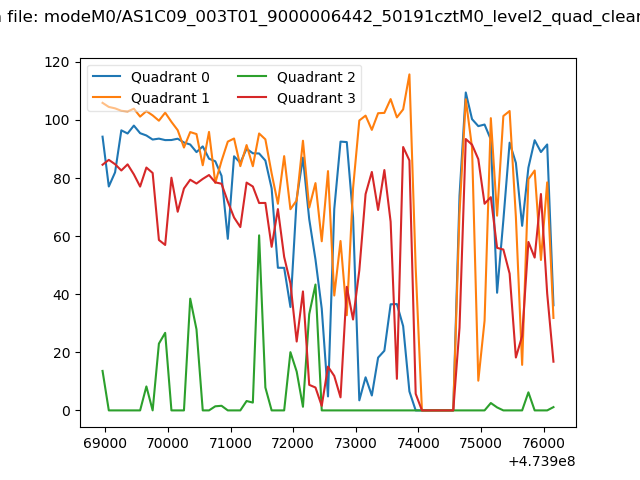 |
|
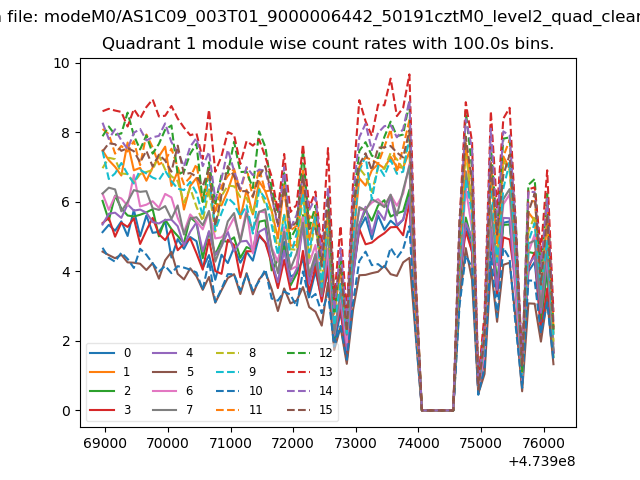
| Module-wise count rates for Quadrant A Data is divided into 100 sec bins |
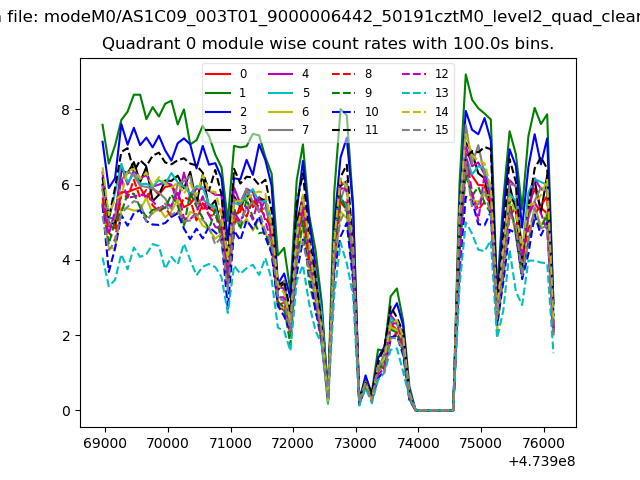 |
 |
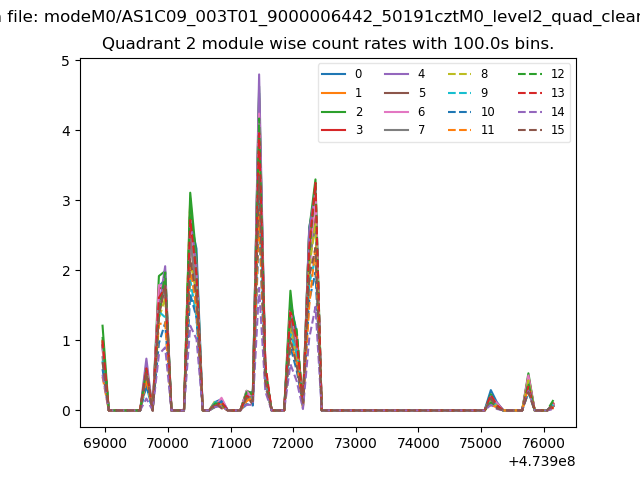
| Module-wise count rates for Quadrant B Data is divided into 100 sec bins |
 |
 |
| Module-wise count rates for Quadrant C Data is divided into 100 sec bins |
 |
 |
| Module-wise count rates for Quadrant D Data is divided into 100 sec bins |
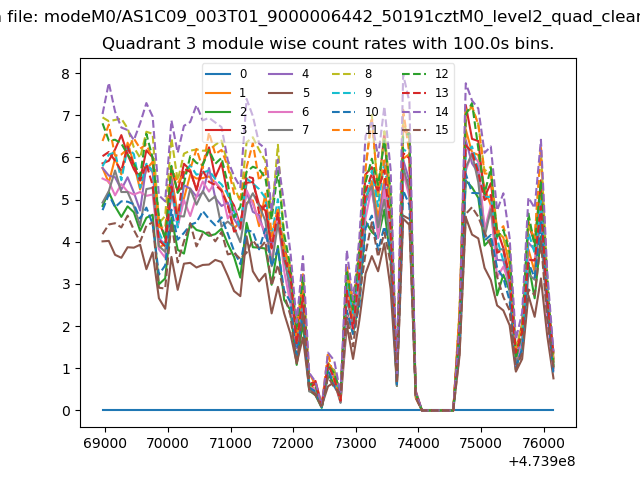 |
 |
| Parameter | Plot |
|---|---|
| CZT HV Monitor | 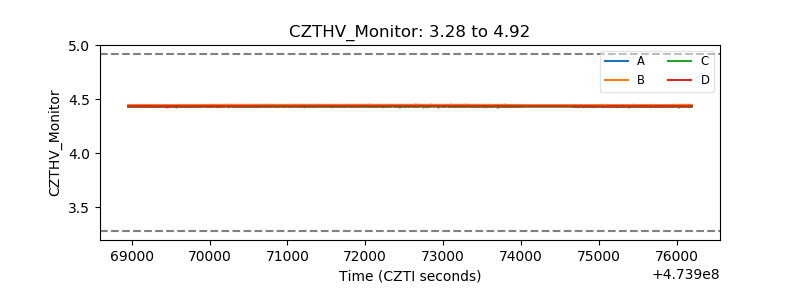 |
| D_VDD | 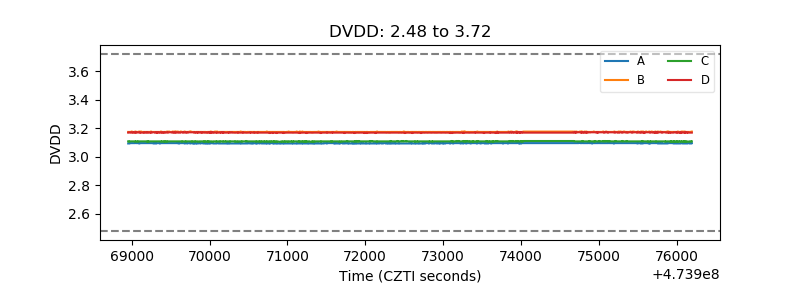 |
| Temperature 1 | 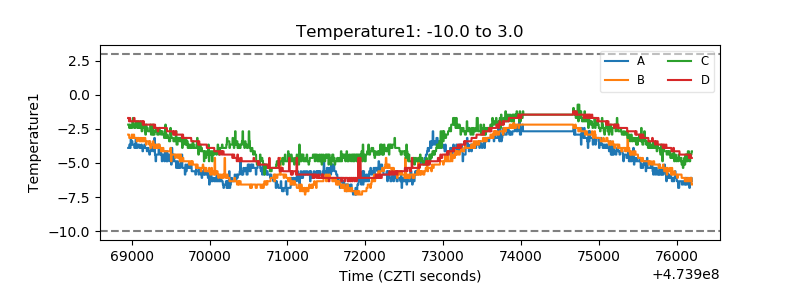 |
| Veto HV Monitor | 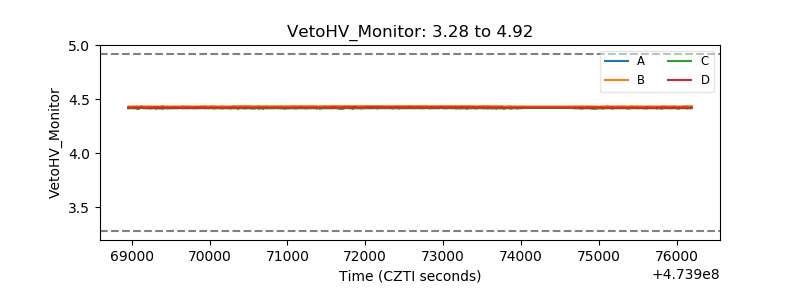 |
| Veto LLD | 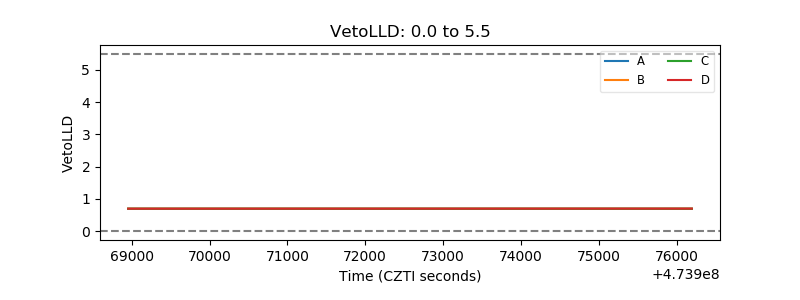 |
| Alpha Counter | 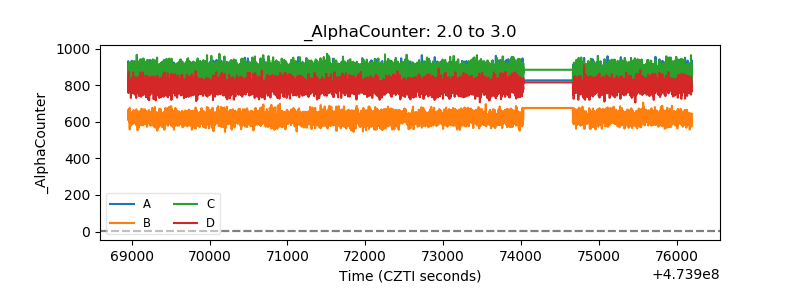 |
| _CPM_Rate | 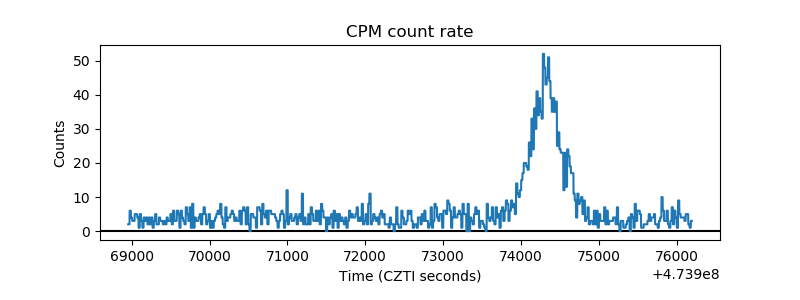 |
| CZT Counter | 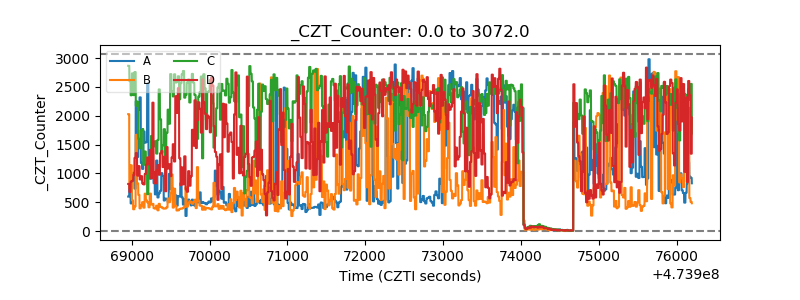 |
| +2.5 Volts monitor | 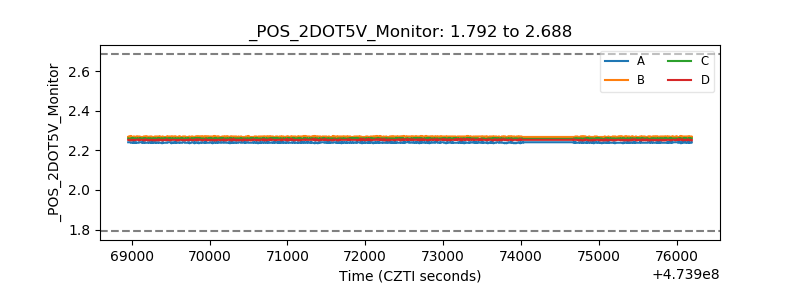 |
| +5 Volts monitor | 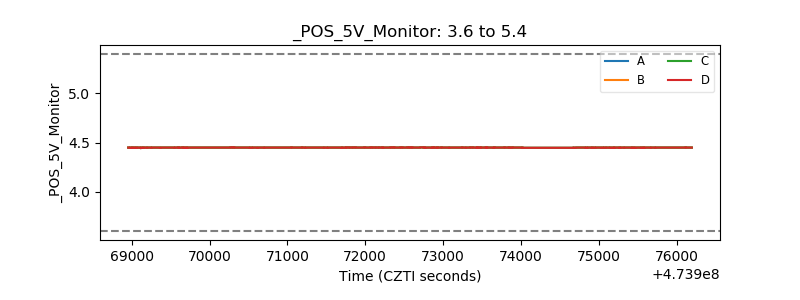 |
| _ROLL_ROT | 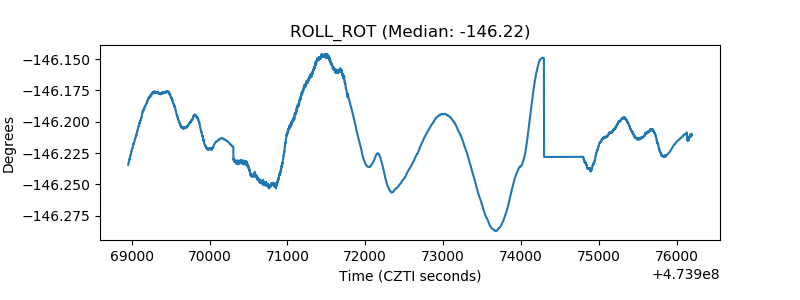 |
| _Roll_DEC | 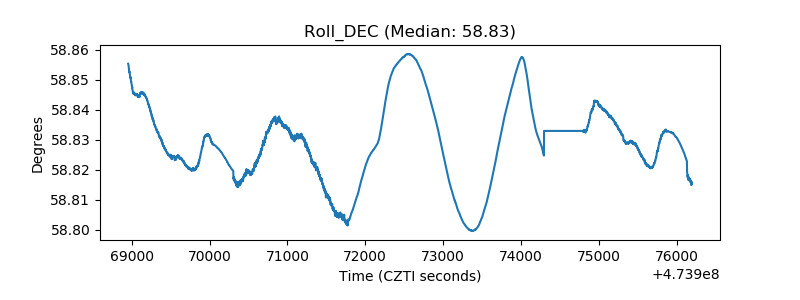 |
| _Roll_RA | 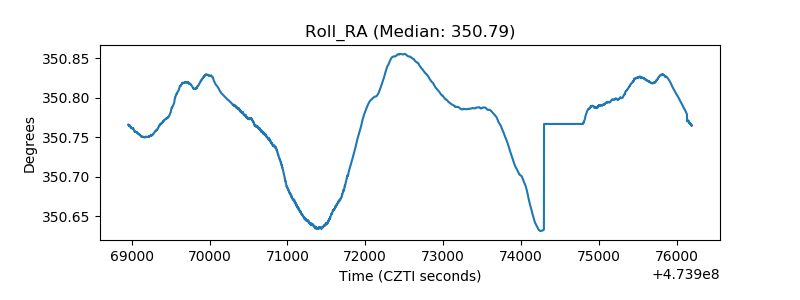 |
| Veto Counter | 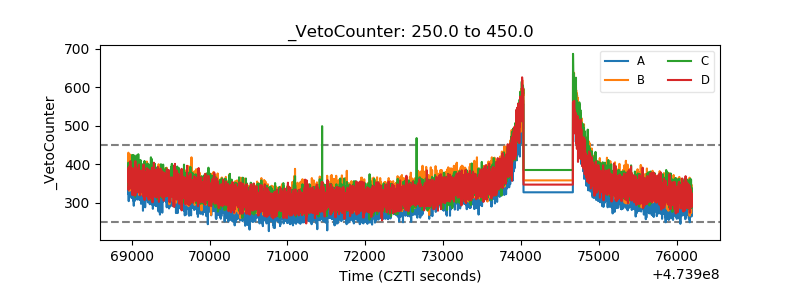 |