| Param | Original file | Final file |
|---|---|---|
| Filename | modeM0/AS1C09_003T01_9000006442_50192cztM0_level2.fits | modeM0/AS1C09_003T01_9000006442_50192cztM0_level2_quad_clean.evt |
| Size (bytes) | 1,299,790,080 | 75,386,880 |
| Size | 1.2 GB | 71.9 MB |
| Events in quadrant A | 9,463,288 | 579,736 |
| Events in quadrant B | 7,206,544 | 671,366 |
| Events in quadrant C | 15,844,493 | 157,007 |
| Events in quadrant D | 15,007,127 | 338,616 |
| Mode M0 | |||
|---|---|---|---|
| Quadrant | BADHDUFLAG | Total packets | Discarded packets |
| A | 0 | 33446 | 0 |
| B | 0 | 26664 | 0 |
| C | 0 | 52342 | 0 |
| D | 0 | 49904 | 2 |
| Mode SS | |||
|---|---|---|---|
| Quadrant | BADHDUFLAG | Total packets | Discarded packets |
| A | 0 | 154 | 0 |
| B | 0 | 154 | 0 |
| C | 0 | 154 | 0 |
| D | 0 | 154 | 0 |
| Quadrant | Total seconds | Saturated seconds | Saturation percentage |
|---|---|---|---|
| A | 7695 | 1737 | 22.573099% |
| B | 7695 | 1193 | 15.503574% |
| C | 7696 | 6128 | 79.625780% |
| D | 7695 | 4015 | 52.176738% |
Noise dominated data is calculated using 1-second bins in cleaned event files. If a bin has >2000 counts, and if more than 50% of those come from <1% of pixels, then it is considered to be noise-dominated and hence unusable.
| Quadrant | # 1 sec bins | Bins with >0 counts | Bins with >2000 counts | High rate bins dominated by noise | Noise dominated (total time) | Noise dominated (detector-on time) | Marked lightcurve |
|---|---|---|---|---|---|---|---|
| A | 7695 | 7695 | 1419 | 1419 | 18.44% | 18.44% | 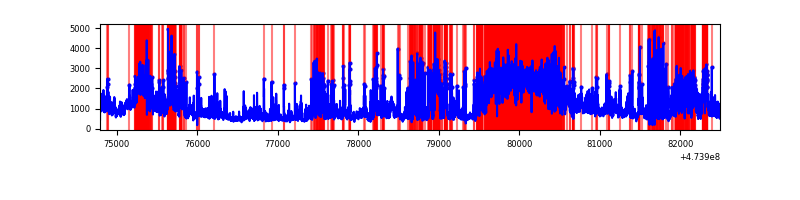 |
| B | 7695 | 7695 | 860 | 860 | 11.18% | 11.18% | 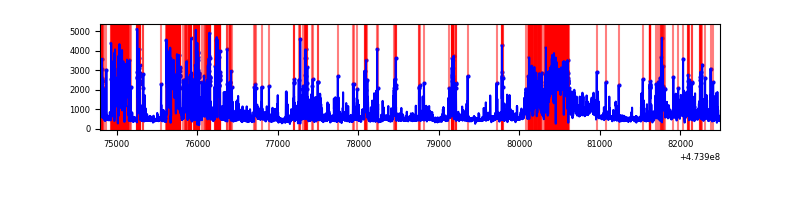 |
| C | 7696 | 7696 | 4704 | 4704 | 61.12% | 61.12% | 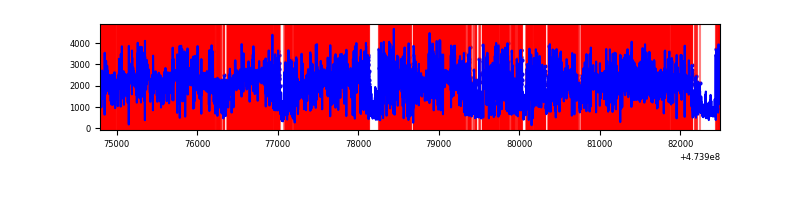 |
| D | 7694 | 7694 | 3715 | 3715 | 48.28% | 48.28% | 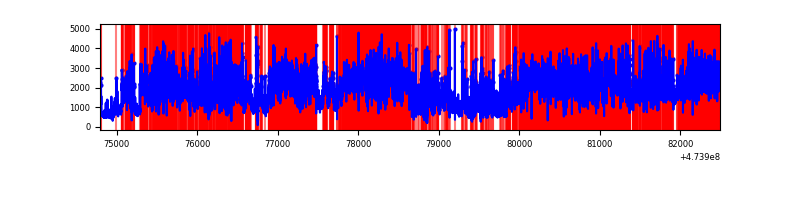 |
Top three noisy pixels from each quadrant. If the there are fewer than three noisy pixels in the level2.evt file, extra rows are filled as -1
| Pixel properties | Quadrant properties | ||||||
|---|---|---|---|---|---|---|---|
| Quadrant | DetID | PixID | Counts | Sigma | Mean | Median | Sigma |
| A | 0 | 98 | 2478932 | 13499.56 | 740 | 721 | 183.6 |
| A | 8 | 8 | 766682 | 4172.42 | 740 | 721 | 183.6 |
| A | 3 | 130 | 606799 | 3301.49 | 740 | 721 | 183.6 |
| B | 4 | 206 | 2410476 | 15349.28 | 745 | 721 | 157.0 |
| B | 3 | 249 | 775313 | 4933.88 | 745 | 721 | 157.0 |
| B | 5 | 185 | 244529 | 1552.97 | 745 | 721 | 157.0 |
| C | 4 | 111 | 8598789 | 87277.36 | 336 | 335 | 98.5 |
| C | 15 | 213 | 2628885 | 26680.72 | 336 | 335 | 98.5 |
| C | 15 | 197 | 1004891 | 10196.6 | 336 | 335 | 98.5 |
| D | 15 | 168 | 2897546 | 16187.48 | 617 | 594 | 179.0 |
| D | 15 | 108 | 1803258 | 10072.86 | 617 | 594 | 179.0 |
| D | 15 | 106 | 1152345 | 6435.71 | 617 | 594 | 179.0 |
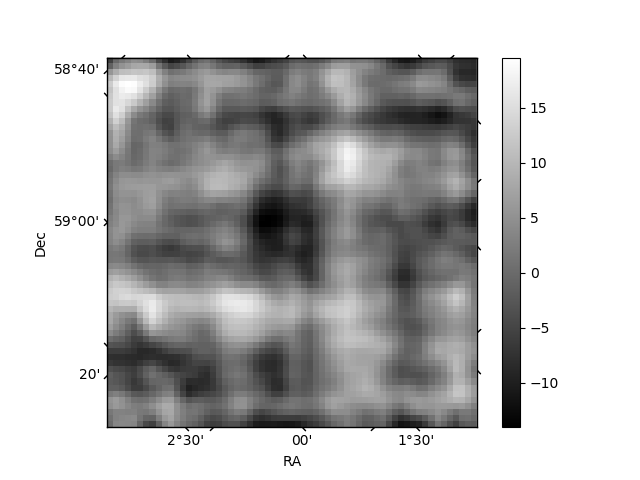
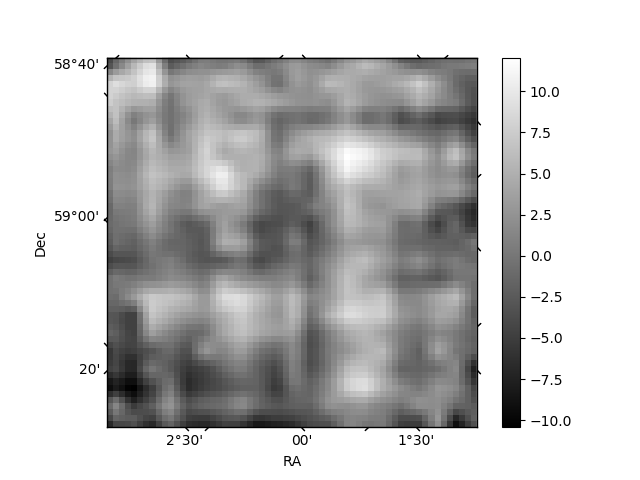
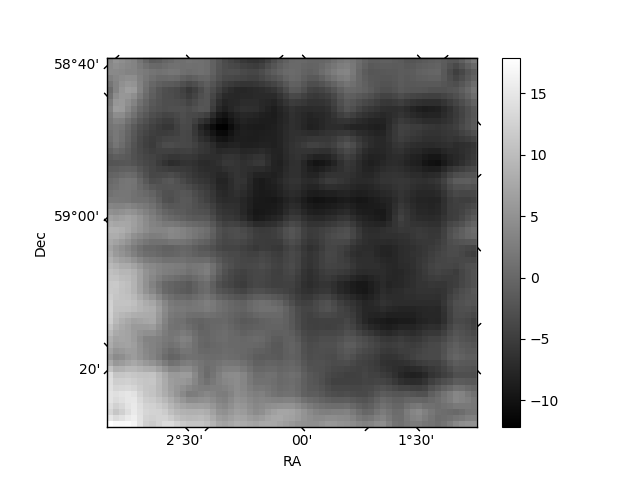
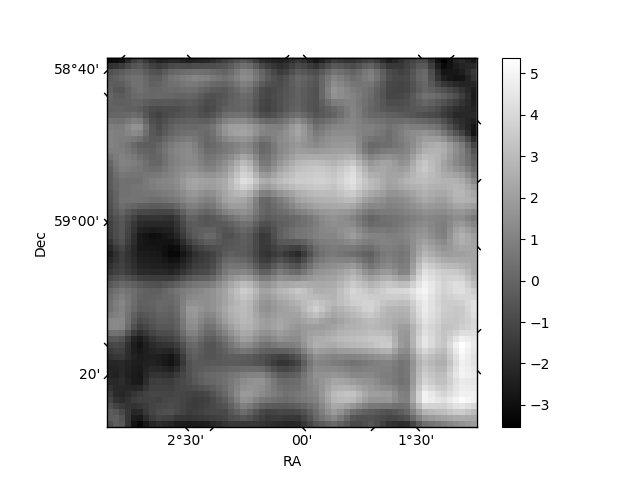
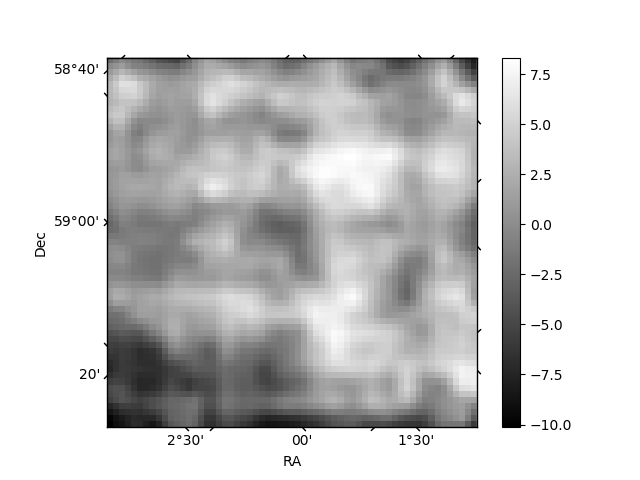
Histogram calculated using DETX and DETY for each event in the final _common_clean file
| Quadrant A | 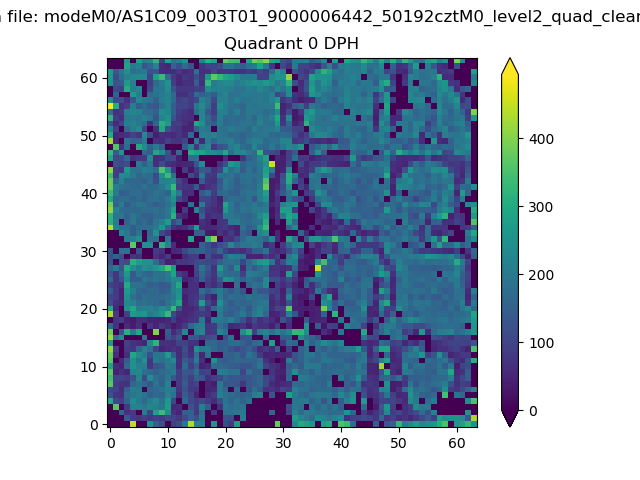 |
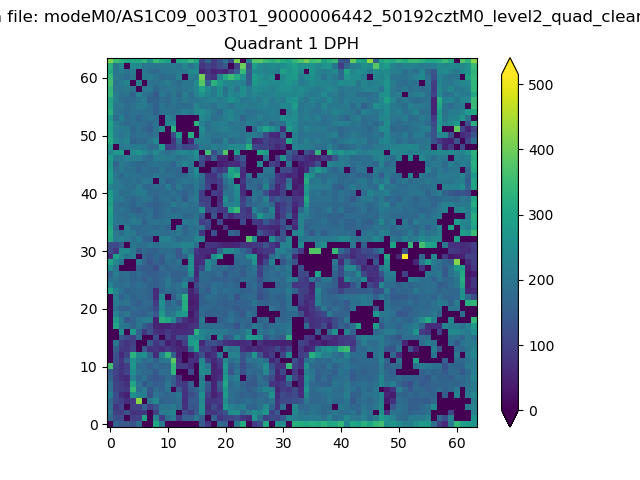 |
Quadrant B |
|---|---|---|---|
| Quadrant D | 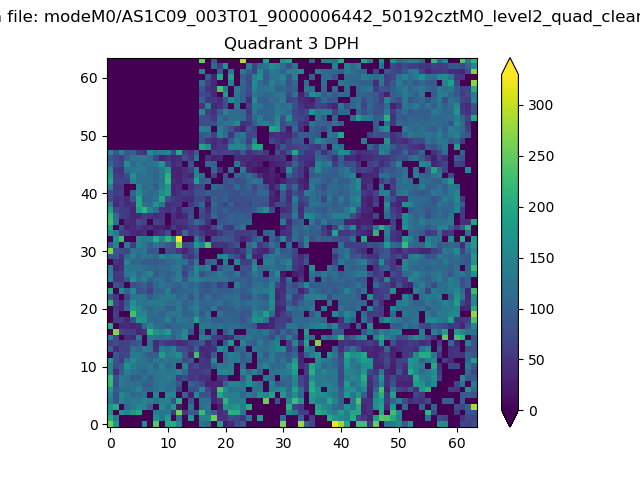 |
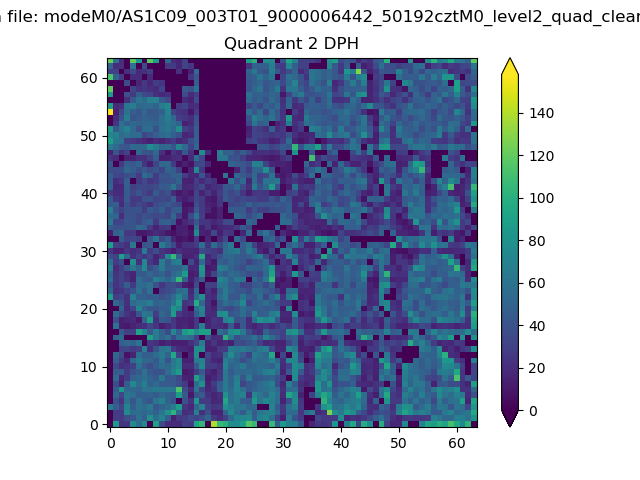 |
Quadrant C |
| Plot type | Count rate plots | Images |
|---|---|---|
| Comparison with Poisson distribution Blue bars denote a histogram of data divided into 1 sec bins. Red curve is a Poisson curve with rate = median count rate of data. |
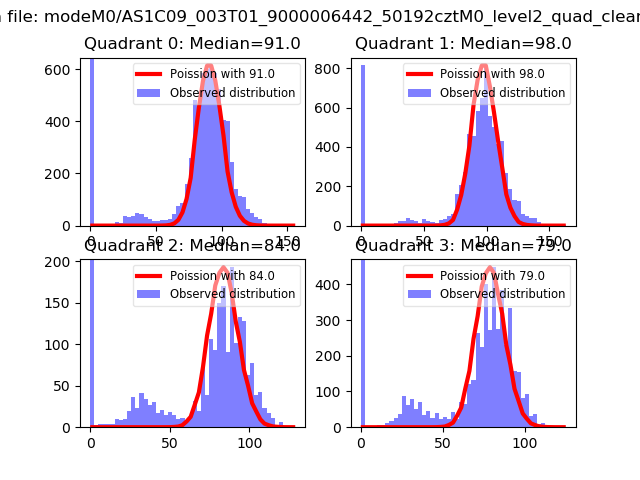 |
 |
| Quadrant-wise count rates Data is divided into 100 sec bins |
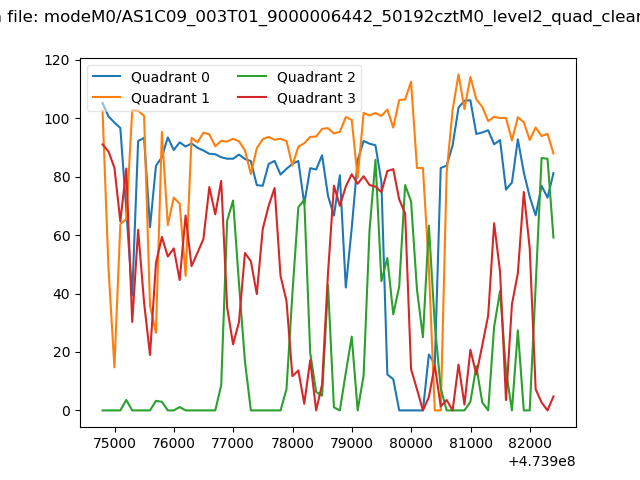 |
|
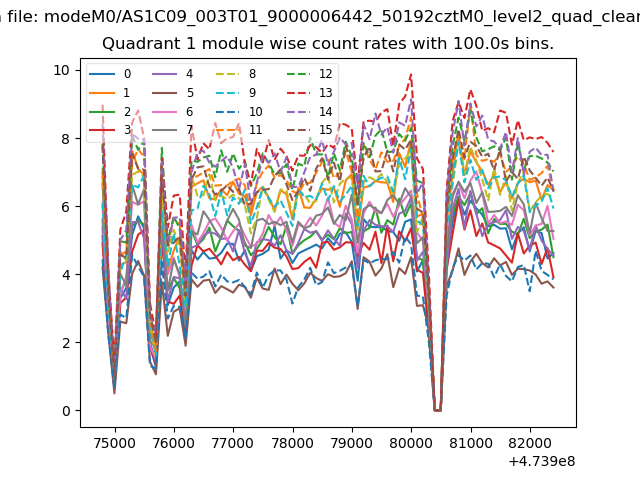
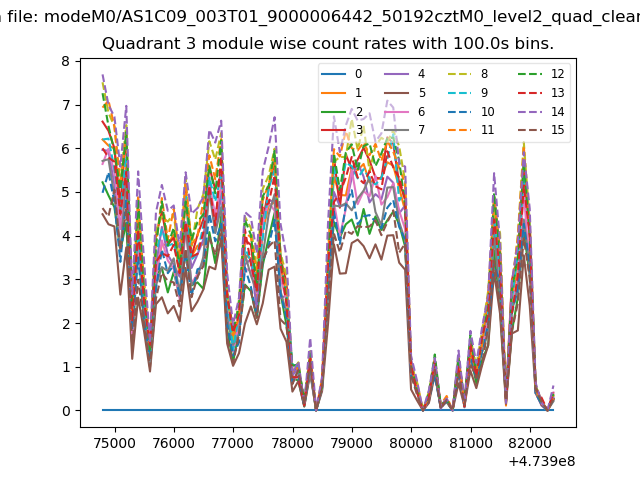
| Module-wise count rates for Quadrant A Data is divided into 100 sec bins |
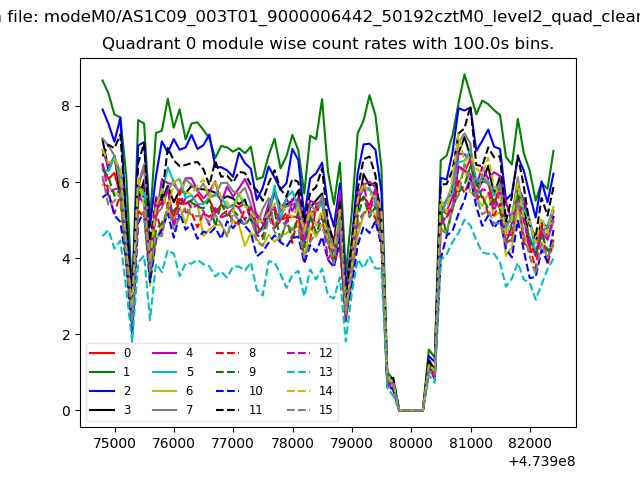 |
 |
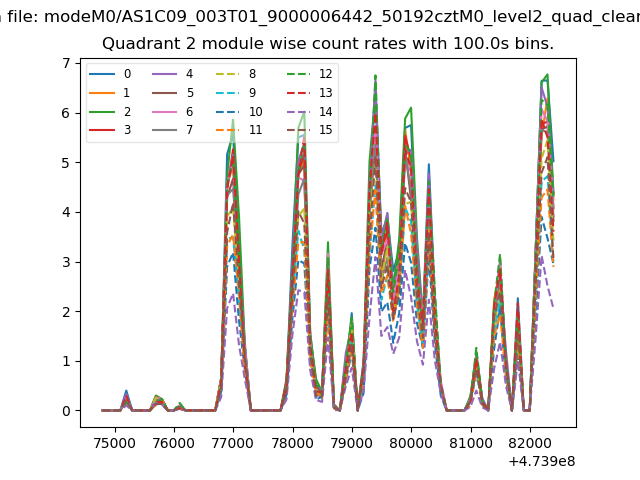
| Module-wise count rates for Quadrant B Data is divided into 100 sec bins |
 |
 |
| Module-wise count rates for Quadrant C Data is divided into 100 sec bins |
 |
 |
| Module-wise count rates for Quadrant D Data is divided into 100 sec bins |
 |
 |
| Parameter | Plot |
|---|---|
| CZT HV Monitor | 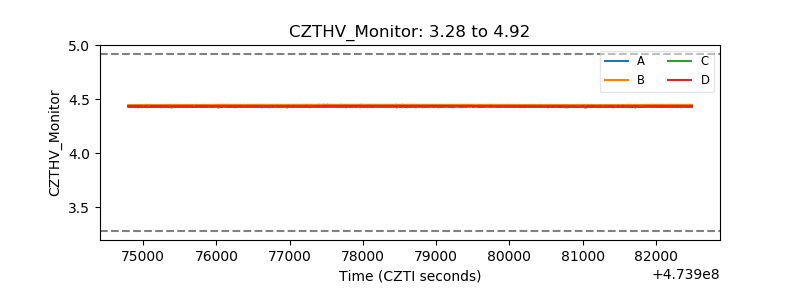 |
| D_VDD | 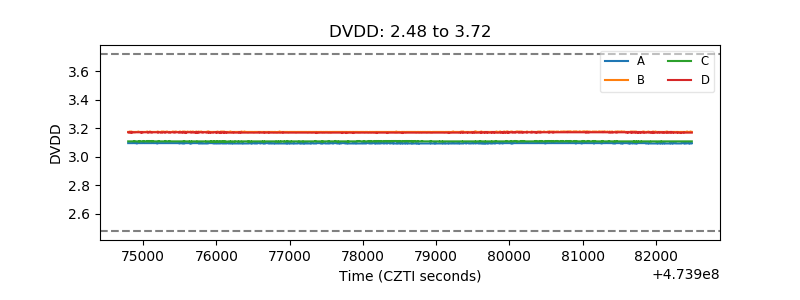 |
| Temperature 1 |  |
| Veto HV Monitor | 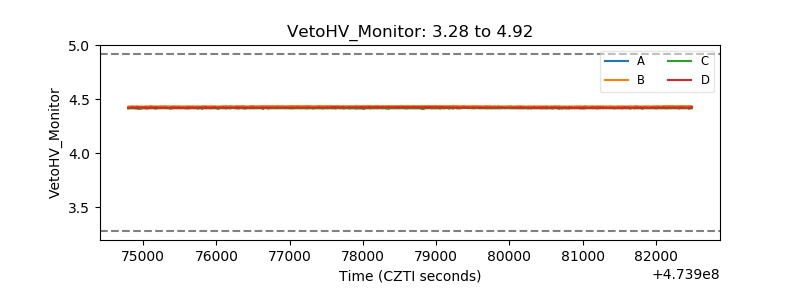 |
| Veto LLD | 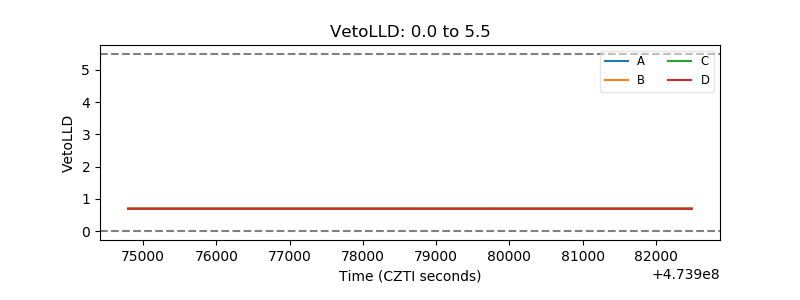 |
| Alpha Counter | 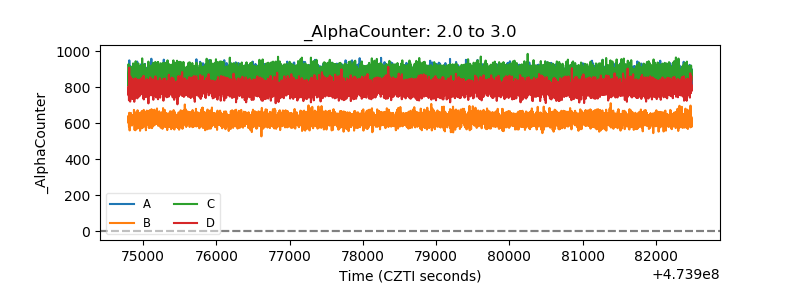 |
| _CPM_Rate | 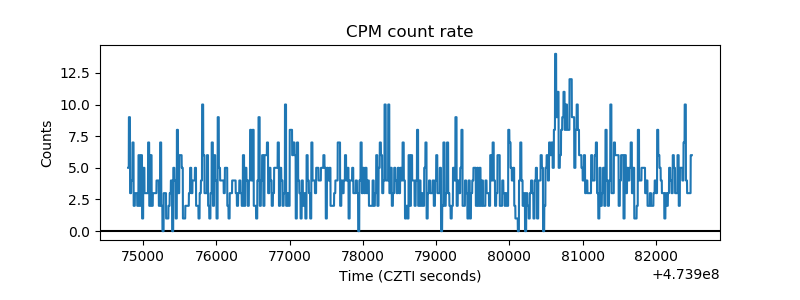 |
| CZT Counter | 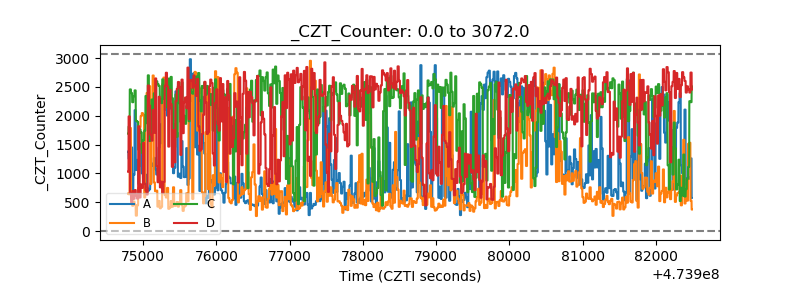 |
| +2.5 Volts monitor | 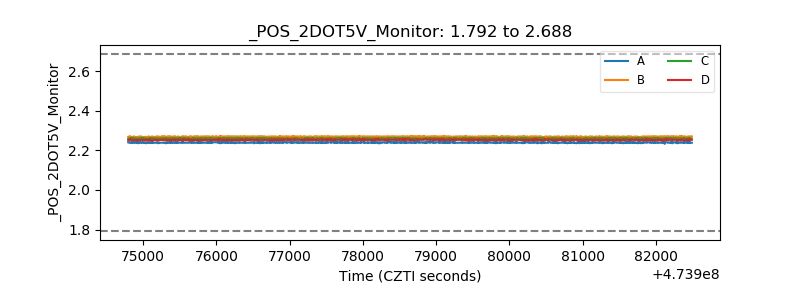 |
| +5 Volts monitor | 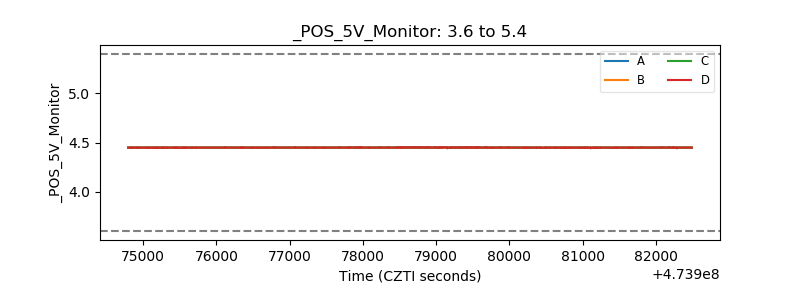 |
| _ROLL_ROT | 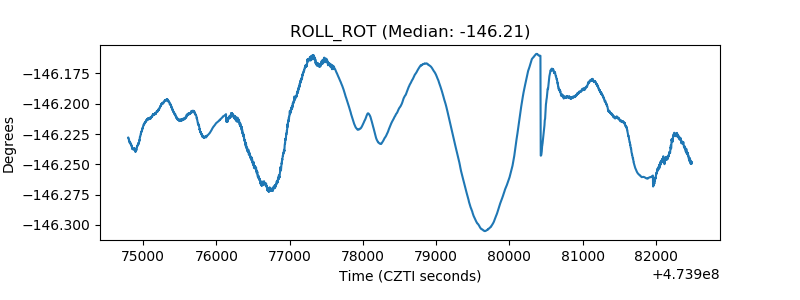 |
| _Roll_DEC | 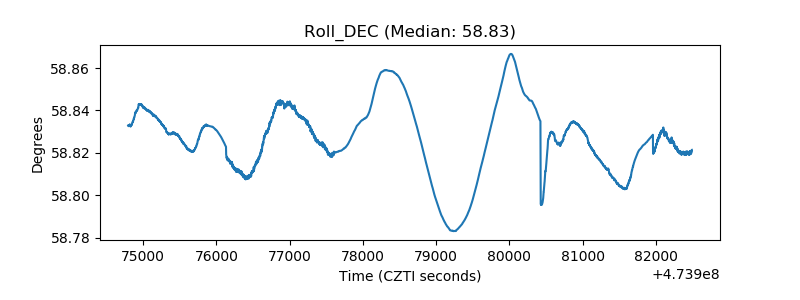 |
| _Roll_RA | 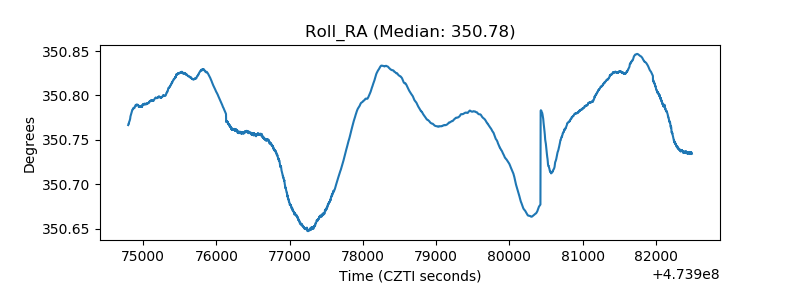 |
| Veto Counter | 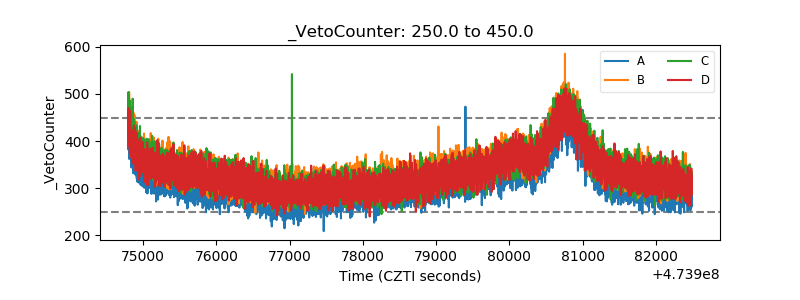 |