| Param | Original file | Final file |
|---|---|---|
| Filename | modeM0/AS1C09_003T01_9000006442_50193cztM0_level2.fits | modeM0/AS1C09_003T01_9000006442_50193cztM0_level2_quad_clean.evt |
| Size (bytes) | 1,584,944,640 | 63,264,960 |
| Size | 1.5 GB | 60.3 MB |
| Events in quadrant A | 15,648,511 | 297,992 |
| Events in quadrant B | 8,069,070 | 688,183 |
| Events in quadrant C | 15,601,686 | 239,721 |
| Events in quadrant D | 18,742,277 | 138,197 |
| Mode M0 | |||
|---|---|---|---|
| Quadrant | BADHDUFLAG | Total packets | Discarded packets |
| A | 0 | 51940 | 1 |
| B | 0 | 29430 | 0 |
| C | 0 | 51802 | 0 |
| D | 0 | 61131 | 0 |
| Mode SS | |||
|---|---|---|---|
| Quadrant | BADHDUFLAG | Total packets | Discarded packets |
| A | 0 | 158 | 0 |
| B | 0 | 158 | 0 |
| C | 0 | 158 | 0 |
| D | 0 | 158 | 0 |
| Quadrant | Total seconds | Saturated seconds | Saturation percentage |
|---|---|---|---|
| A | 7923 | 4928 | 62.198662% |
| B | 7924 | 1215 | 15.333165% |
| C | 7924 | 5421 | 68.412418% |
| D | 7924 | 6598 | 83.266027% |
Noise dominated data is calculated using 1-second bins in cleaned event files. If a bin has >2000 counts, and if more than 50% of those come from <1% of pixels, then it is considered to be noise-dominated and hence unusable.
| Quadrant | # 1 sec bins | Bins with >0 counts | Bins with >2000 counts | High rate bins dominated by noise | Noise dominated (total time) | Noise dominated (detector-on time) | Marked lightcurve |
|---|---|---|---|---|---|---|---|
| A | 7923 | 7923 | 4284 | 4284 | 54.07% | 54.07% |  |
| B | 7924 | 7924 | 929 | 929 | 11.72% | 11.72% | 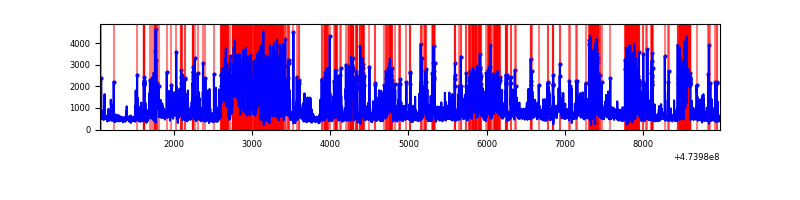 |
| C | 7924 | 7924 | 4246 | 4246 | 53.58% | 53.58% | 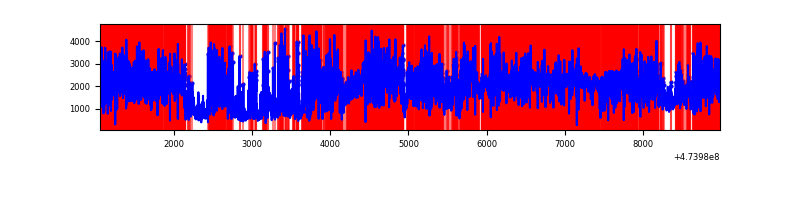 |
| D | 7923 | 7923 | 5870 | 5870 | 74.09% | 74.09% | 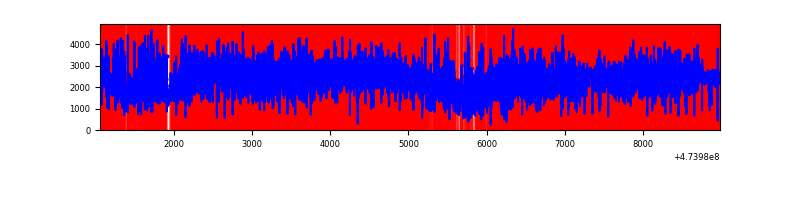 |
Top three noisy pixels from each quadrant. If the there are fewer than three noisy pixels in the level2.evt file, extra rows are filled as -1
| Pixel properties | Quadrant properties | ||||||
|---|---|---|---|---|---|---|---|
| Quadrant | DetID | PixID | Counts | Sigma | Mean | Median | Sigma |
| A | 0 | 98 | 9976162 | 68518.88 | 568 | 553 | 145.6 |
| A | 12 | 250 | 483075 | 3314.27 | 568 | 553 | 145.6 |
| A | 3 | 130 | 468217 | 3212.22 | 568 | 553 | 145.6 |
| B | 4 | 206 | 1944569 | 12018.91 | 763 | 736 | 161.7 |
| B | 3 | 249 | 1293926 | 7995.92 | 763 | 736 | 161.7 |
| B | 10 | 28 | 468794 | 2894.05 | 763 | 736 | 161.7 |
| C | 4 | 111 | 6446740 | 49276.3 | 449 | 447 | 130.8 |
| C | 15 | 197 | 2132313 | 16296.26 | 449 | 447 | 130.8 |
| C | 15 | 213 | 1075585 | 8218.5 | 449 | 447 | 130.8 |
| D | 15 | 168 | 4656229 | 33445.9 | 476 | 458 | 139.2 |
| D | 7 | 61 | 3416995 | 24543.55 | 476 | 458 | 139.2 |
| D | 15 | 108 | 1709842 | 12279.79 | 476 | 458 | 139.2 |
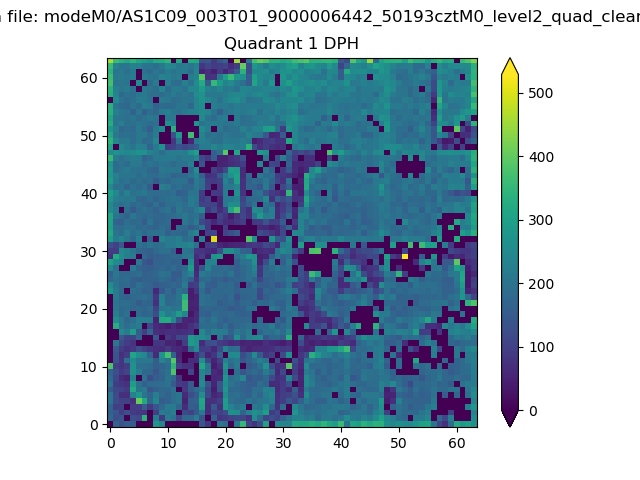
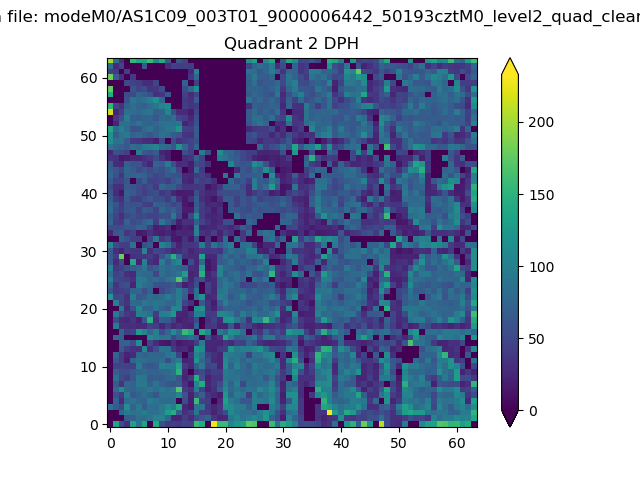
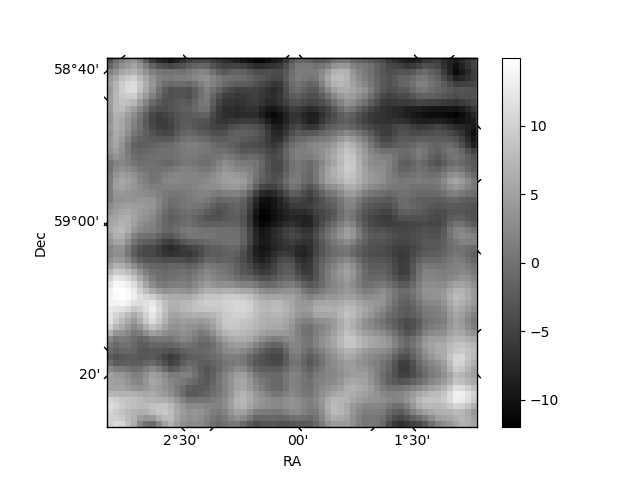
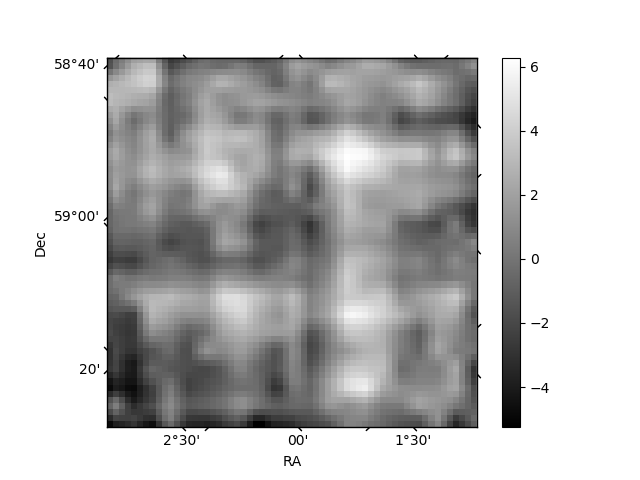
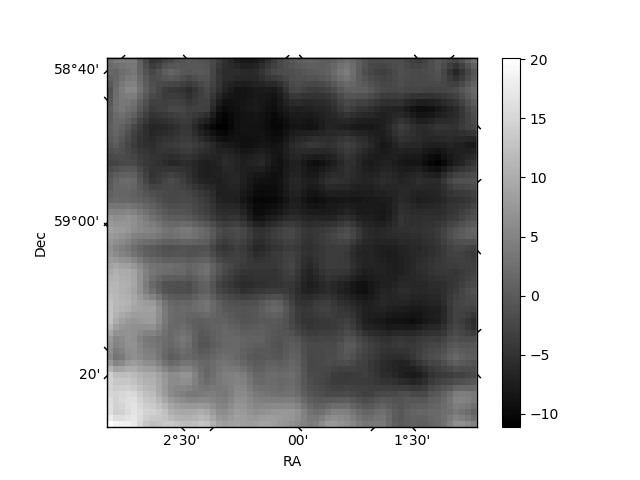
Histogram calculated using DETX and DETY for each event in the final _common_clean file
| Quadrant A | 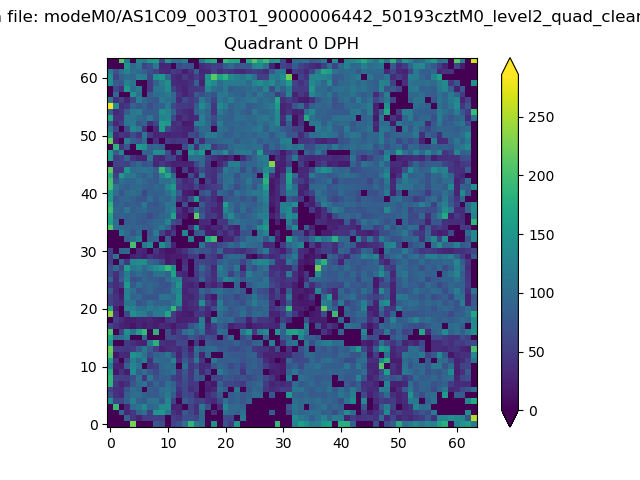 |
 |
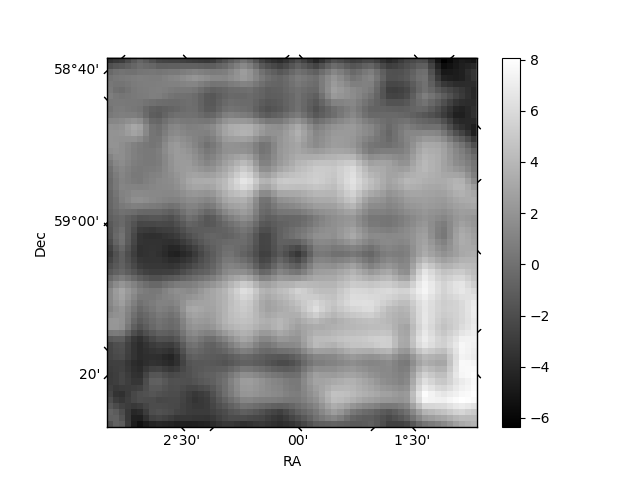
Quadrant B |
|---|---|---|---|
| Quadrant D | 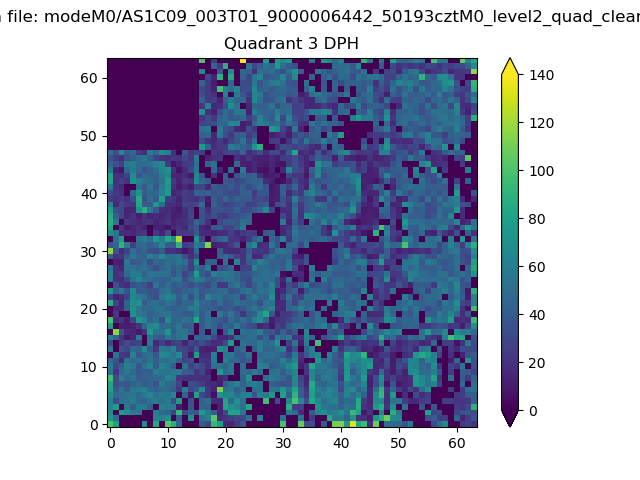 |
 |
Quadrant C |
| Plot type | Count rate plots | Images |
|---|---|---|
| Comparison with Poisson distribution Blue bars denote a histogram of data divided into 1 sec bins. Red curve is a Poisson curve with rate = median count rate of data. |
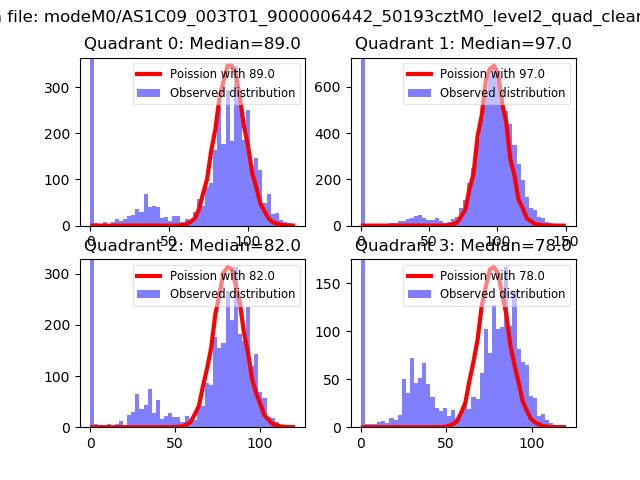 |
 |
| Quadrant-wise count rates Data is divided into 100 sec bins |
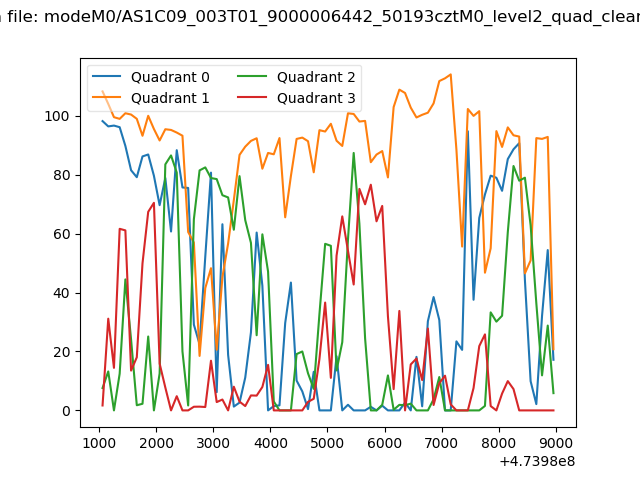 |
|
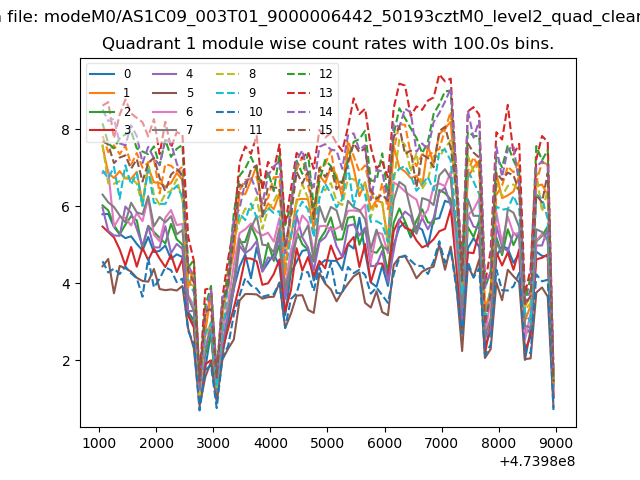
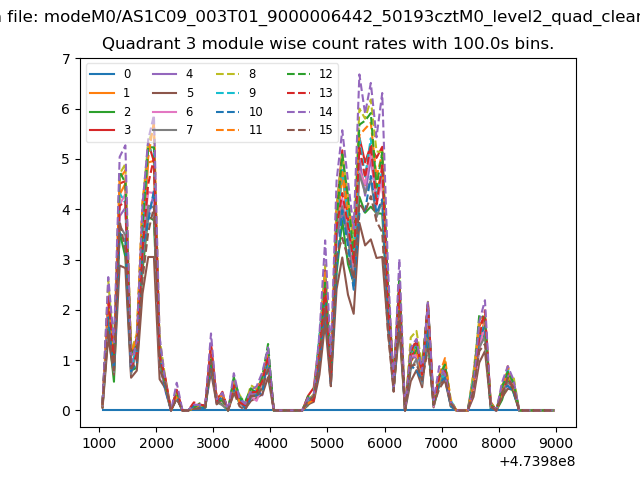
| Module-wise count rates for Quadrant A Data is divided into 100 sec bins |
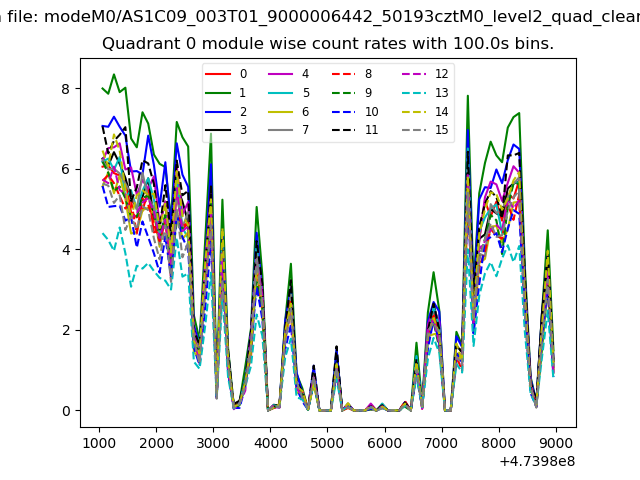 |
 |
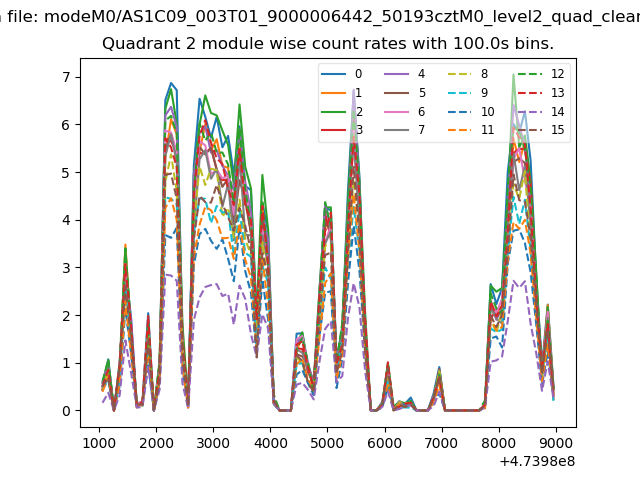
| Module-wise count rates for Quadrant B Data is divided into 100 sec bins |
 |
 |
| Module-wise count rates for Quadrant C Data is divided into 100 sec bins |
 |
 |
| Module-wise count rates for Quadrant D Data is divided into 100 sec bins |
 |
 |
| Parameter | Plot |
|---|---|
| CZT HV Monitor | 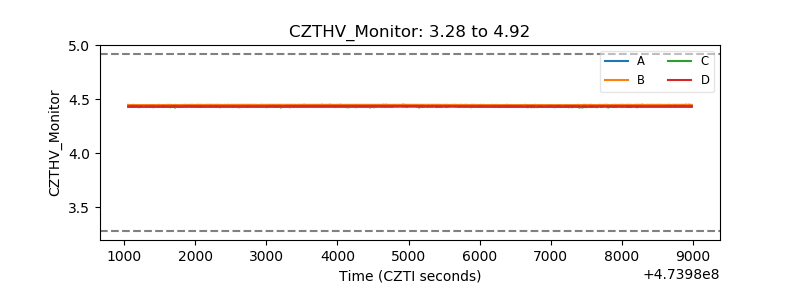 |
| D_VDD | 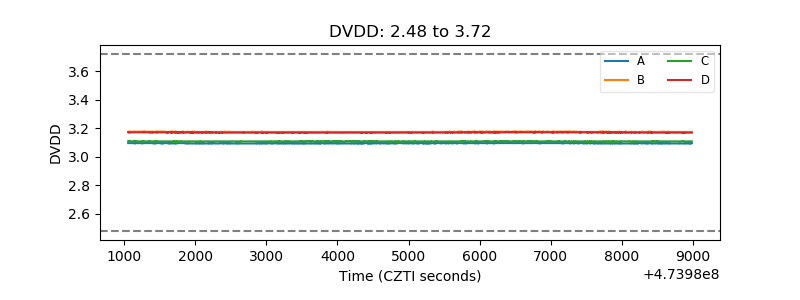 |
| Temperature 1 | 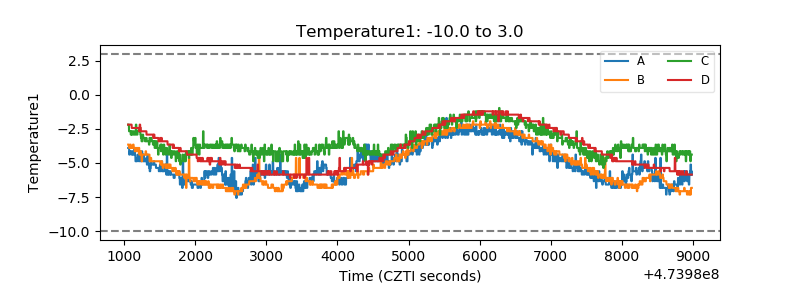 |
| Veto HV Monitor | 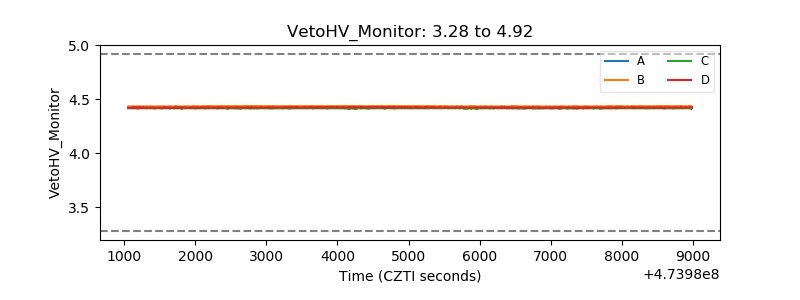 |
| Veto LLD | 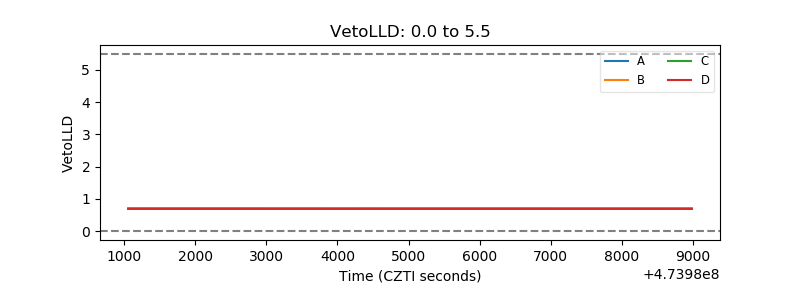 |
| Alpha Counter | 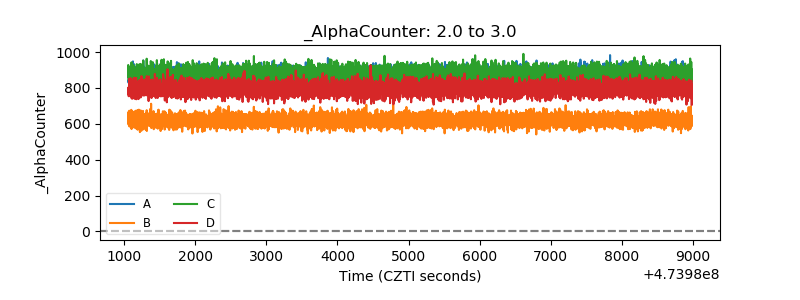 |
| _CPM_Rate | 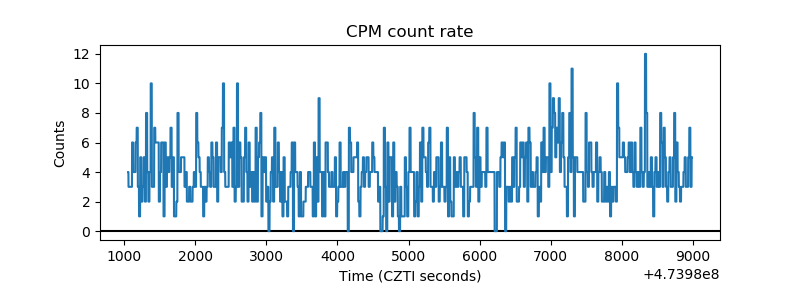 |
| CZT Counter | 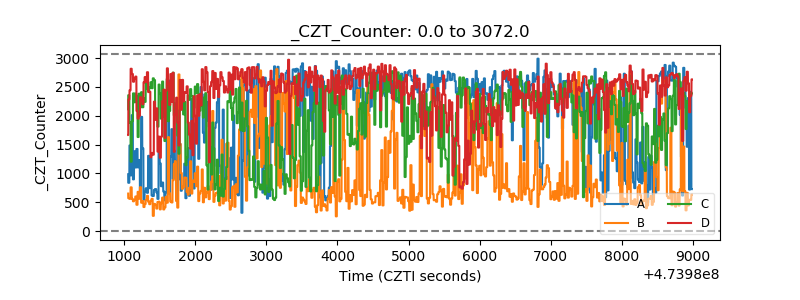 |
| +2.5 Volts monitor | 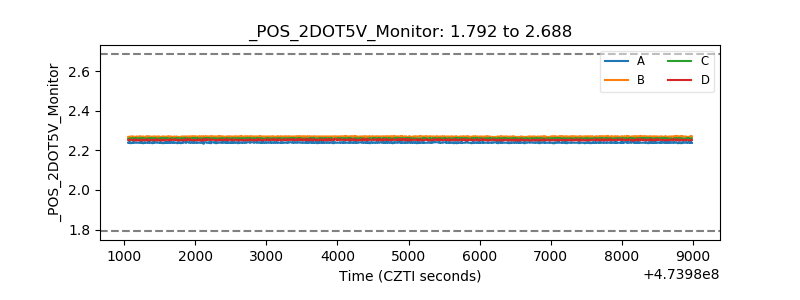 |
| +5 Volts monitor |  |
| _ROLL_ROT | 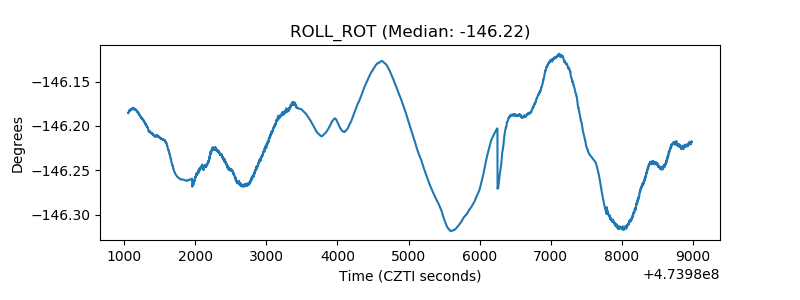 |
| _Roll_DEC | 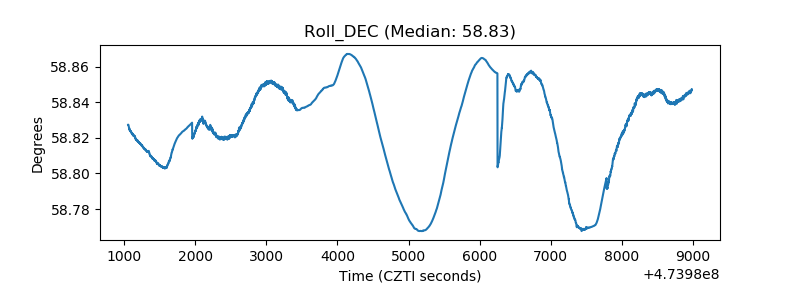 |
| _Roll_RA | 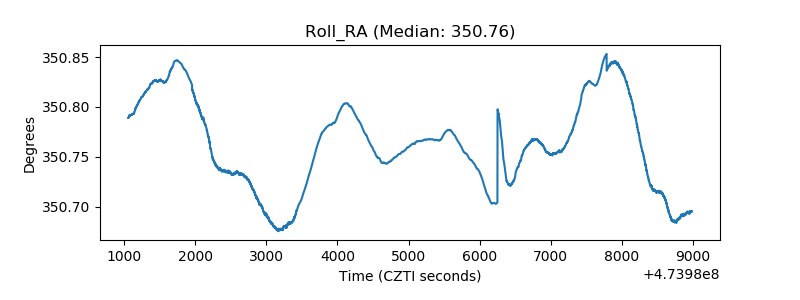 |
| Veto Counter | 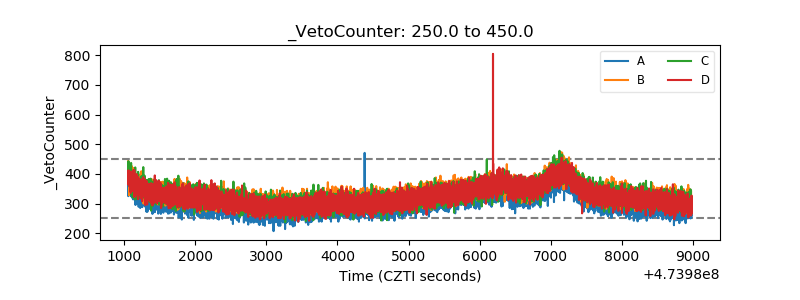 |