| Param | Original file | Final file |
|---|---|---|
| Filename | modeM0/AS1C09_003T01_9000006442_50194cztM0_level2.fits | modeM0/AS1C09_003T01_9000006442_50194cztM0_level2_quad_clean.evt |
| Size (bytes) | 1,574,127,360 | 52,027,200 |
| Size | 1.5 GB | 49.6 MB |
| Events in quadrant A | 15,294,438 | 286,191 |
| Events in quadrant B | 6,918,044 | 673,934 |
| Events in quadrant C | 16,921,010 | 80,247 |
| Events in quadrant D | 18,556,031 | 9,354 |
| Mode M0 | |||
|---|---|---|---|
| Quadrant | BADHDUFLAG | Total packets | Discarded packets |
| A | 0 | 50651 | 0 |
| B | 0 | 25718 | 0 |
| C | 0 | 55382 | 0 |
| D | 0 | 60280 | 0 |
| Mode SS | |||
|---|---|---|---|
| Quadrant | BADHDUFLAG | Total packets | Discarded packets |
| A | 0 | 150 | 0 |
| B | 0 | 150 | 0 |
| C | 0 | 150 | 0 |
| D | 0 | 150 | 0 |
| Quadrant | Total seconds | Saturated seconds | Saturation percentage |
|---|---|---|---|
| A | 7548 | 4720 | 62.533121% |
| B | 7548 | 964 | 12.771595% |
| C | 7547 | 6771 | 89.717769% |
| D | 7548 | 7467 | 98.926868% |
Noise dominated data is calculated using 1-second bins in cleaned event files. If a bin has >2000 counts, and if more than 50% of those come from <1% of pixels, then it is considered to be noise-dominated and hence unusable.
| Quadrant | # 1 sec bins | Bins with >0 counts | Bins with >2000 counts | High rate bins dominated by noise | Noise dominated (total time) | Noise dominated (detector-on time) | Marked lightcurve |
|---|---|---|---|---|---|---|---|
| A | 7548 | 7548 | 4036 | 4036 | 53.47% | 53.47% | 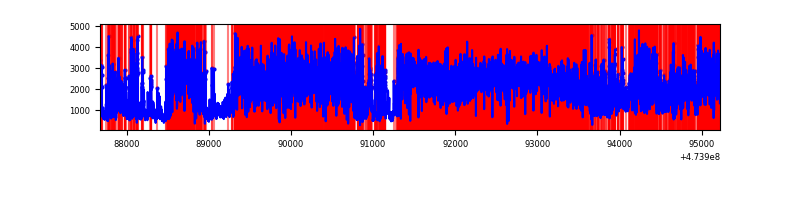 |
| B | 7548 | 7548 | 674 | 674 | 8.93% | 8.93% | 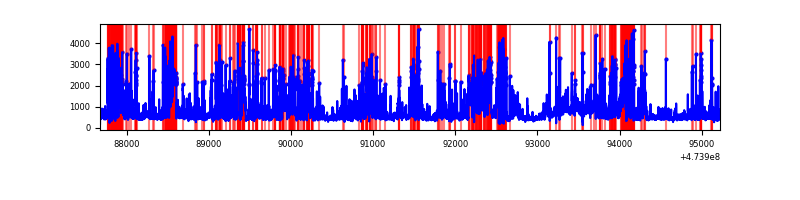 |
| C | 7546 | 7546 | 5520 | 5520 | 73.15% | 73.15% | 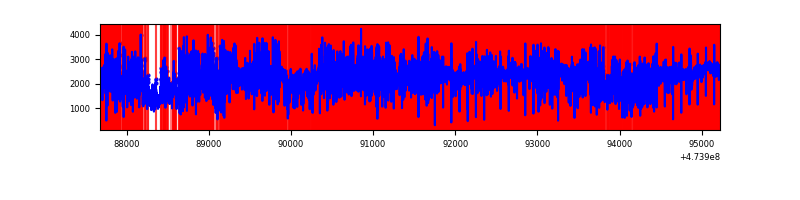 |
| D | 7547 | 7547 | 6819 | 6819 | 90.35% | 90.35% | 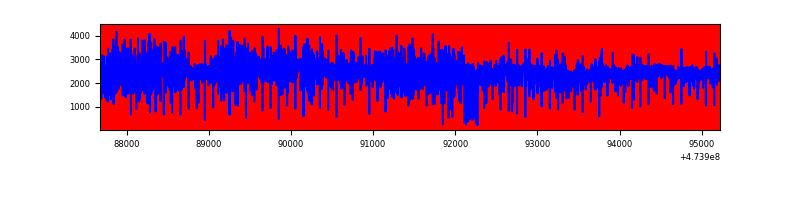 |
Top three noisy pixels from each quadrant. If the there are fewer than three noisy pixels in the level2.evt file, extra rows are filled as -1
| Pixel properties | Quadrant properties | ||||||
|---|---|---|---|---|---|---|---|
| Quadrant | DetID | PixID | Counts | Sigma | Mean | Median | Sigma |
| A | 0 | 98 | 9678243 | 66968.17 | 556 | 540 | 144.5 |
| A | 4 | 76 | 943000 | 6521.67 | 556 | 540 | 144.5 |
| A | 12 | 250 | 402578 | 2782.04 | 556 | 540 | 144.5 |
| B | 4 | 206 | 2512386 | 16002.44 | 735 | 711 | 157.0 |
| B | 3 | 249 | 382618 | 2433.21 | 735 | 711 | 157.0 |
| B | 5 | 185 | 263072 | 1671.56 | 735 | 711 | 157.0 |
| C | 15 | 197 | 4060121 | 40365.41 | 344 | 341 | 100.6 |
| C | 4 | 111 | 4053274 | 40297.33 | 344 | 341 | 100.6 |
| C | 15 | 196 | 1245933 | 12384.62 | 344 | 341 | 100.6 |
| D | 7 | 61 | 7458633 | 84593.66 | 259 | 247 | 88.2 |
| D | 15 | 168 | 3460961 | 39251.72 | 259 | 247 | 88.2 |
| D | 14 | 66 | 939853 | 10657.09 | 259 | 247 | 88.2 |
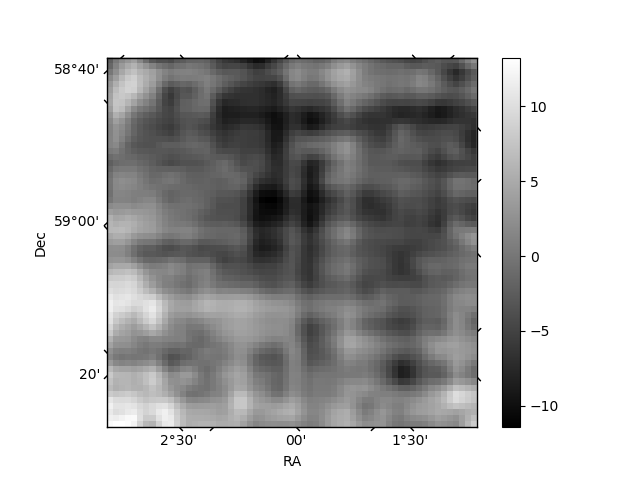
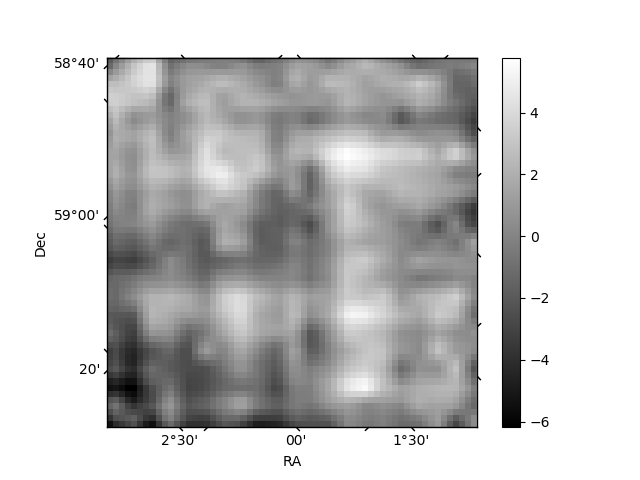
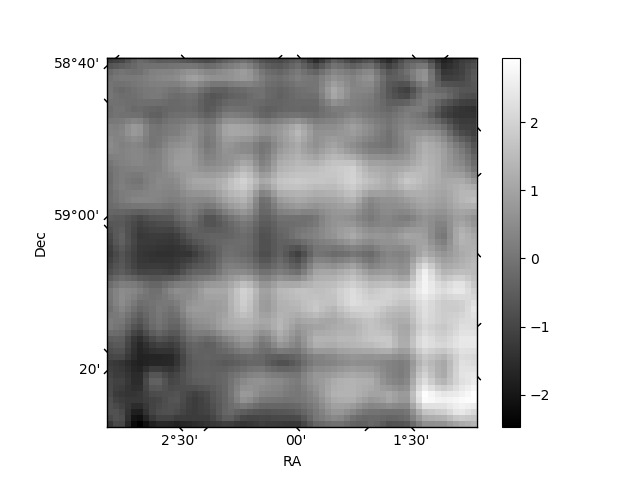
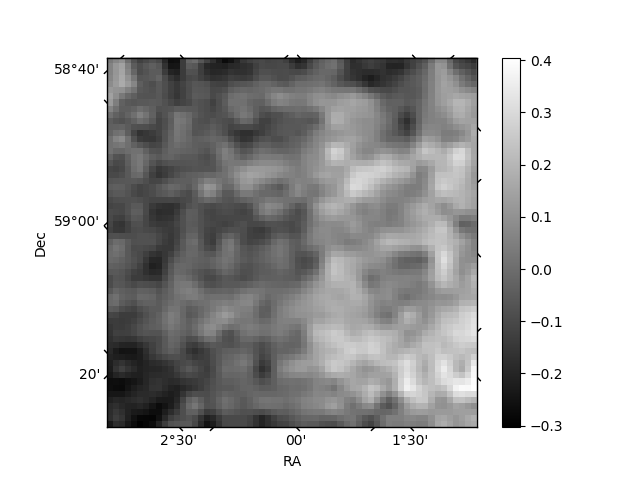
Histogram calculated using DETX and DETY for each event in the final _common_clean file
| Quadrant A | 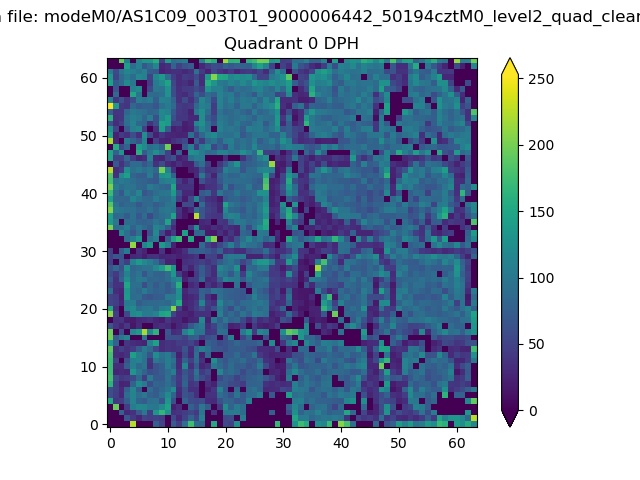 |
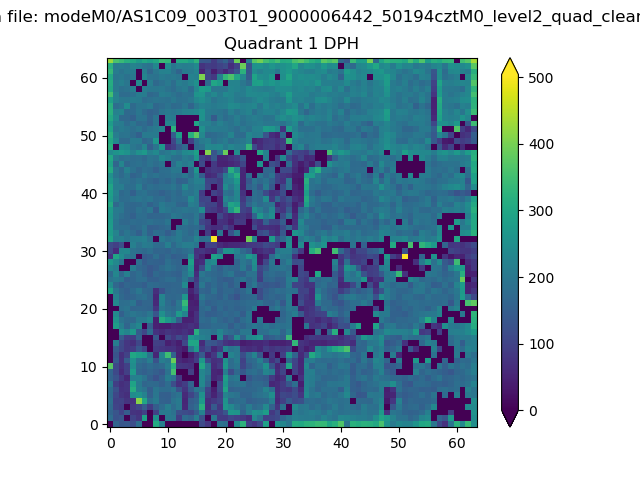 |
Quadrant B |
|---|---|---|---|
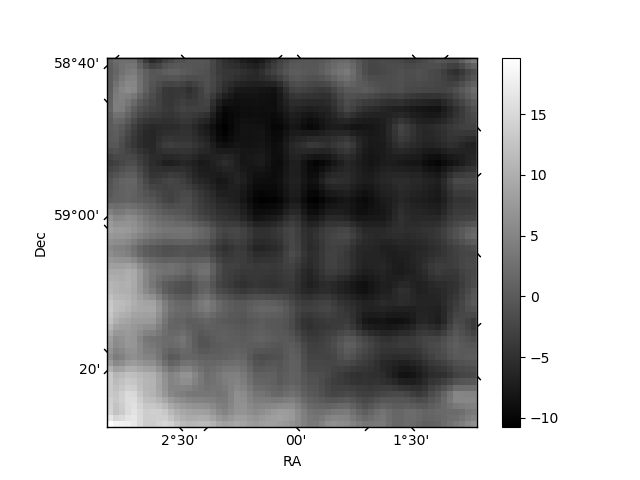
| Quadrant D | 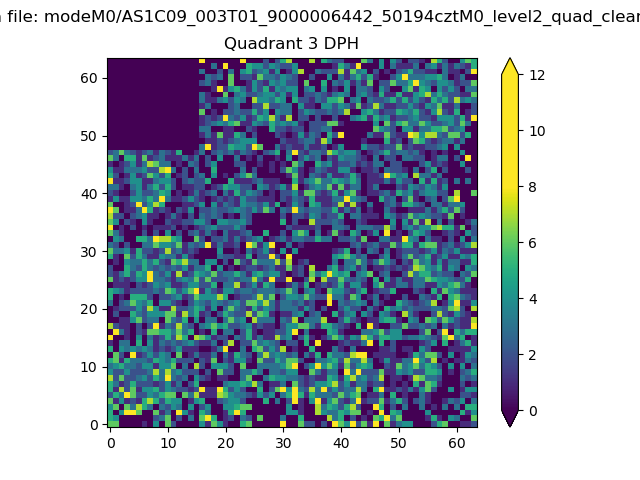 |
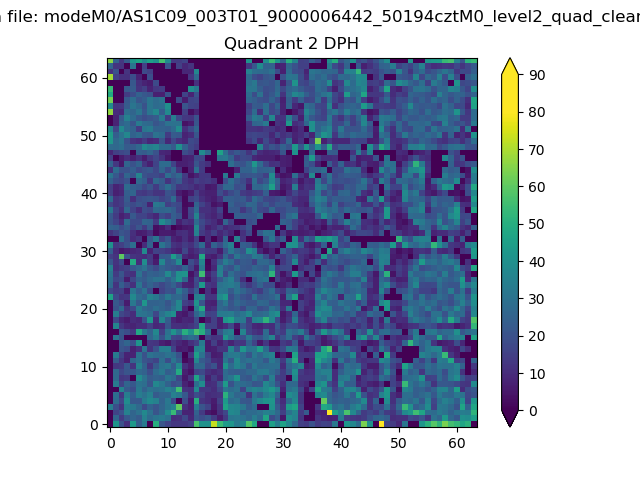 |
Quadrant C |
| Plot type | Count rate plots | Images |
|---|---|---|
| Comparison with Poisson distribution Blue bars denote a histogram of data divided into 1 sec bins. Red curve is a Poisson curve with rate = median count rate of data. |
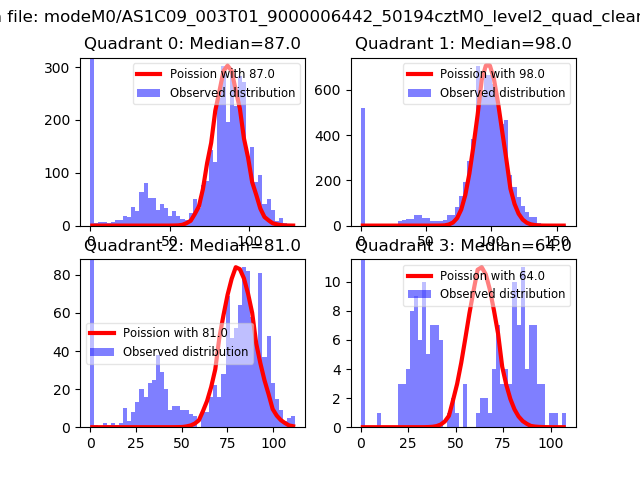 |
 |
| Quadrant-wise count rates Data is divided into 100 sec bins |
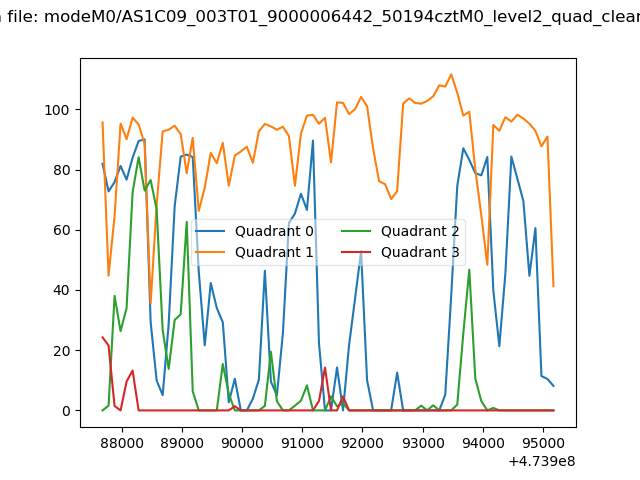 |
|
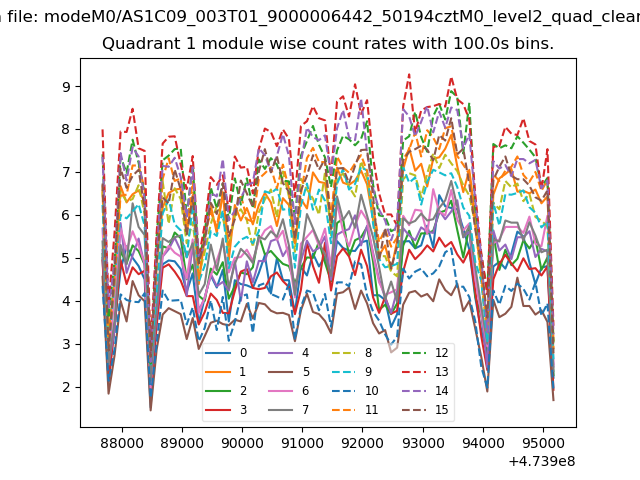
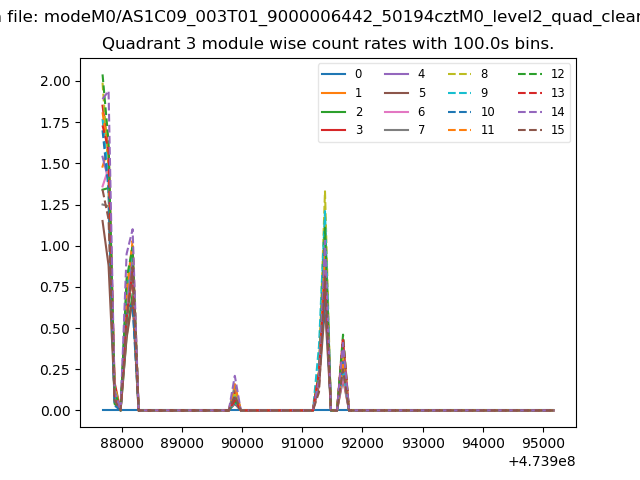
| Module-wise count rates for Quadrant A Data is divided into 100 sec bins |
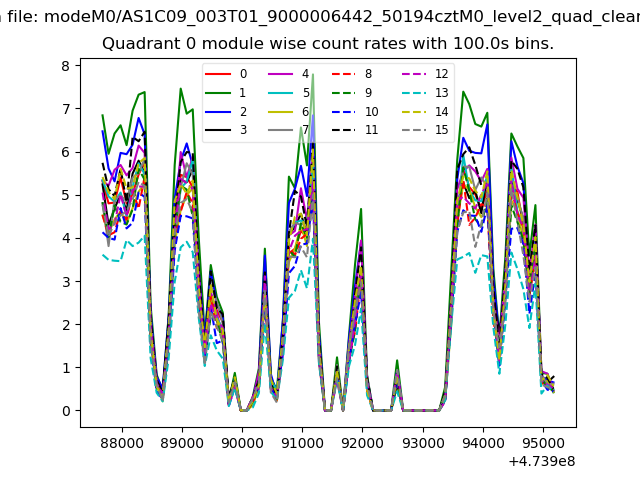 |
 |
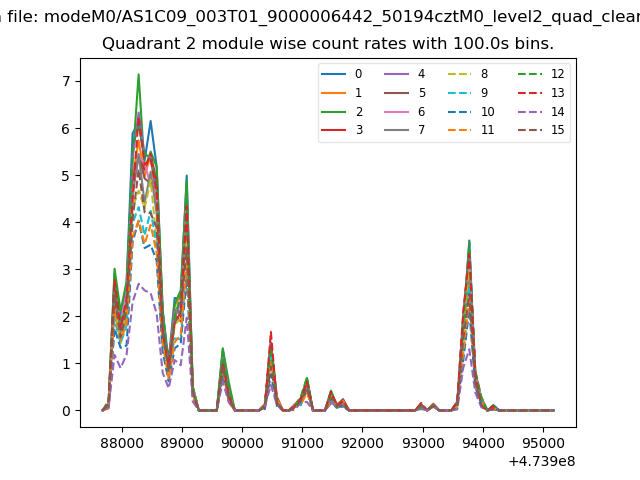
| Module-wise count rates for Quadrant B Data is divided into 100 sec bins |
 |
 |
| Module-wise count rates for Quadrant C Data is divided into 100 sec bins |
 |
 |
| Module-wise count rates for Quadrant D Data is divided into 100 sec bins |
 |
 |
| Parameter | Plot |
|---|---|
| CZT HV Monitor | 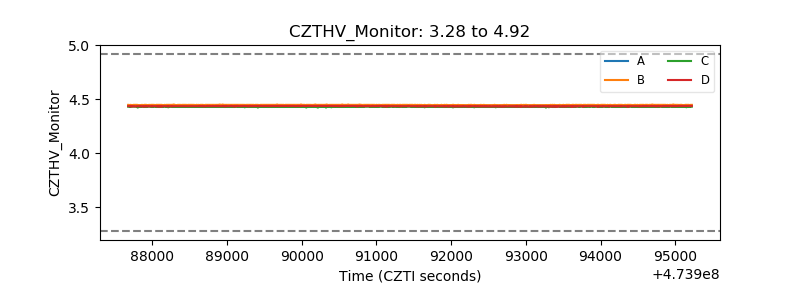 |
| D_VDD | 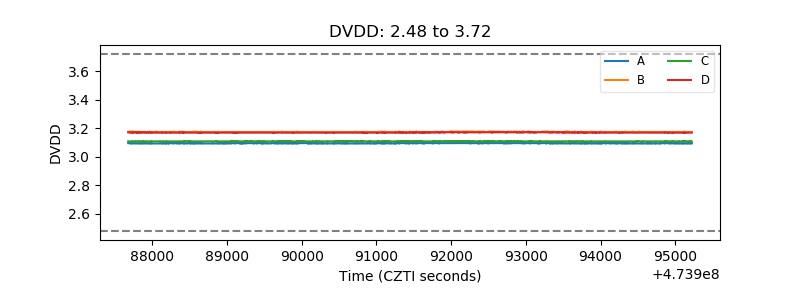 |
| Temperature 1 | 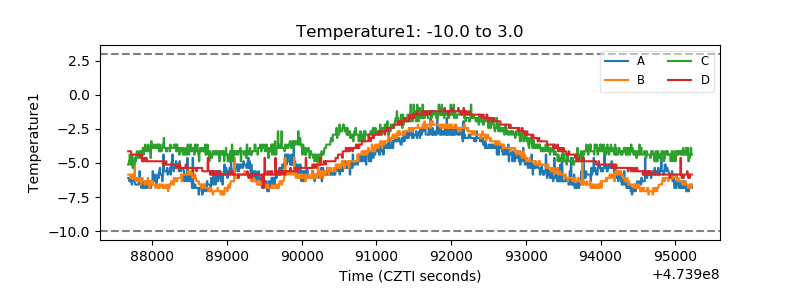 |
| Veto HV Monitor | 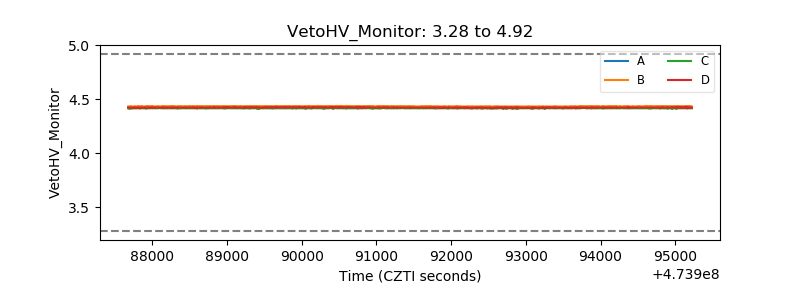 |
| Veto LLD | 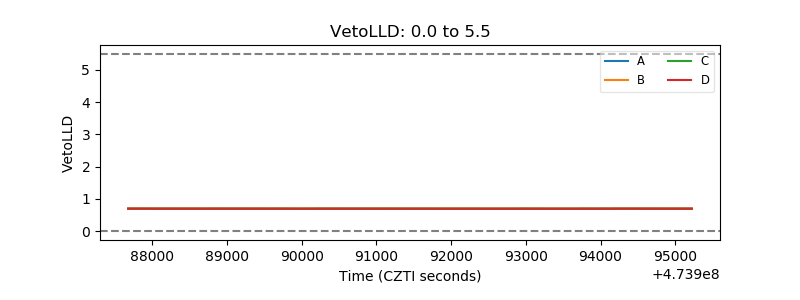 |
| Alpha Counter | 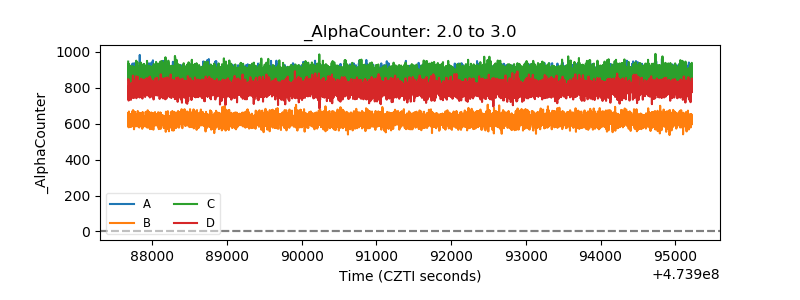 |
| _CPM_Rate | 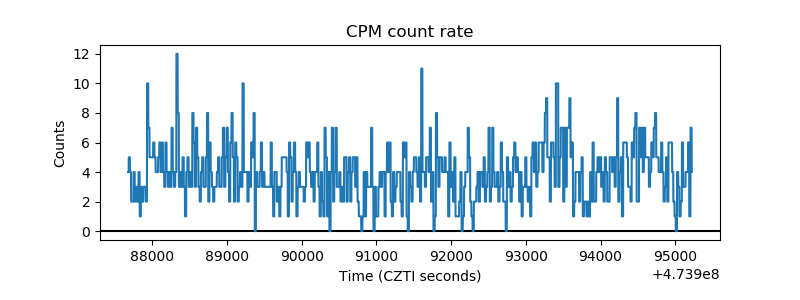 |
| CZT Counter | 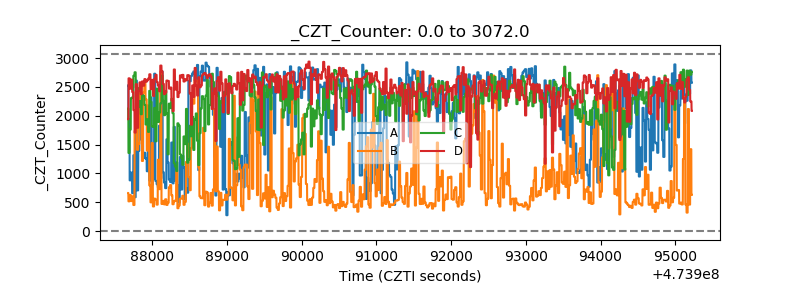 |
| +2.5 Volts monitor |  |
| +5 Volts monitor | 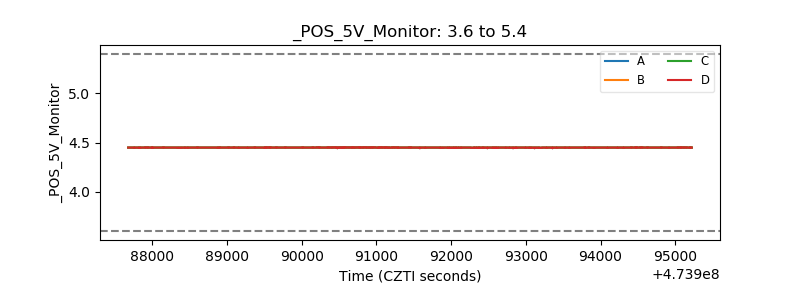 |
| _ROLL_ROT | 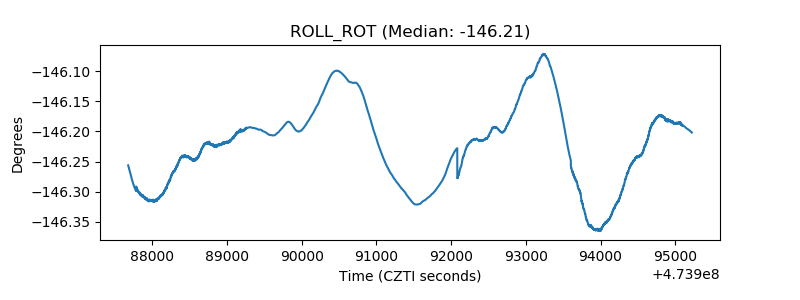 |
| _Roll_DEC | 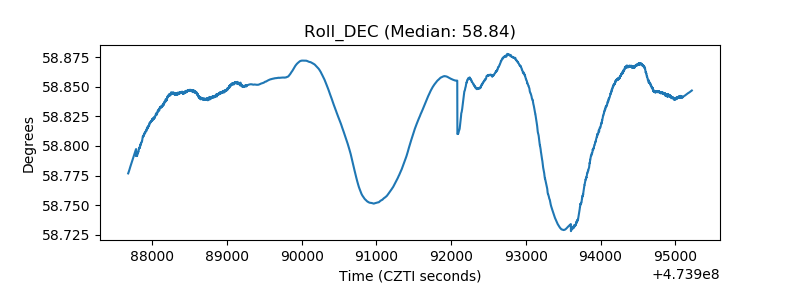 |
| _Roll_RA | 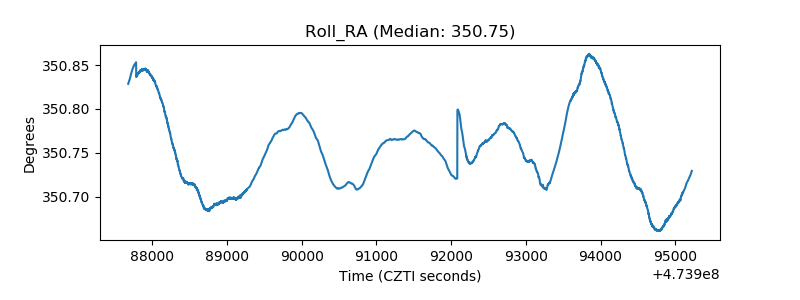 |
| Veto Counter | 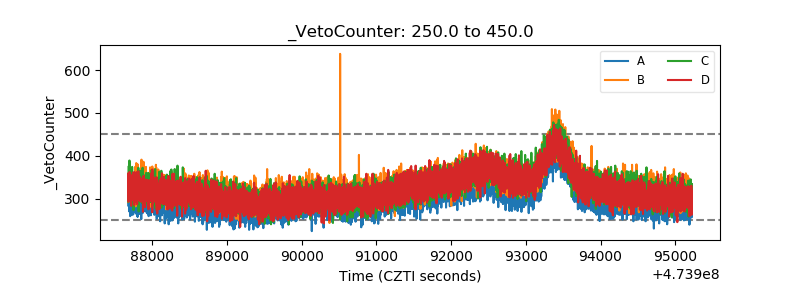 |