| Param | Original file | Final file |
|---|---|---|
| Filename | modeM0/AS1C09_003T01_9000006442_50198cztM0_level2.fits | modeM0/AS1C09_003T01_9000006442_50198cztM0_level2_quad_clean.evt |
| Size (bytes) | 901,627,200 | 61,980,480 |
| Size | 859.9 MB | 59.1 MB |
| Events in quadrant A | 5,055,331 | 512,487 |
| Events in quadrant B | 4,016,912 | 573,287 |
| Events in quadrant C | 13,674,695 | 54,934 |
| Events in quadrant D | 10,167,840 | 319,561 |
| Mode M9 | |||
|---|---|---|---|
| Quadrant | BADHDUFLAG | Total packets | Discarded packets |
| A | 0 | 9 | 0 |
| B | 0 | 9 | 0 |
| C | 0 | 9 | 0 |
| D | 0 | 9 | 0 |
| Mode M0 | |||
|---|---|---|---|
| Quadrant | BADHDUFLAG | Total packets | Discarded packets |
| A | 0 | 18957 | 1 |
| B | 0 | 16027 | 1 |
| C | 0 | 44636 | 1 |
| D | 0 | 34308 | 3 |
| Mode SS | |||
|---|---|---|---|
| Quadrant | BADHDUFLAG | Total packets | Discarded packets |
| A | 0 | 122 | 0 |
| B | 0 | 122 | 0 |
| C | 0 | 122 | 0 |
| D | 0 | 122 | 0 |
| Quadrant | Total seconds | Saturated seconds | Saturation percentage |
|---|---|---|---|
| A | 5953 | 504 | 8.466320% |
| B | 5953 | 280 | 4.703511% |
| C | 5953 | 5450 | 91.550479% |
| D | 5952 | 2391 | 40.171371% |
Noise dominated data is calculated using 1-second bins in cleaned event files. If a bin has >2000 counts, and if more than 50% of those come from <1% of pixels, then it is considered to be noise-dominated and hence unusable.
| Quadrant | # 1 sec bins | Bins with >0 counts | Bins with >2000 counts | High rate bins dominated by noise | Noise dominated (total time) | Noise dominated (detector-on time) | Marked lightcurve |
|---|---|---|---|---|---|---|---|
| A | 6838 | 5954 | 371 | 371 | 5.43% | 6.23% | 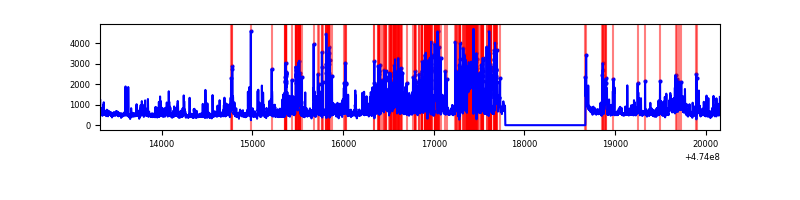 |
| B | 6838 | 5954 | 179 | 179 | 2.62% | 3.01% | 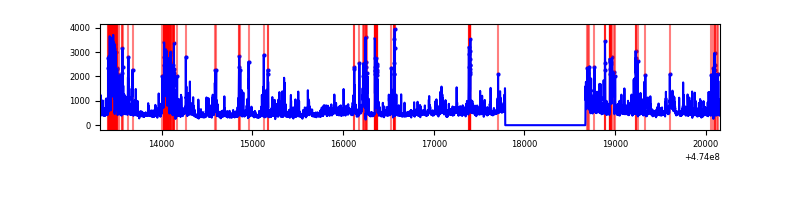 |
| C | 6837 | 5952 | 4520 | 4520 | 66.11% | 75.94% | 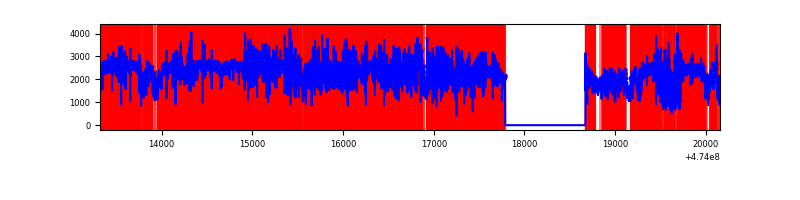 |
| D | 6837 | 5952 | 2384 | 2384 | 34.87% | 40.05% | 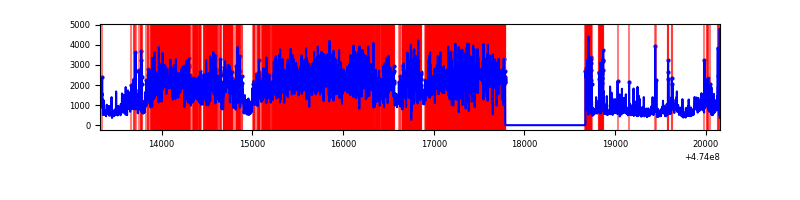 |
Top three noisy pixels from each quadrant. If the there are fewer than three noisy pixels in the level2.evt file, extra rows are filled as -1
| Pixel properties | Quadrant properties | ||||||
|---|---|---|---|---|---|---|---|
| Quadrant | DetID | PixID | Counts | Sigma | Mean | Median | Sigma |
| A | 0 | 98 | 670234 | 4479.58 | 599 | 585 | 149.5 |
| A | 11 | 7 | 339624 | 2267.98 | 599 | 585 | 149.5 |
| A | 8 | 8 | 332337 | 2219.24 | 599 | 585 | 149.5 |
| B | 3 | 249 | 625742 | 4883.95 | 603 | 584 | 128.0 |
| B | 4 | 206 | 515682 | 4024.12 | 603 | 584 | 128.0 |
| B | 0 | 213 | 51317 | 396.34 | 603 | 584 | 128.0 |
| C | 4 | 111 | 7923915 | 111453.01 | 235 | 232 | 71.1 |
| C | 15 | 213 | 1335922 | 18787.56 | 235 | 232 | 71.1 |
| C | 15 | 196 | 613549 | 8626.8 | 235 | 232 | 71.1 |
| D | 15 | 185 | 1941074 | 13284.91 | 510 | 493 | 146.1 |
| D | 7 | 61 | 1320287 | 9035.1 | 510 | 493 | 146.1 |
| D | 15 | 168 | 878480 | 6010.56 | 510 | 493 | 146.1 |
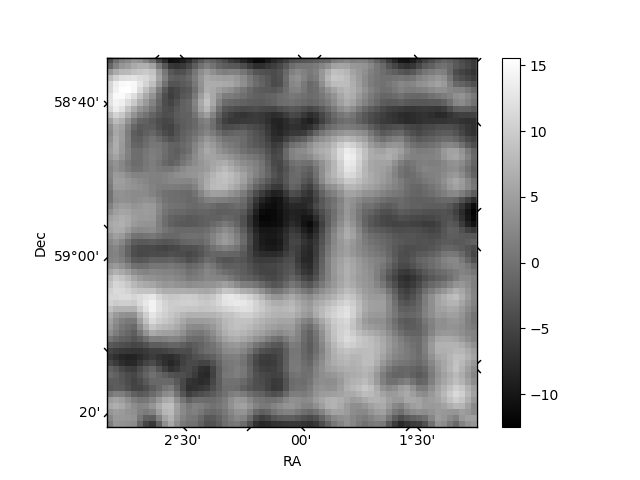
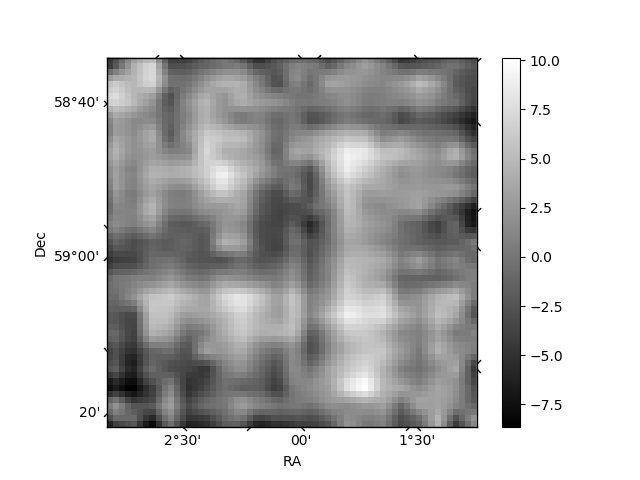
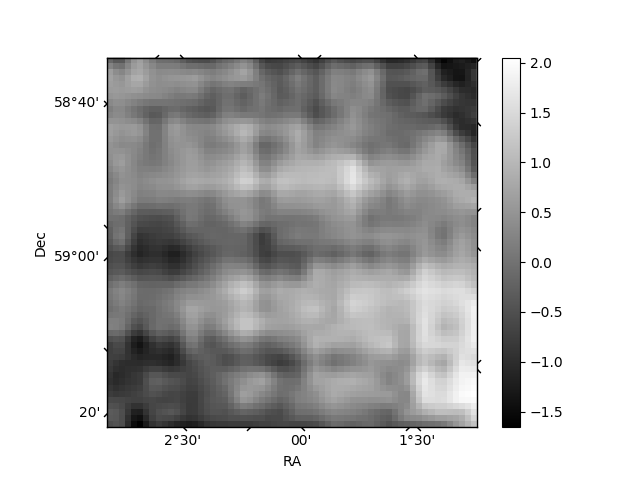
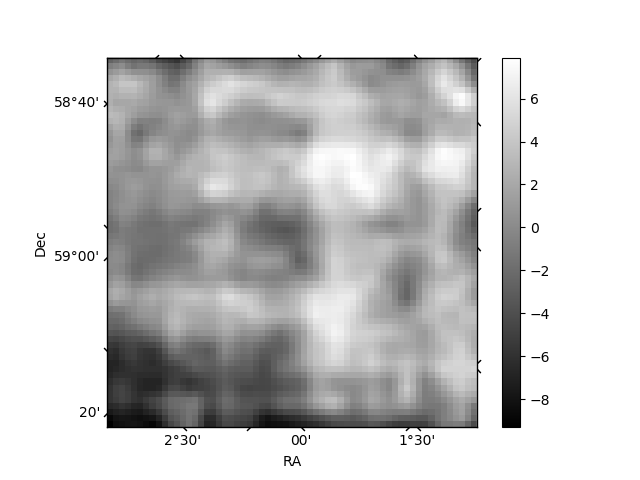
Histogram calculated using DETX and DETY for each event in the final _common_clean file
| Quadrant A | 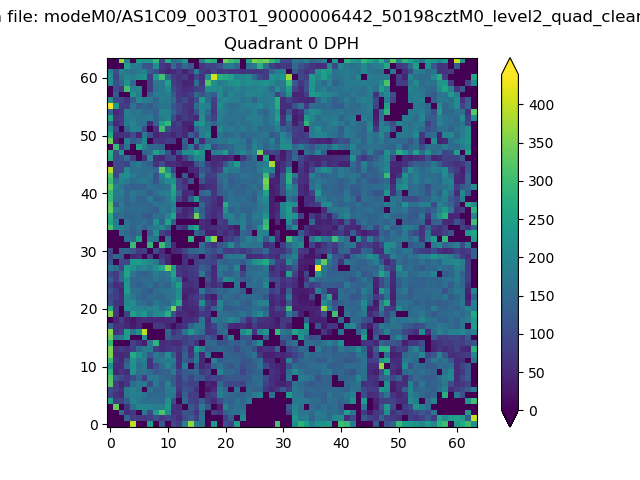 |
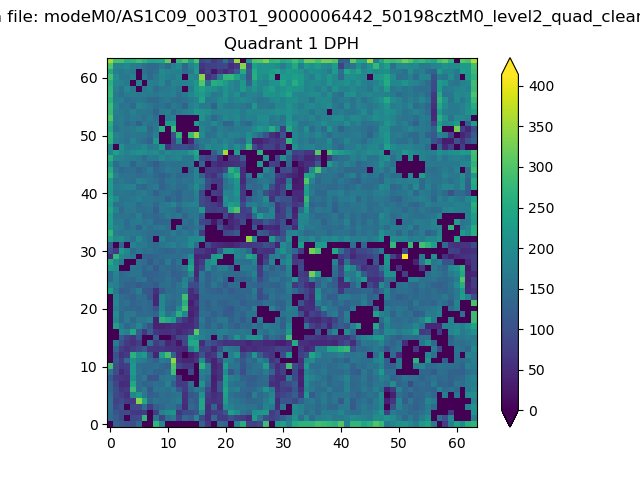 |
Quadrant B |
|---|---|---|---|
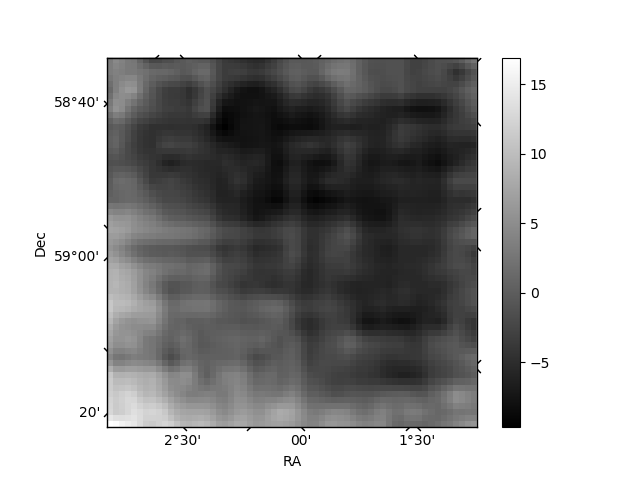
| Quadrant D | 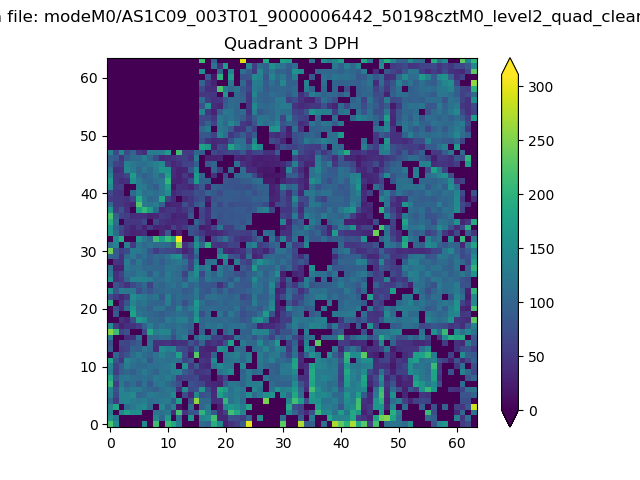 |
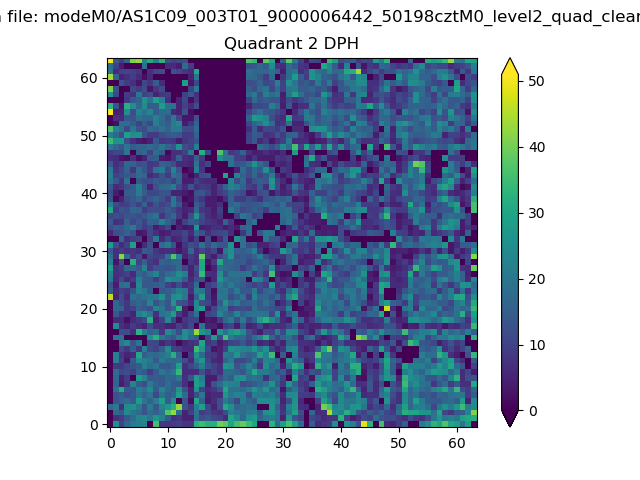 |
Quadrant C |
| Plot type | Count rate plots | Images |
|---|---|---|
| Comparison with Poisson distribution Blue bars denote a histogram of data divided into 1 sec bins. Red curve is a Poisson curve with rate = median count rate of data. |
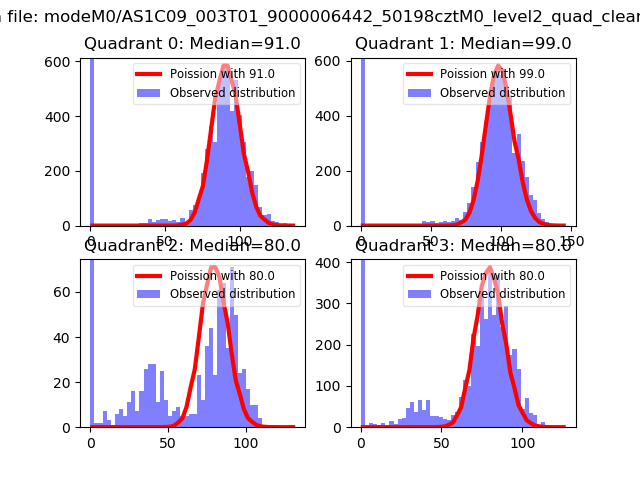 |
 |
| Quadrant-wise count rates Data is divided into 100 sec bins |
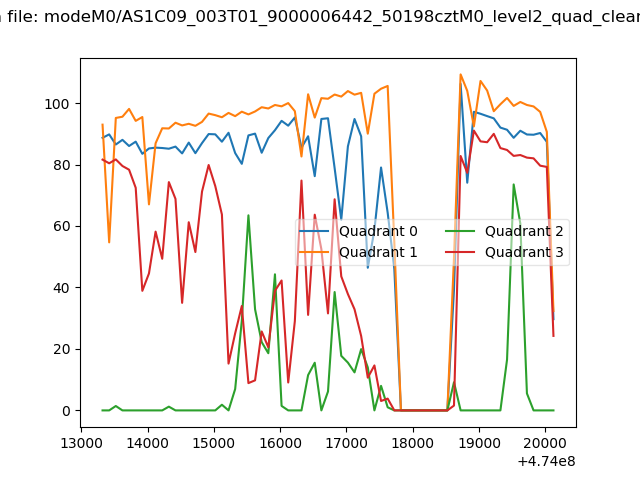 |
|
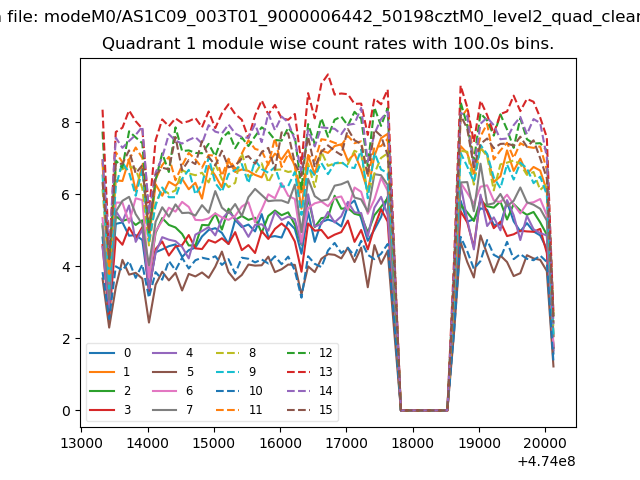
| Module-wise count rates for Quadrant A Data is divided into 100 sec bins |
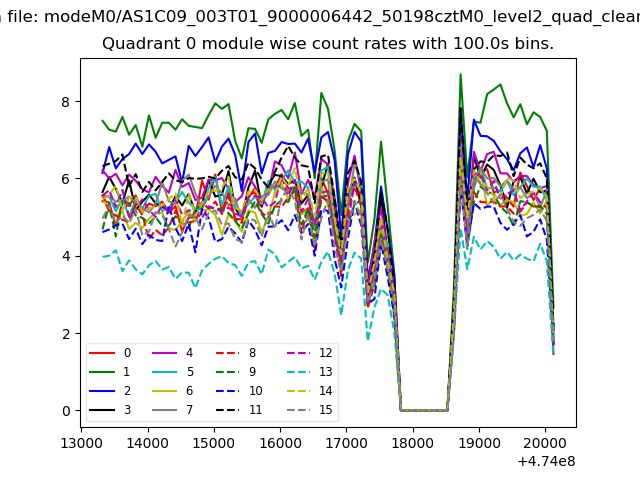 |
 |
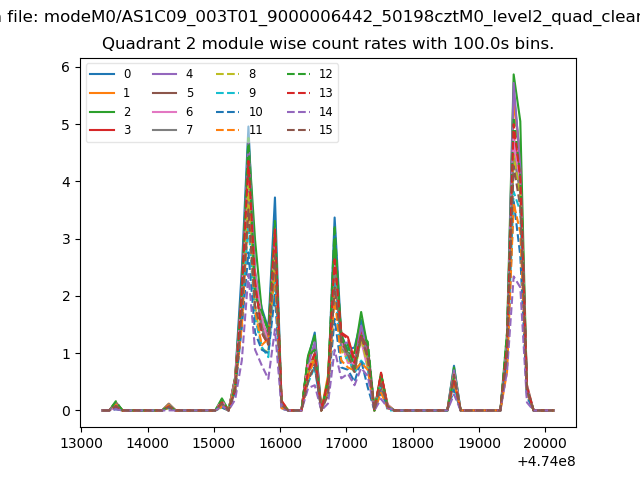
| Module-wise count rates for Quadrant B Data is divided into 100 sec bins |
 |
 |
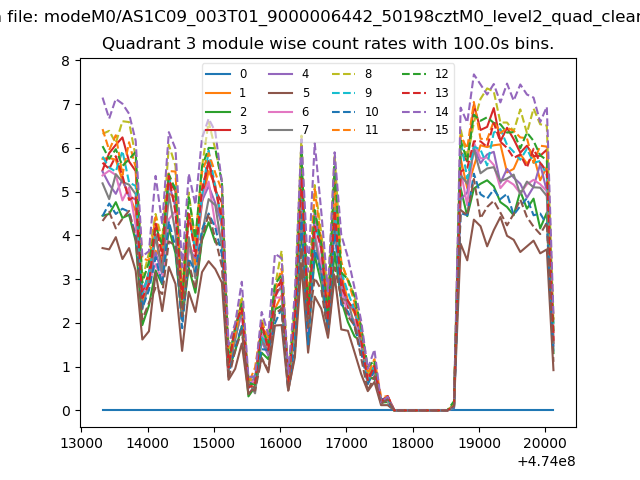
| Module-wise count rates for Quadrant C Data is divided into 100 sec bins |
 |
 |
| Module-wise count rates for Quadrant D Data is divided into 100 sec bins |
 |
 |
| Parameter | Plot |
|---|---|
| CZT HV Monitor | 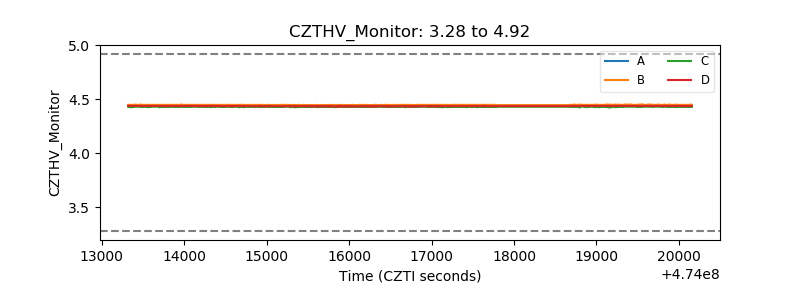 |
| D_VDD | 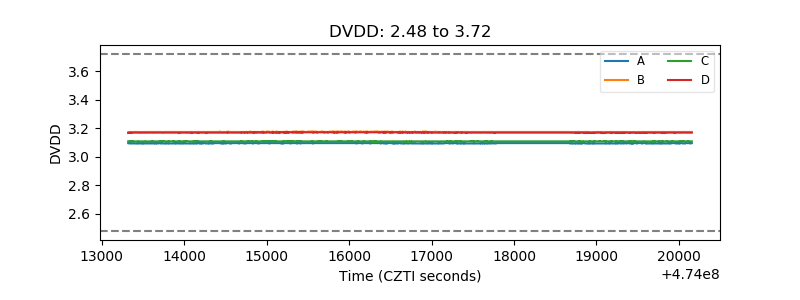 |
| Temperature 1 | 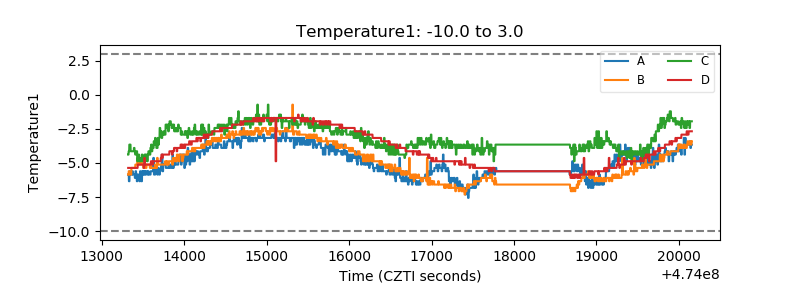 |
| Veto HV Monitor | 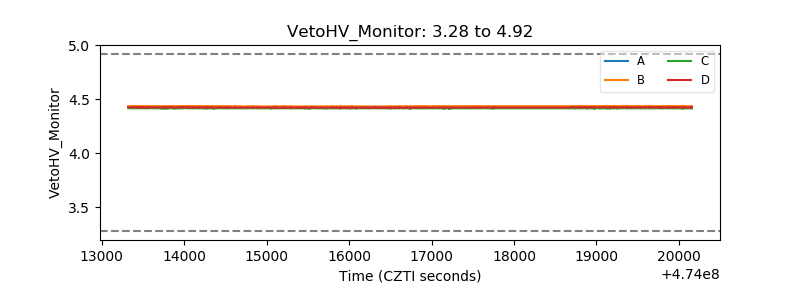 |
| Veto LLD | 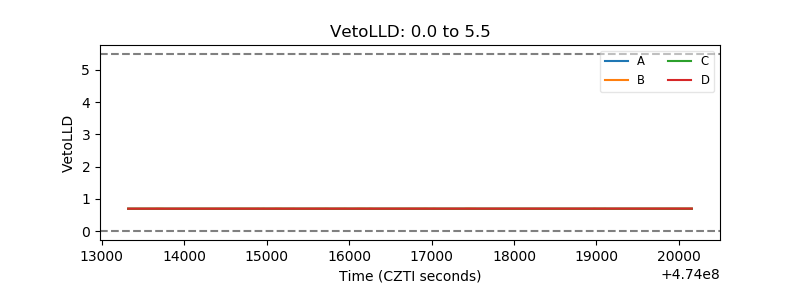 |
| Alpha Counter | 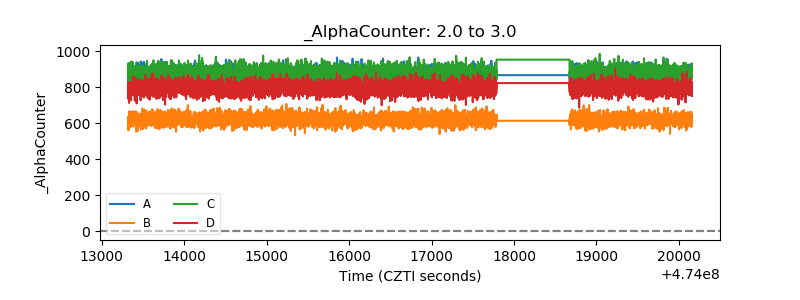 |
| _CPM_Rate | 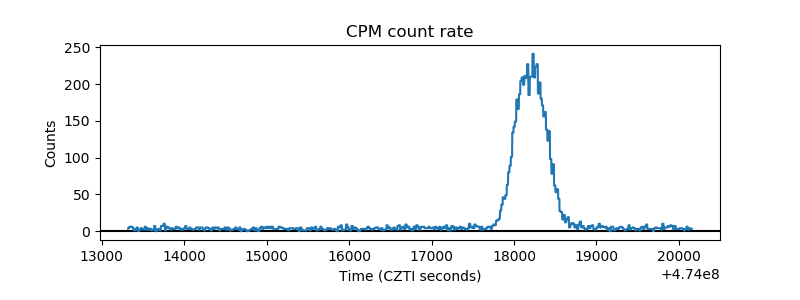 |
| CZT Counter | 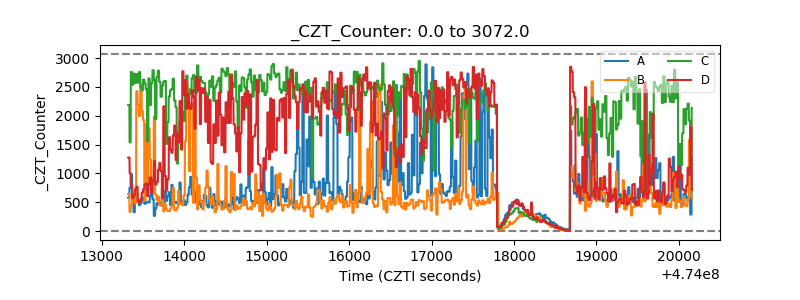 |
| +2.5 Volts monitor | 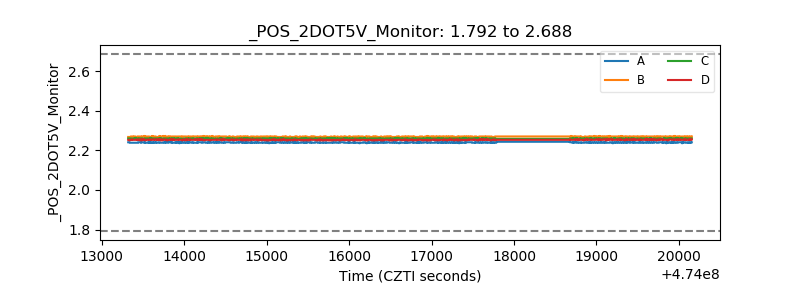 |
| +5 Volts monitor | 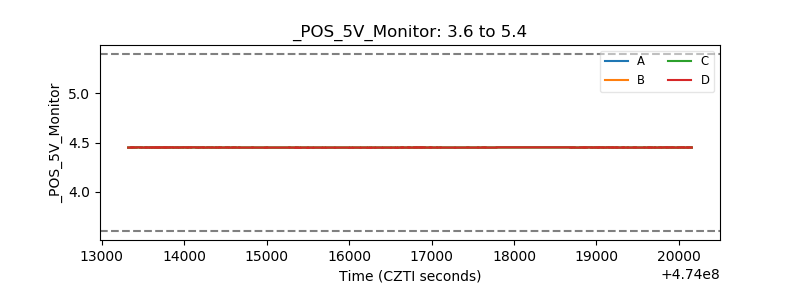 |
| _ROLL_ROT | 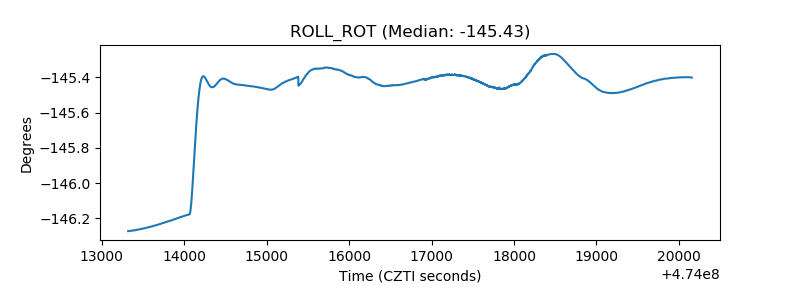 |
| _Roll_DEC | 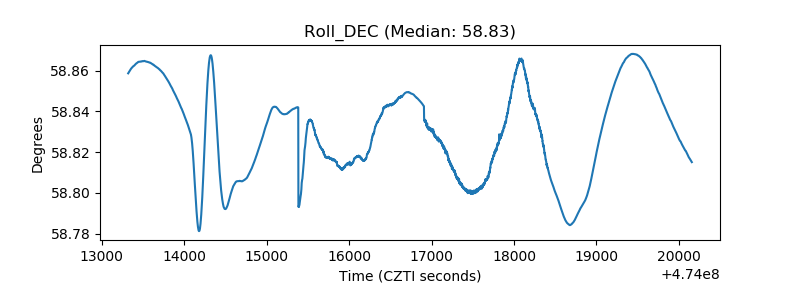 |
| _Roll_RA | 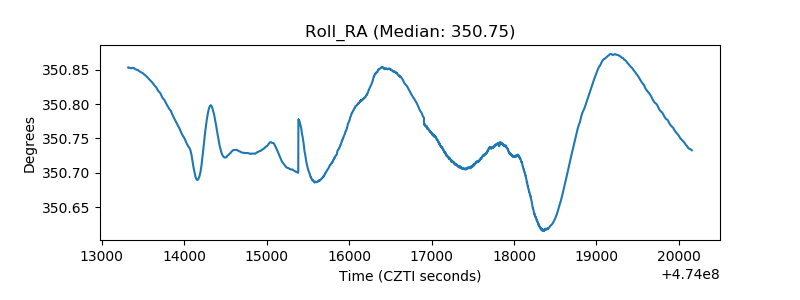 |
| Veto Counter | 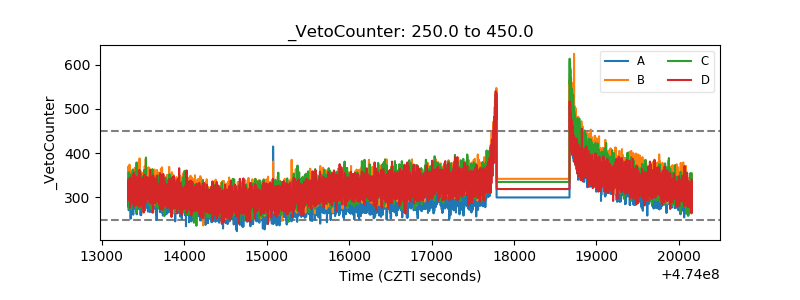 |