| Param | Original file | Final file |
|---|---|---|
| Filename | modeM0/AS1C09_003T01_9000006442_50200cztM0_level2.fits | modeM0/AS1C09_003T01_9000006442_50200cztM0_level2_quad_clean.evt |
| Size (bytes) | 878,428,800 | 66,954,240 |
| Size | 837.7 MB | 63.9 MB |
| Events in quadrant A | 5,443,372 | 526,330 |
| Events in quadrant B | 4,256,926 | 586,859 |
| Events in quadrant C | 12,786,843 | 109,116 |
| Events in quadrant D | 9,562,727 | 382,934 |
| Mode M9 | |||
|---|---|---|---|
| Quadrant | BADHDUFLAG | Total packets | Discarded packets |
| A | 0 | 9 | 0 |
| B | 0 | 9 | 0 |
| C | 0 | 9 | 0 |
| D | 0 | 9 | 0 |
| Mode M0 | |||
|---|---|---|---|
| Quadrant | BADHDUFLAG | Total packets | Discarded packets |
| A | 0 | 20241 | 1 |
| B | 0 | 16833 | 1 |
| C | 0 | 42083 | 1 |
| D | 0 | 32581 | 1 |
| Mode SS | |||
|---|---|---|---|
| Quadrant | BADHDUFLAG | Total packets | Discarded packets |
| A | 0 | 122 | 0 |
| B | 0 | 122 | 0 |
| C | 0 | 122 | 0 |
| D | 0 | 122 | 0 |
| Quadrant | Total seconds | Saturated seconds | Saturation percentage |
|---|---|---|---|
| A | 6035 | 583 | 9.660315% |
| B | 6035 | 358 | 5.932063% |
| C | 6035 | 4983 | 82.568351% |
| D | 6035 | 1792 | 29.693455% |
Noise dominated data is calculated using 1-second bins in cleaned event files. If a bin has >2000 counts, and if more than 50% of those come from <1% of pixels, then it is considered to be noise-dominated and hence unusable.
| Quadrant | # 1 sec bins | Bins with >0 counts | Bins with >2000 counts | High rate bins dominated by noise | Noise dominated (total time) | Noise dominated (detector-on time) | Marked lightcurve |
|---|---|---|---|---|---|---|---|
| A | 7005 | 6035 | 379 | 379 | 5.41% | 6.28% | 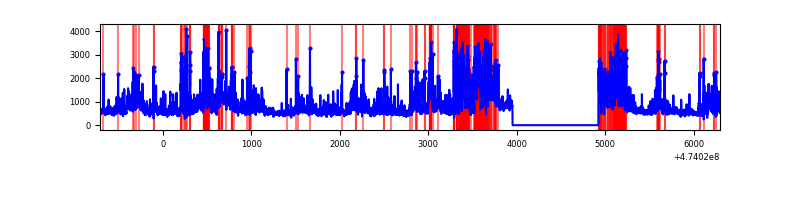 |
| B | 7005 | 6035 | 167 | 167 | 2.38% | 2.77% | 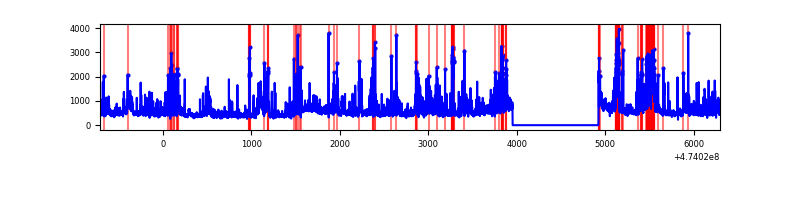 |
| C | 7005 | 6035 | 3901 | 3901 | 55.69% | 64.64% | 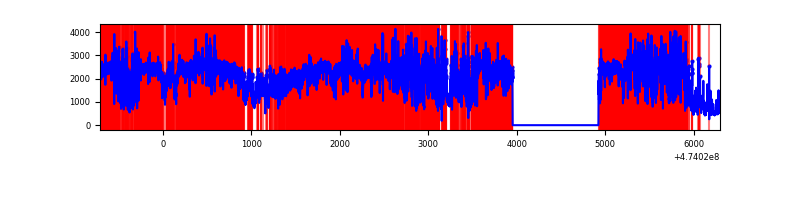 |
| D | 7005 | 6035 | 1860 | 1860 | 26.55% | 30.82% | 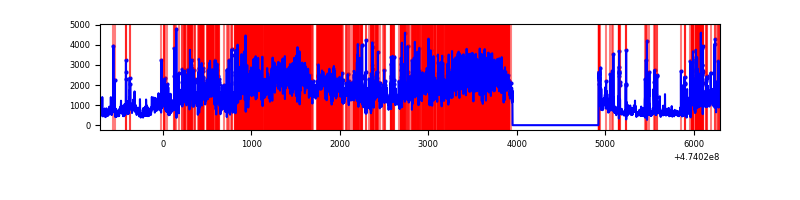 |
Top three noisy pixels from each quadrant. If the there are fewer than three noisy pixels in the level2.evt file, extra rows are filled as -1
| Pixel properties | Quadrant properties | ||||||
|---|---|---|---|---|---|---|---|
| Quadrant | DetID | PixID | Counts | Sigma | Mean | Median | Sigma |
| A | 11 | 7 | 524608 | 3400.37 | 613 | 597 | 154.1 |
| A | 0 | 98 | 388664 | 2518.21 | 613 | 597 | 154.1 |
| A | 4 | 156 | 336904 | 2182.33 | 613 | 597 | 154.1 |
| B | 4 | 206 | 1223468 | 9332.65 | 615 | 595 | 131.0 |
| B | 0 | 155 | 124271 | 943.86 | 615 | 595 | 131.0 |
| B | 5 | 172 | 49371 | 372.25 | 615 | 595 | 131.0 |
| C | 4 | 111 | 8306209 | 107082.35 | 249 | 245 | 77.6 |
| C | 15 | 213 | 1753233 | 22599.91 | 249 | 245 | 77.6 |
| C | 15 | 197 | 499040 | 6430.58 | 249 | 245 | 77.6 |
| D | 15 | 185 | 1963858 | 12185.14 | 548 | 527 | 161.1 |
| D | 15 | 108 | 1383164 | 8581.14 | 548 | 527 | 161.1 |
| D | 7 | 61 | 1274116 | 7904.35 | 548 | 527 | 161.1 |
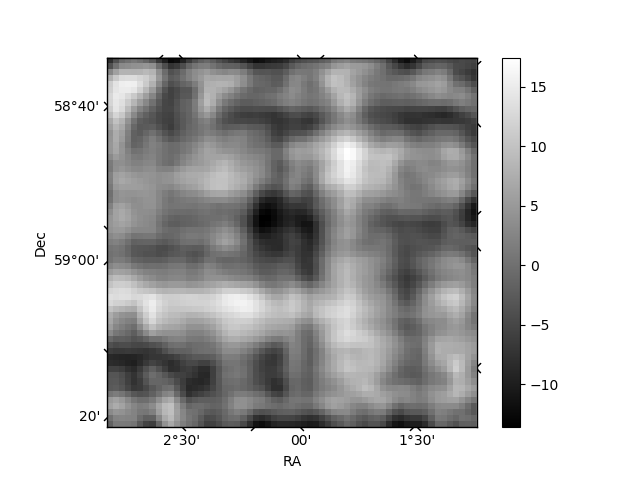
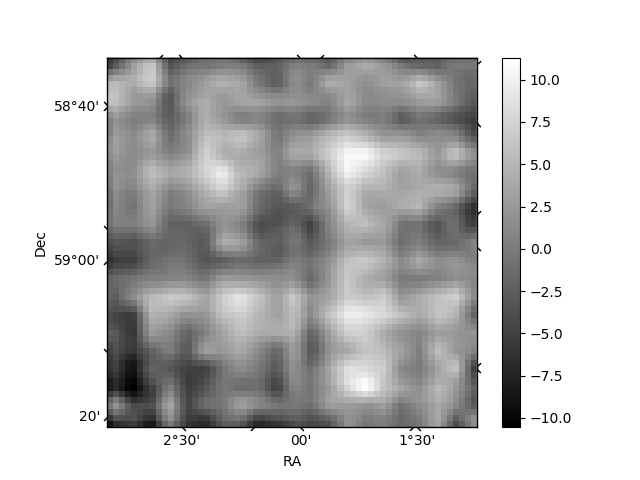
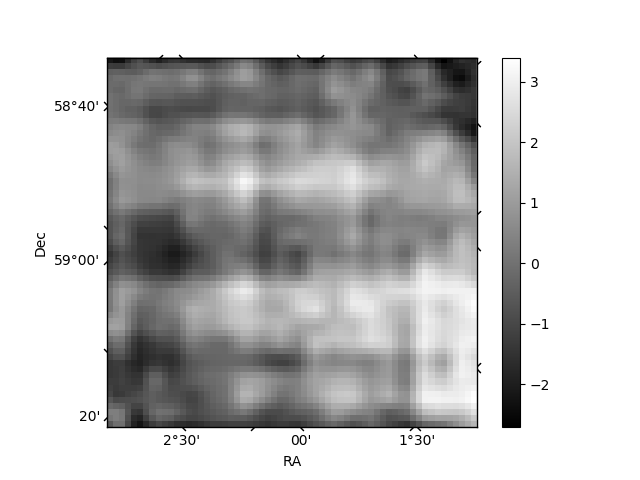
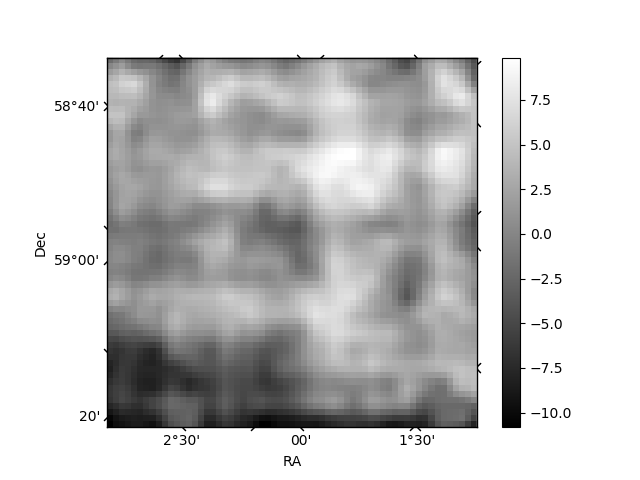
Histogram calculated using DETX and DETY for each event in the final _common_clean file
| Quadrant A | 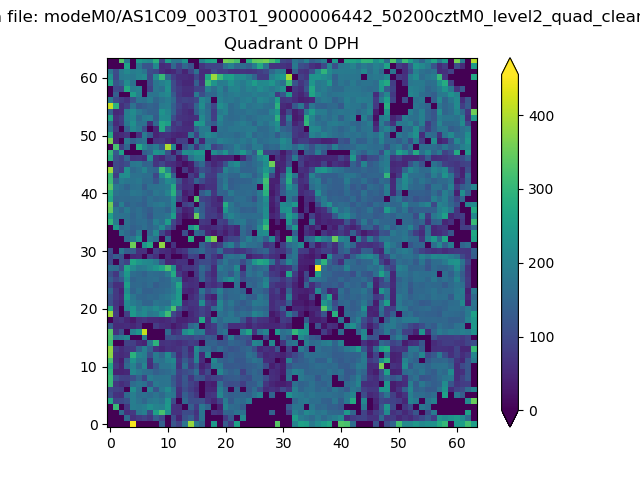 |
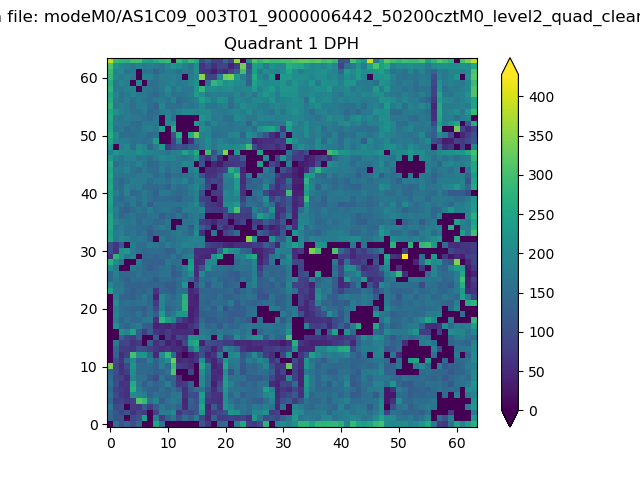 |
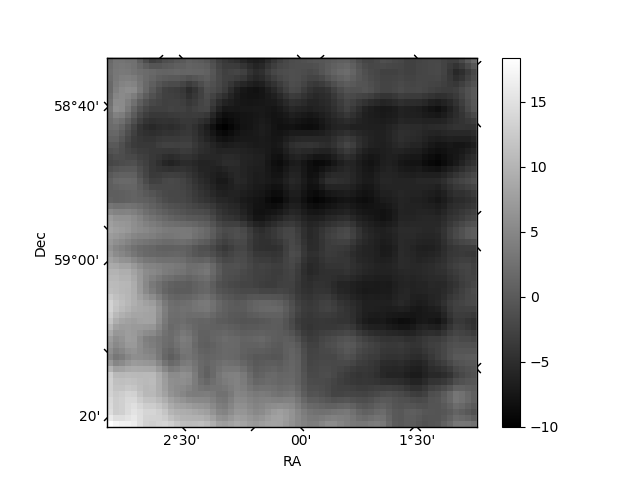
Quadrant B |
|---|---|---|---|
| Quadrant D | 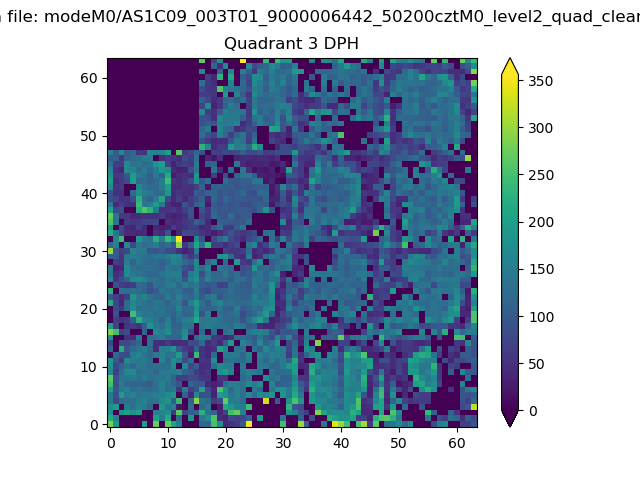 |
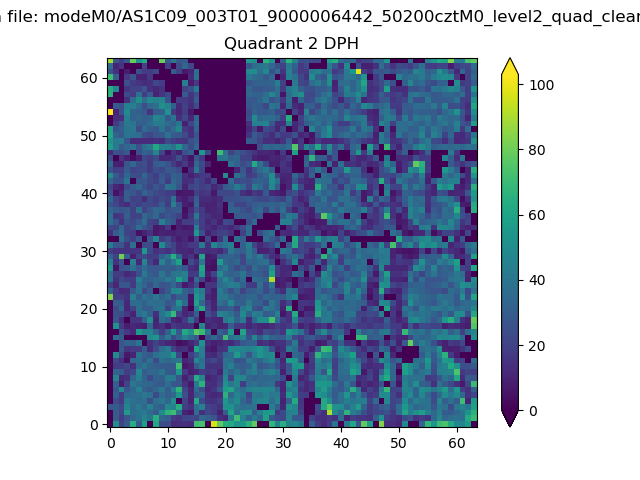 |
Quadrant C |
| Plot type | Count rate plots | Images |
|---|---|---|
| Comparison with Poisson distribution Blue bars denote a histogram of data divided into 1 sec bins. Red curve is a Poisson curve with rate = median count rate of data. |
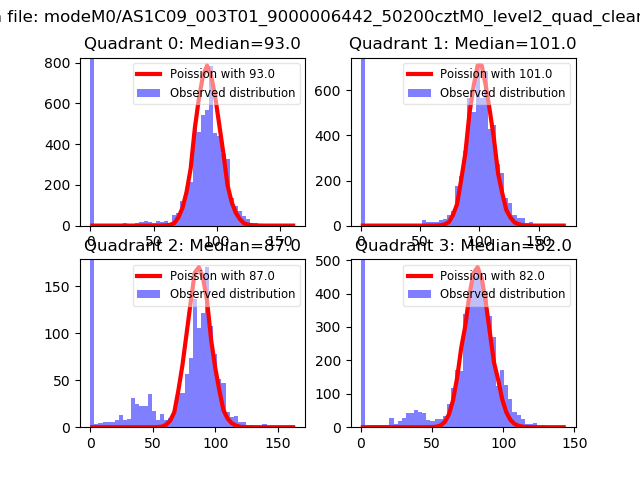 |
 |
| Quadrant-wise count rates Data is divided into 100 sec bins |
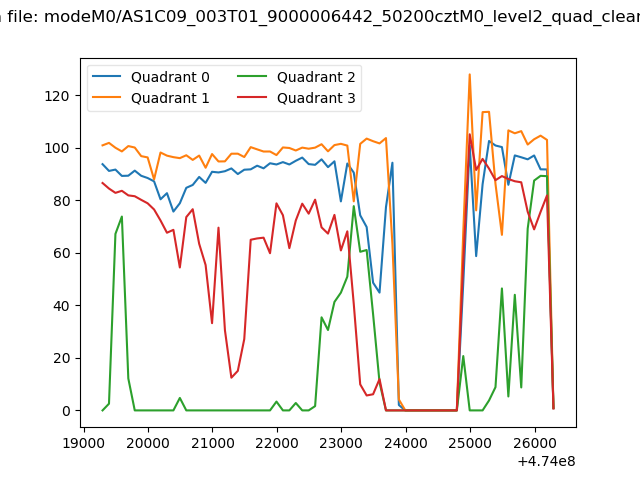 |
|
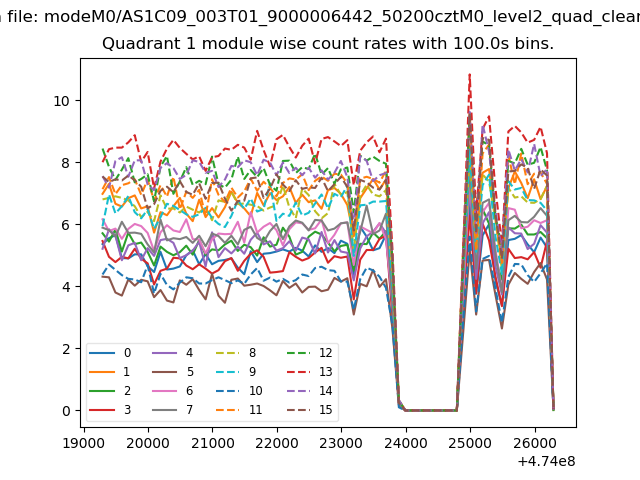
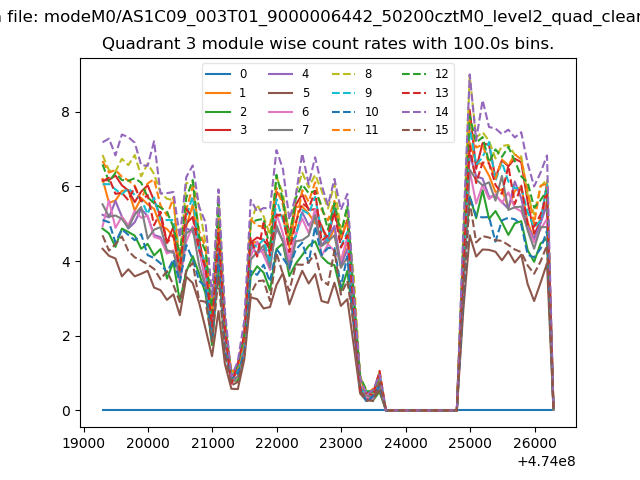
| Module-wise count rates for Quadrant A Data is divided into 100 sec bins |
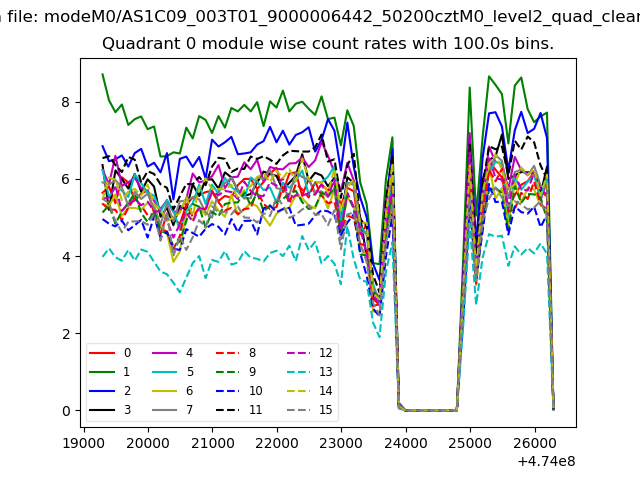 |
 |
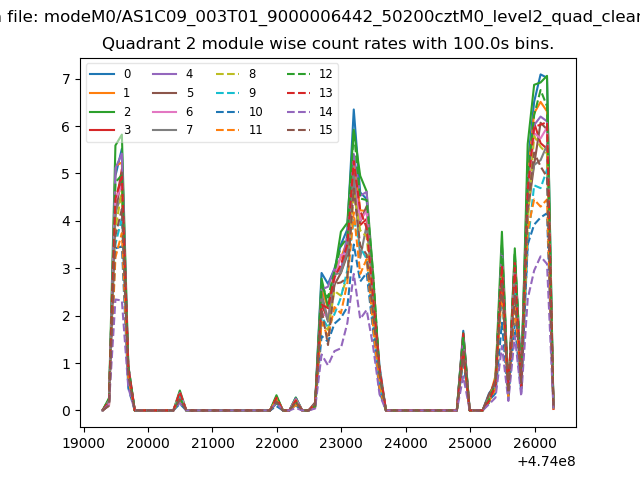
| Module-wise count rates for Quadrant B Data is divided into 100 sec bins |
 |
 |
| Module-wise count rates for Quadrant C Data is divided into 100 sec bins |
 |
 |
| Module-wise count rates for Quadrant D Data is divided into 100 sec bins |
 |
 |
| Parameter | Plot |
|---|---|
| CZT HV Monitor | 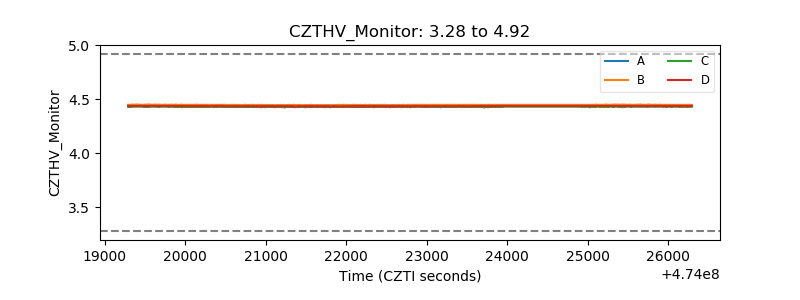 |
| D_VDD | 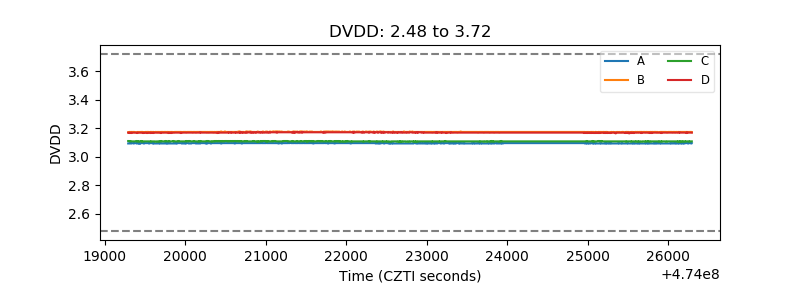 |
| Temperature 1 | 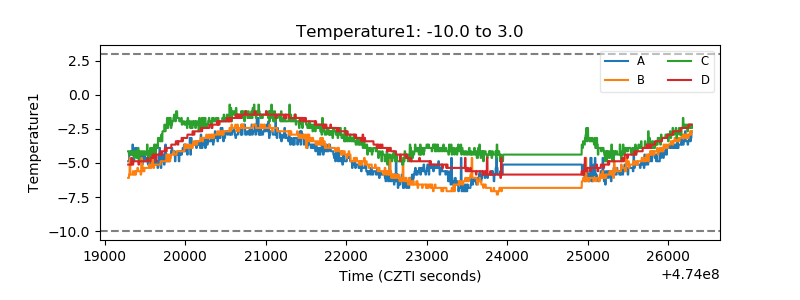 |
| Veto HV Monitor | 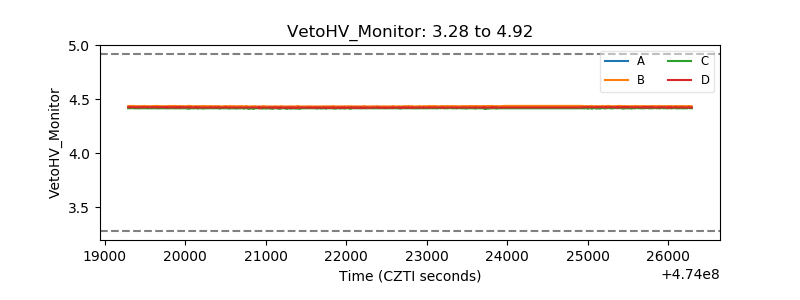 |
| Veto LLD | 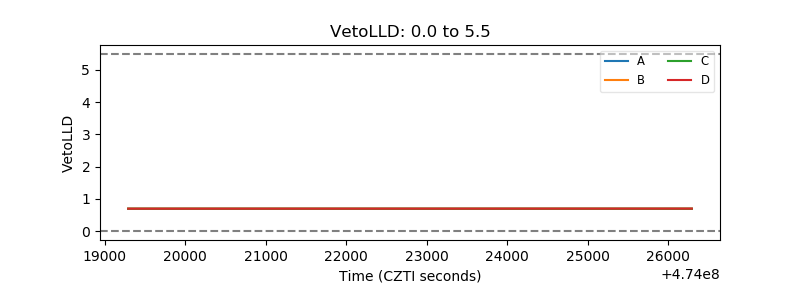 |
| Alpha Counter | 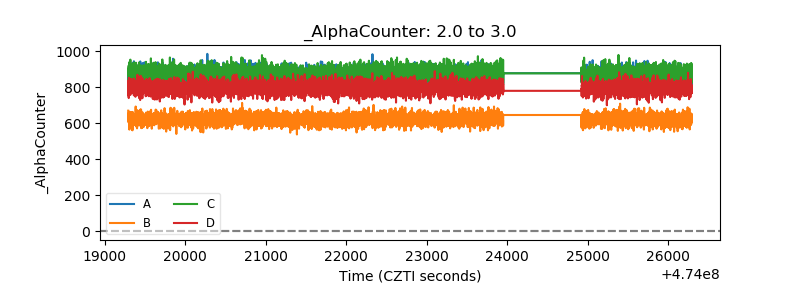 |
| _CPM_Rate | 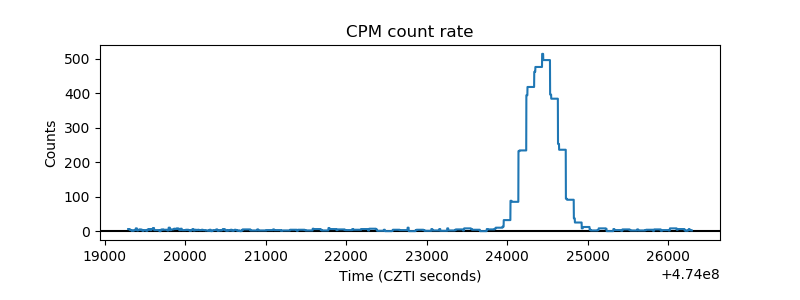 |
| CZT Counter | 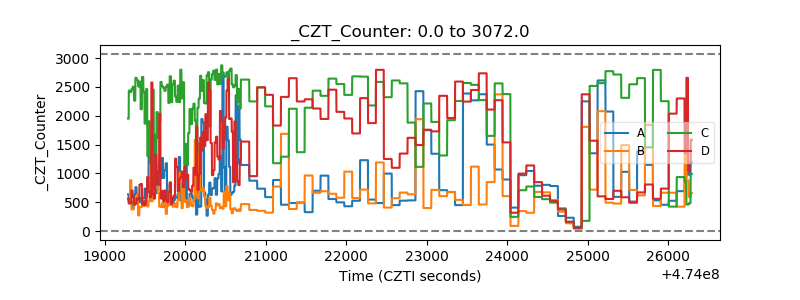 |
| +2.5 Volts monitor |  |
| +5 Volts monitor | 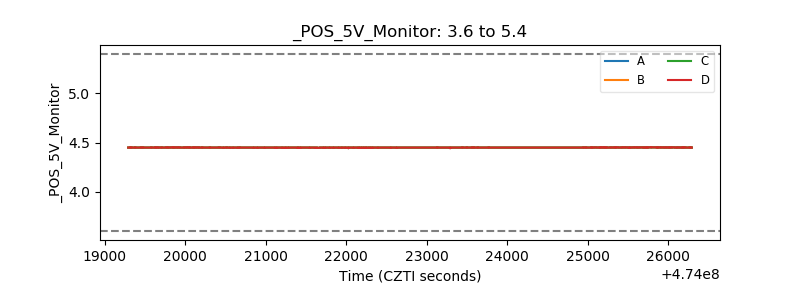 |
| _ROLL_ROT | 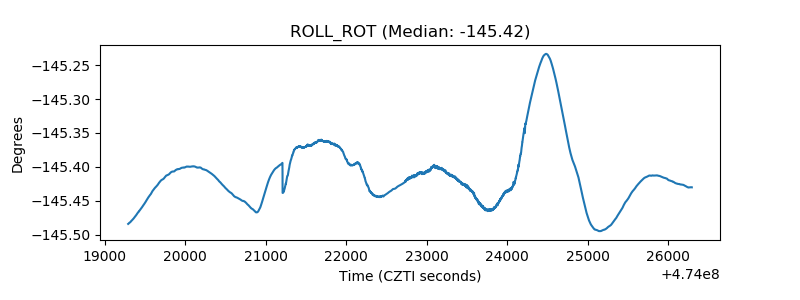 |
| _Roll_DEC | 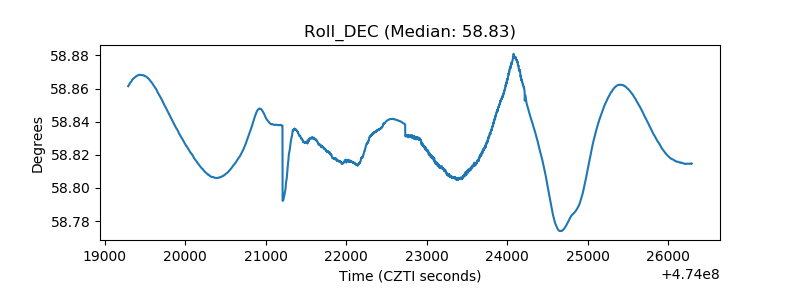 |
| _Roll_RA | 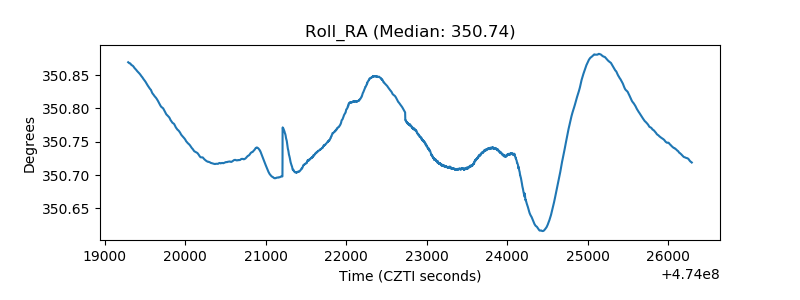 |
| Veto Counter | 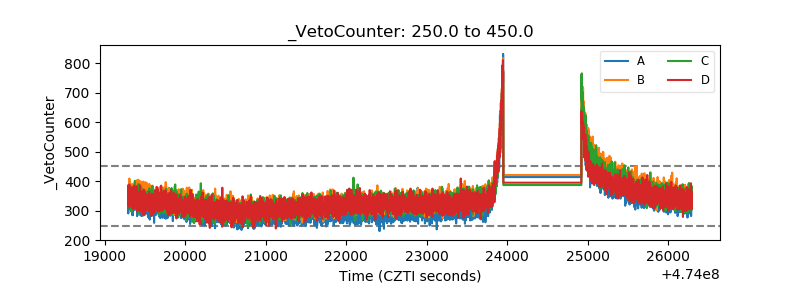 |