| Param | Original file | Final file |
|---|---|---|
| Filename | modeM0/AS1C09_003T01_9000006442_50201cztM0_level2.fits | modeM0/AS1C09_003T01_9000006442_50201cztM0_level2_quad_clean.evt |
| Size (bytes) | 927,282,240 | 67,746,240 |
| Size | 884.3 MB | 64.6 MB |
| Events in quadrant A | 8,353,775 | 387,877 |
| Events in quadrant B | 5,166,981 | 587,309 |
| Events in quadrant C | 10,477,646 | 282,399 |
| Events in quadrant D | 9,863,013 | 373,572 |
| Mode M9 | |||
|---|---|---|---|
| Quadrant | BADHDUFLAG | Total packets | Discarded packets |
| A | 0 | 11 | 0 |
| B | 0 | 11 | 0 |
| C | 0 | 11 | 0 |
| D | 0 | 11 | 0 |
| Mode M0 | |||
|---|---|---|---|
| Quadrant | BADHDUFLAG | Total packets | Discarded packets |
| A | 0 | 28723 | 1 |
| B | 0 | 19485 | 2 |
| C | 0 | 35268 | 1 |
| D | 0 | 33542 | 1 |
| Mode SS | |||
|---|---|---|---|
| Quadrant | BADHDUFLAG | Total packets | Discarded packets |
| A | 0 | 122 | 0 |
| B | 0 | 122 | 0 |
| C | 0 | 122 | 0 |
| D | 0 | 122 | 0 |
| Quadrant | Total seconds | Saturated seconds | Saturation percentage |
|---|---|---|---|
| A | 6011 | 2159 | 35.917485% |
| B | 6010 | 588 | 9.783694% |
| C | 6010 | 3146 | 52.346090% |
| D | 6010 | 2032 | 33.810316% |
Noise dominated data is calculated using 1-second bins in cleaned event files. If a bin has >2000 counts, and if more than 50% of those come from <1% of pixels, then it is considered to be noise-dominated and hence unusable.
| Quadrant | # 1 sec bins | Bins with >0 counts | Bins with >2000 counts | High rate bins dominated by noise | Noise dominated (total time) | Noise dominated (detector-on time) | Marked lightcurve |
|---|---|---|---|---|---|---|---|
| A | 7101 | 6011 | 1890 | 1890 | 26.62% | 31.44% | 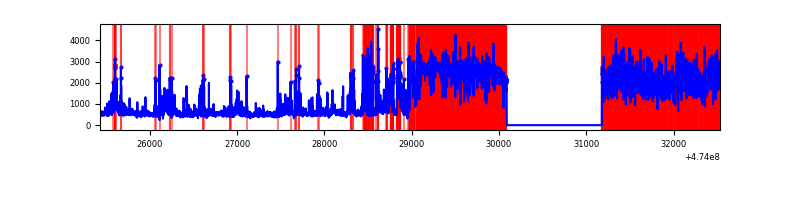 |
| B | 7100 | 6011 | 370 | 370 | 5.21% | 6.16% | 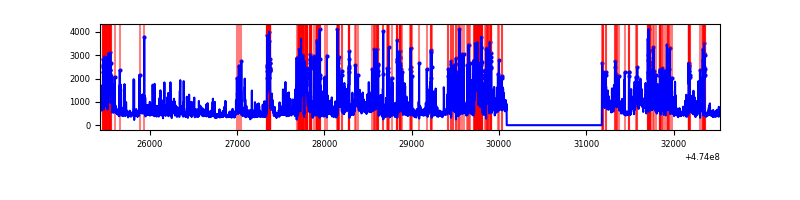 |
| C | 7099 | 6010 | 2729 | 2729 | 38.44% | 45.41% | 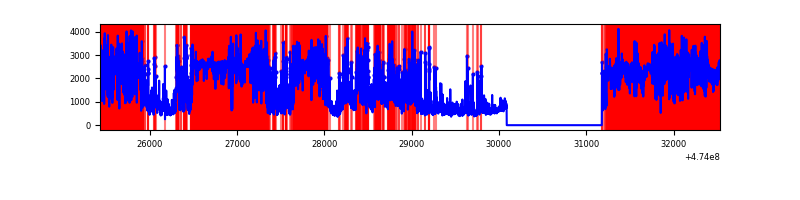 |
| D | 7100 | 6010 | 2054 | 2054 | 28.93% | 34.18% | 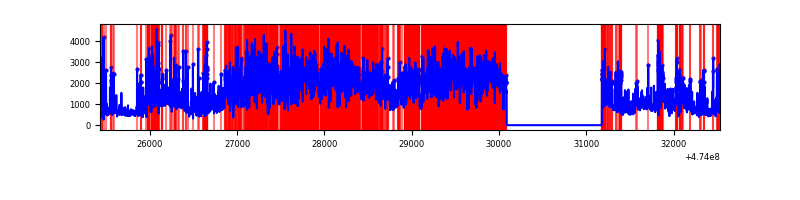 |
Top three noisy pixels from each quadrant. If the there are fewer than three noisy pixels in the level2.evt file, extra rows are filled as -1
| Pixel properties | Quadrant properties | ||||||
|---|---|---|---|---|---|---|---|
| Quadrant | DetID | PixID | Counts | Sigma | Mean | Median | Sigma |
| A | 6 | 250 | 2236358 | 16832.09 | 531 | 518 | 132.8 |
| A | 8 | 8 | 1956197 | 14722.95 | 531 | 518 | 132.8 |
| A | 0 | 98 | 428286 | 3220.37 | 531 | 518 | 132.8 |
| B | 4 | 206 | 2056221 | 15770.04 | 614 | 595 | 130.4 |
| B | 0 | 155 | 142204 | 1086.37 | 614 | 595 | 130.4 |
| B | 12 | 3 | 54652 | 414.71 | 614 | 595 | 130.4 |
| C | 4 | 111 | 6604429 | 53302.48 | 434 | 431 | 123.9 |
| C | 15 | 213 | 839840 | 6775.08 | 434 | 431 | 123.9 |
| C | 1 | 60 | 189541 | 1526.35 | 434 | 431 | 123.9 |
| D | 7 | 61 | 2100613 | 13554.97 | 536 | 516 | 154.9 |
| D | 15 | 185 | 1433931 | 9251.91 | 536 | 516 | 154.9 |
| D | 15 | 108 | 1197625 | 7726.68 | 536 | 516 | 154.9 |
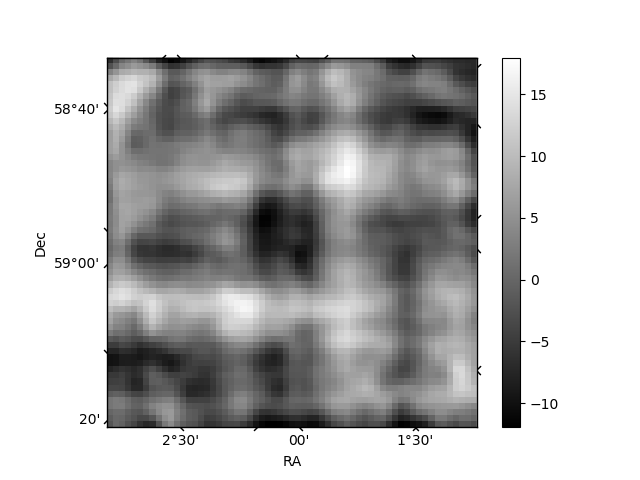
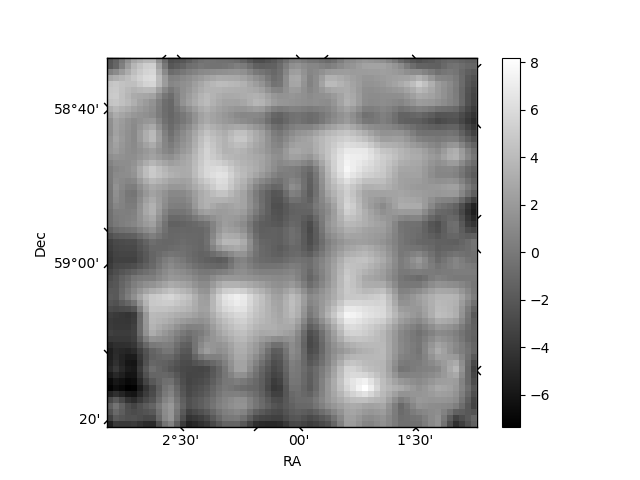
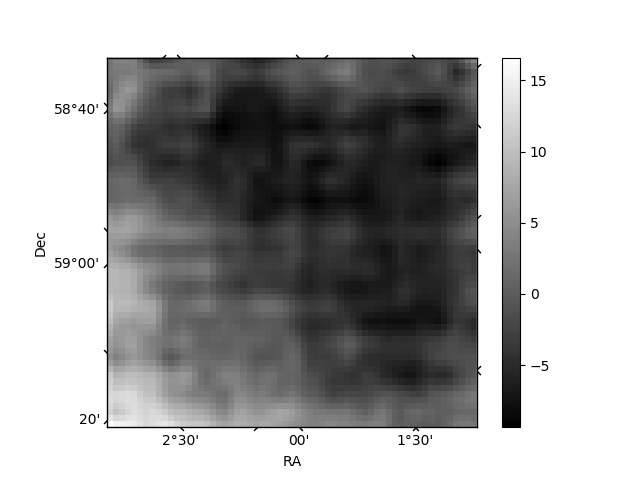
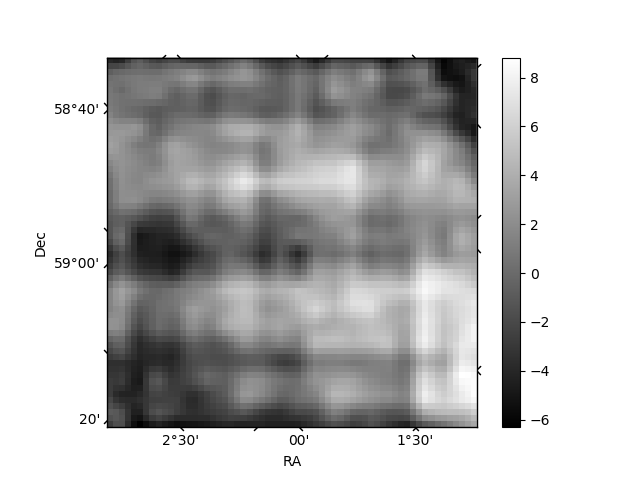
Histogram calculated using DETX and DETY for each event in the final _common_clean file
| Quadrant A | 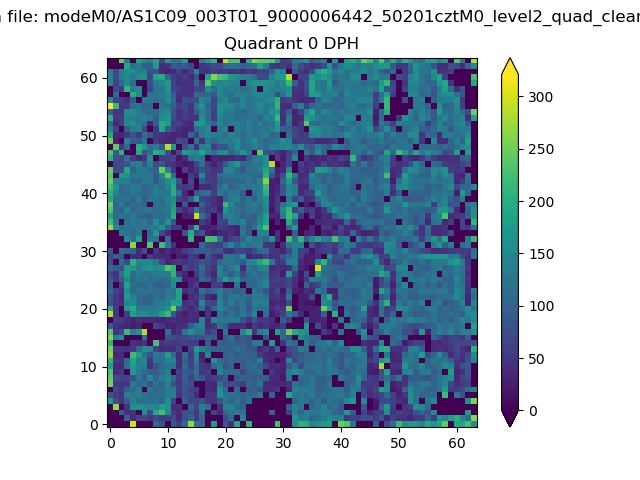 |
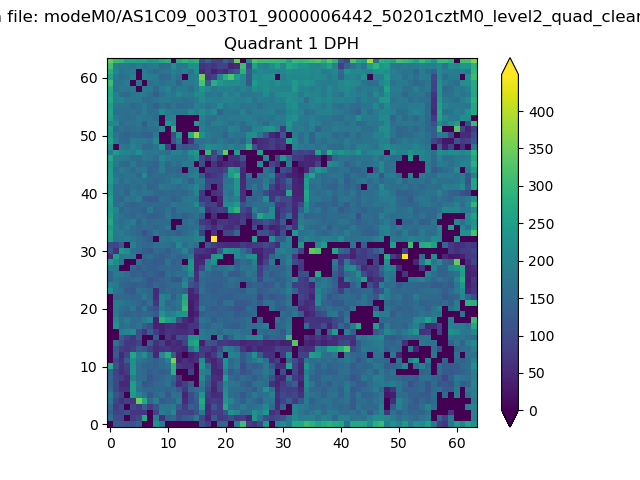 |
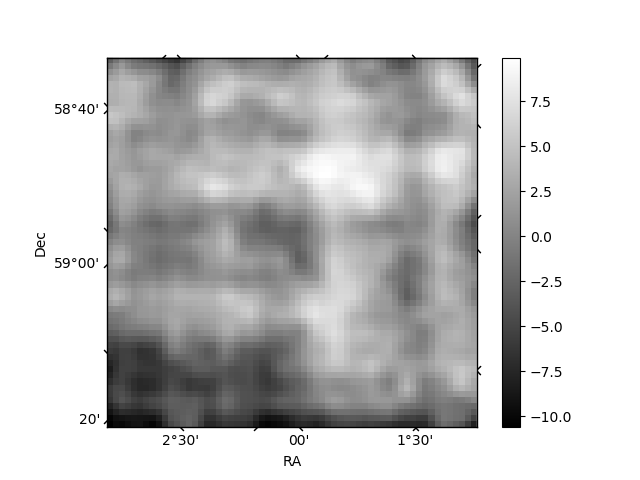
Quadrant B |
|---|---|---|---|
| Quadrant D | 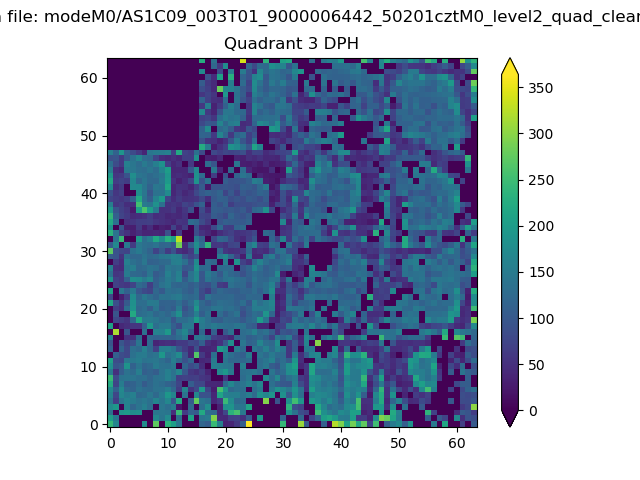 |
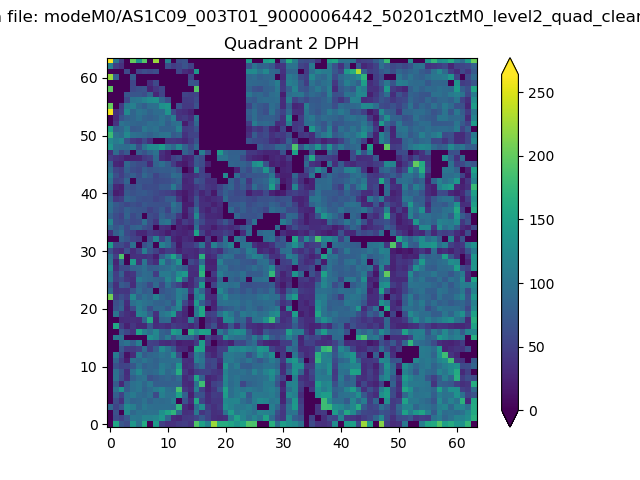 |
Quadrant C |
| Plot type | Count rate plots | Images |
|---|---|---|
| Comparison with Poisson distribution Blue bars denote a histogram of data divided into 1 sec bins. Red curve is a Poisson curve with rate = median count rate of data. |
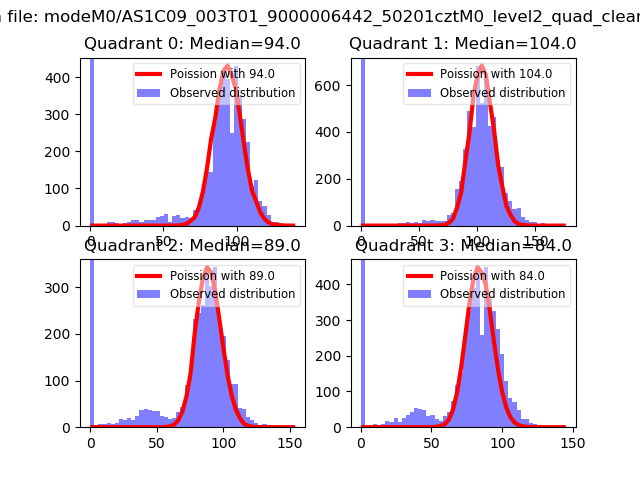 |
 |
| Quadrant-wise count rates Data is divided into 100 sec bins |
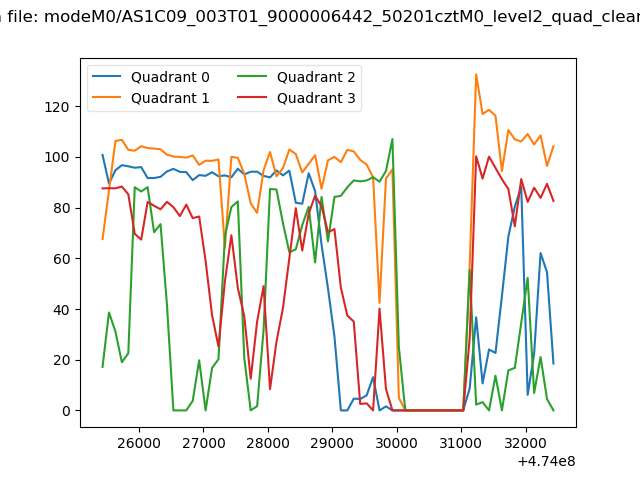 |
|
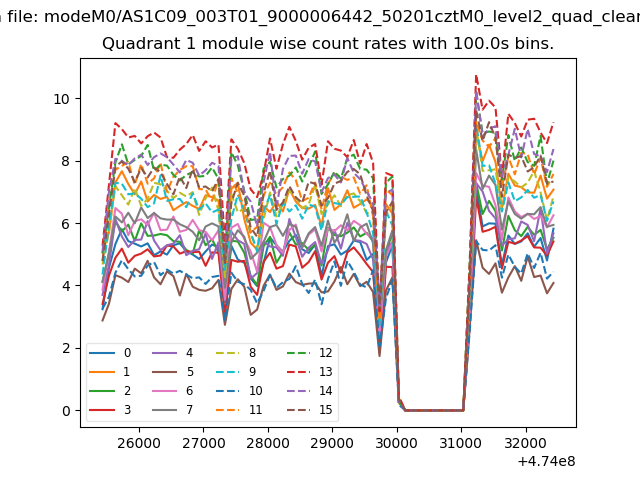
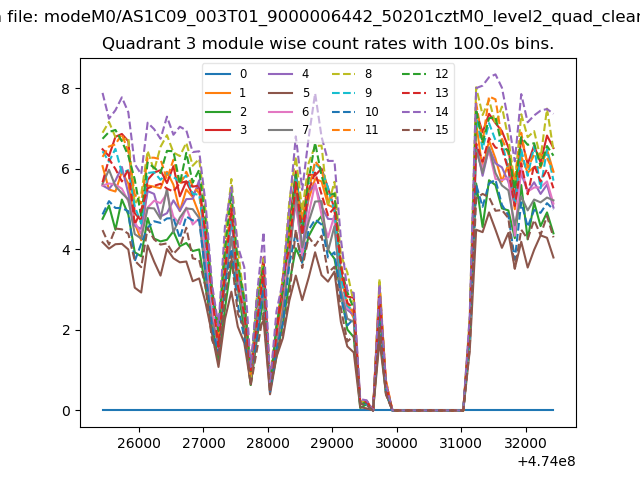
| Module-wise count rates for Quadrant A Data is divided into 100 sec bins |
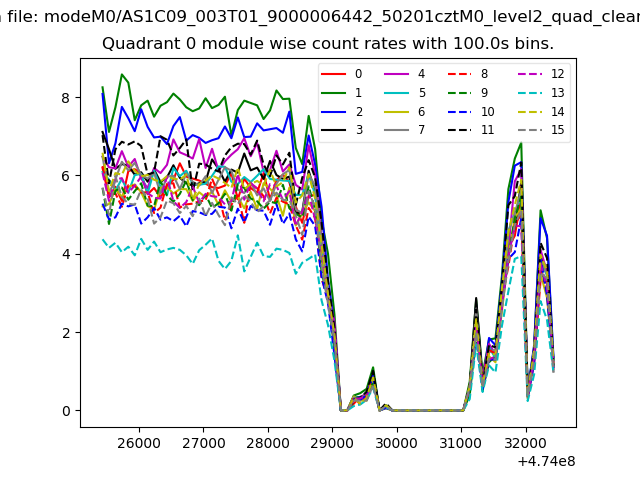 |
 |
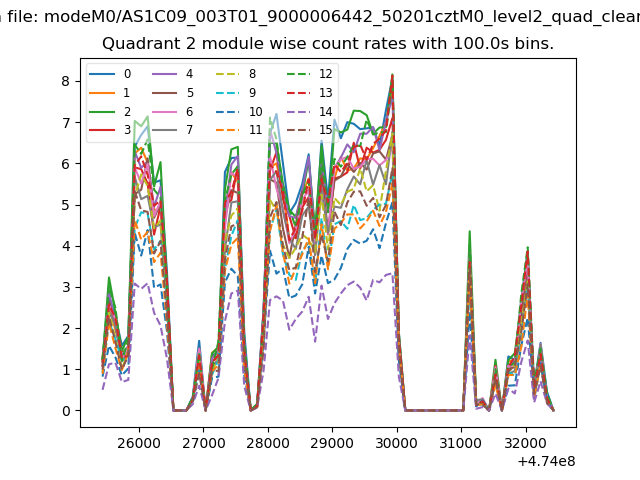
| Module-wise count rates for Quadrant B Data is divided into 100 sec bins |
 |
 |
| Module-wise count rates for Quadrant C Data is divided into 100 sec bins |
 |
 |
| Module-wise count rates for Quadrant D Data is divided into 100 sec bins |
 |
 |
| Parameter | Plot |
|---|---|
| CZT HV Monitor | 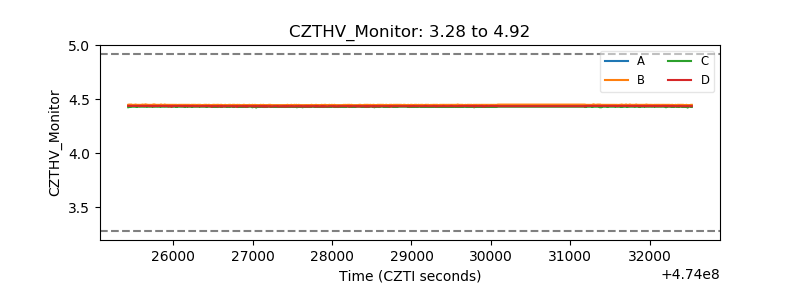 |
| D_VDD | 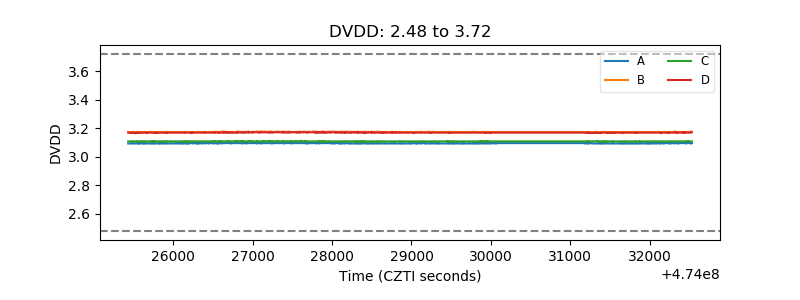 |
| Temperature 1 | 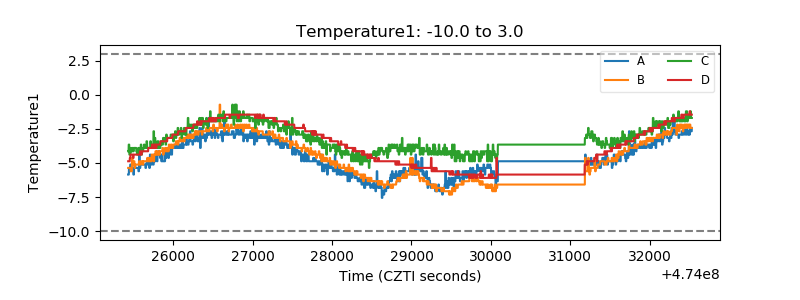 |
| Veto HV Monitor | 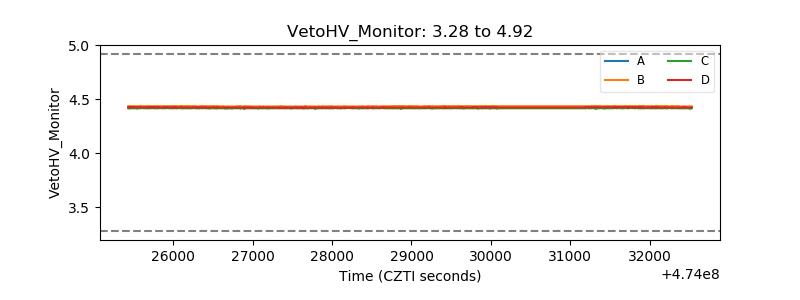 |
| Veto LLD | 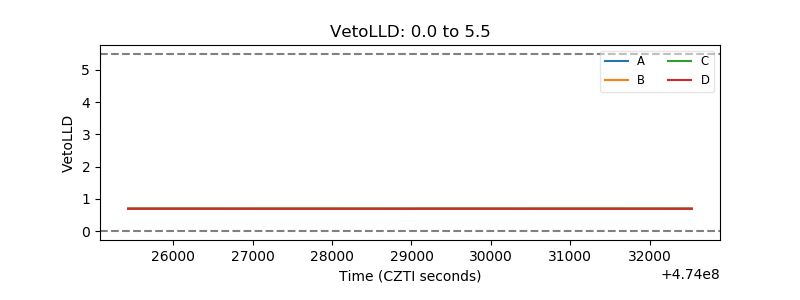 |
| Alpha Counter | 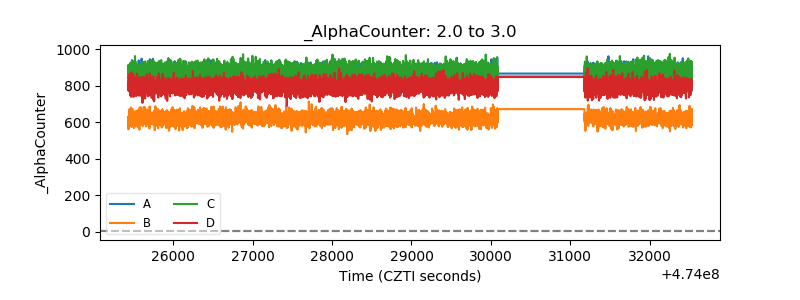 |
| _CPM_Rate | 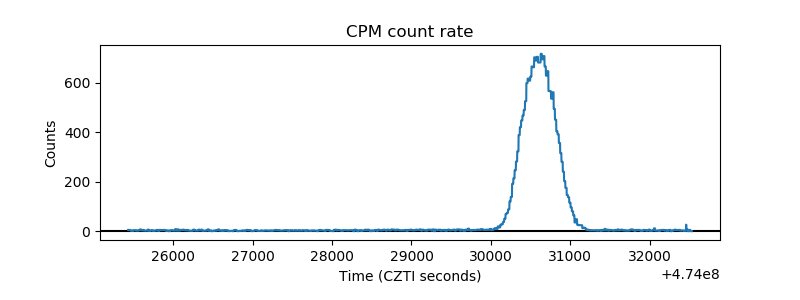 |
| CZT Counter | 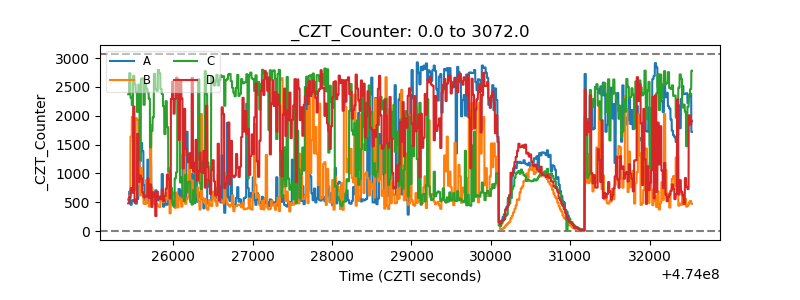 |
| +2.5 Volts monitor |  |
| +5 Volts monitor | 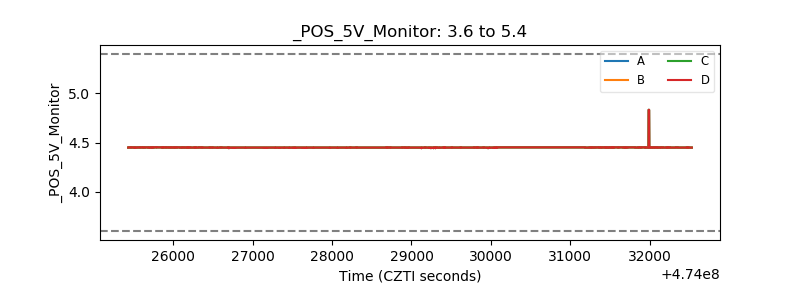 |
| _ROLL_ROT | 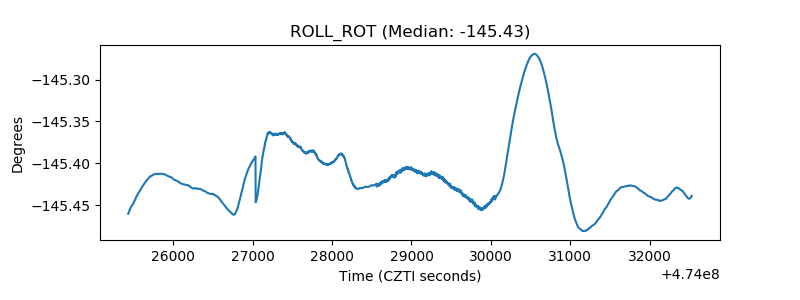 |
| _Roll_DEC | 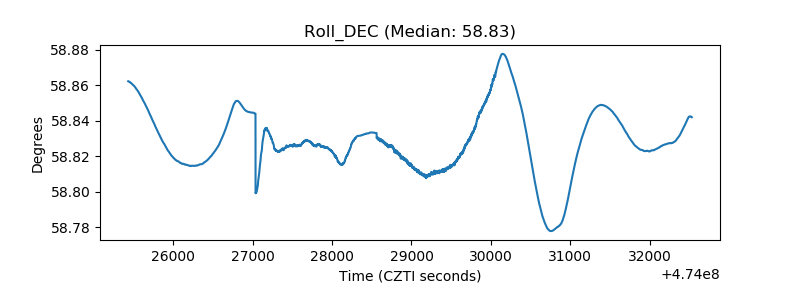 |
| _Roll_RA | 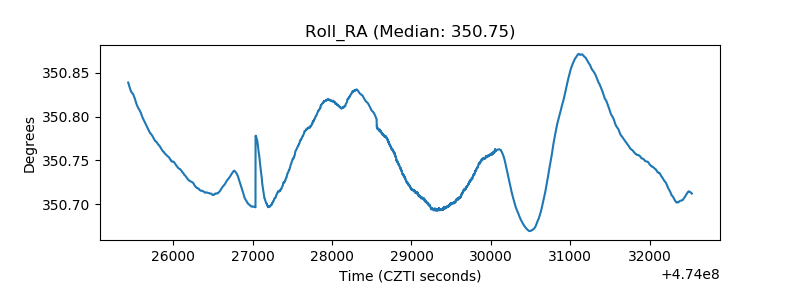 |
| Veto Counter | 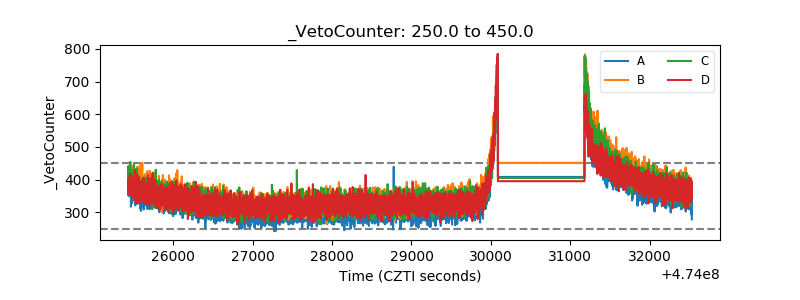 |