| Param | Original file | Final file |
|---|---|---|
| Filename | modeM0/AS1C09_003T01_9000006442_50203cztM0_level2.fits | modeM0/AS1C09_003T01_9000006442_50203cztM0_level2_quad_clean.evt |
| Size (bytes) | 964,748,160 | 70,352,640 |
| Size | 920.1 MB | 67.1 MB |
| Events in quadrant A | 6,144,686 | 578,994 |
| Events in quadrant B | 3,827,163 | 682,017 |
| Events in quadrant C | 14,054,345 | 62,152 |
| Events in quadrant D | 11,190,598 | 359,847 |
| Mode M9 | |||
|---|---|---|---|
| Quadrant | BADHDUFLAG | Total packets | Discarded packets |
| A | 0 | 11 | 0 |
| B | 0 | 11 | 0 |
| C | 0 | 11 | 0 |
| D | 0 | 11 | 0 |
| Mode M0 | |||
|---|---|---|---|
| Quadrant | BADHDUFLAG | Total packets | Discarded packets |
| A | 0 | 22717 | 1 |
| B | 0 | 15769 | 1 |
| C | 0 | 46049 | 1 |
| D | 0 | 37724 | 4 |
| Mode SS | |||
|---|---|---|---|
| Quadrant | BADHDUFLAG | Total packets | Discarded packets |
| A | 0 | 132 | 0 |
| B | 0 | 132 | 0 |
| C | 0 | 132 | 0 |
| D | 0 | 132 | 0 |
| Quadrant | Total seconds | Saturated seconds | Saturation percentage |
|---|---|---|---|
| A | 6399 | 748 | 11.689326% |
| B | 6400 | 201 | 3.140625% |
| C | 6400 | 5852 | 91.437500% |
| D | 6399 | 2721 | 42.522269% |
Noise dominated data is calculated using 1-second bins in cleaned event files. If a bin has >2000 counts, and if more than 50% of those come from <1% of pixels, then it is considered to be noise-dominated and hence unusable.
| Quadrant | # 1 sec bins | Bins with >0 counts | Bins with >2000 counts | High rate bins dominated by noise | Noise dominated (total time) | Noise dominated (detector-on time) | Marked lightcurve |
|---|---|---|---|---|---|---|---|
| A | 7534 | 6399 | 622 | 622 | 8.26% | 9.72% | 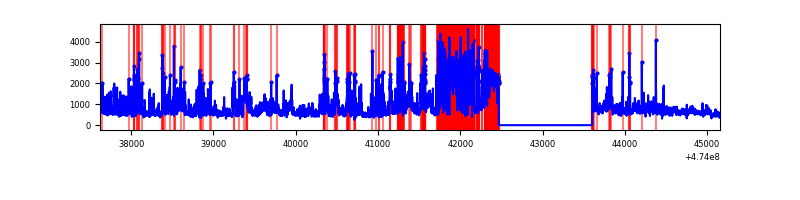 |
| B | 7535 | 6400 | 88 | 88 | 1.17% | 1.38% | 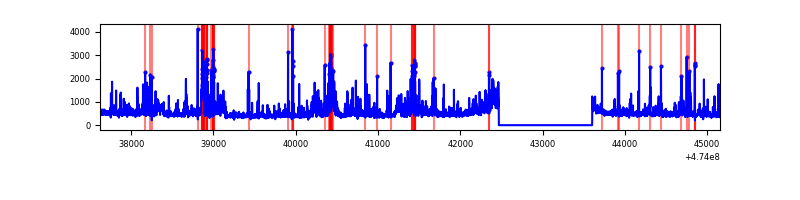 |
| C | 7534 | 6399 | 4580 | 4580 | 60.79% | 71.57% | 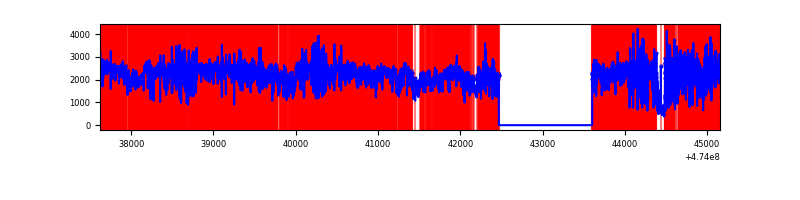 |
| D | 7534 | 6399 | 2630 | 2630 | 34.91% | 41.10% | 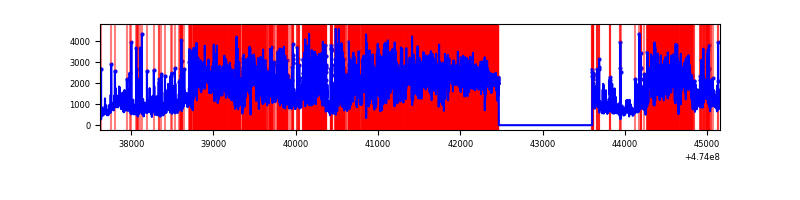 |
Top three noisy pixels from each quadrant. If the there are fewer than three noisy pixels in the level2.evt file, extra rows are filled as -1
| Pixel properties | Quadrant properties | ||||||
|---|---|---|---|---|---|---|---|
| Quadrant | DetID | PixID | Counts | Sigma | Mean | Median | Sigma |
| A | 0 | 98 | 1217713 | 7398.08 | 652 | 638 | 164.5 |
| A | 10 | 253 | 505239 | 3067.26 | 652 | 638 | 164.5 |
| A | 12 | 250 | 355928 | 2159.66 | 652 | 638 | 164.5 |
| B | 5 | 172 | 223748 | 1575.67 | 681 | 660 | 141.6 |
| B | 4 | 206 | 164518 | 1157.33 | 681 | 660 | 141.6 |
| B | 3 | 249 | 108238 | 759.82 | 681 | 660 | 141.6 |
| C | 4 | 111 | 10914344 | 172590.09 | 220 | 219 | 63.2 |
| C | 15 | 197 | 383134 | 6055.21 | 220 | 219 | 63.2 |
| C | 4 | 110 | 356833 | 5639.3 | 220 | 219 | 63.2 |
| D | 7 | 61 | 2425053 | 15745.51 | 548 | 528 | 154.0 |
| D | 15 | 108 | 1487555 | 9657.15 | 548 | 528 | 154.0 |
| D | 15 | 185 | 840223 | 5453.2 | 548 | 528 | 154.0 |
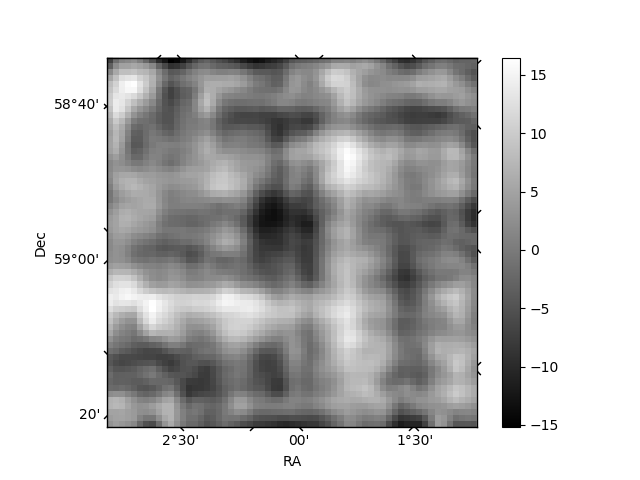
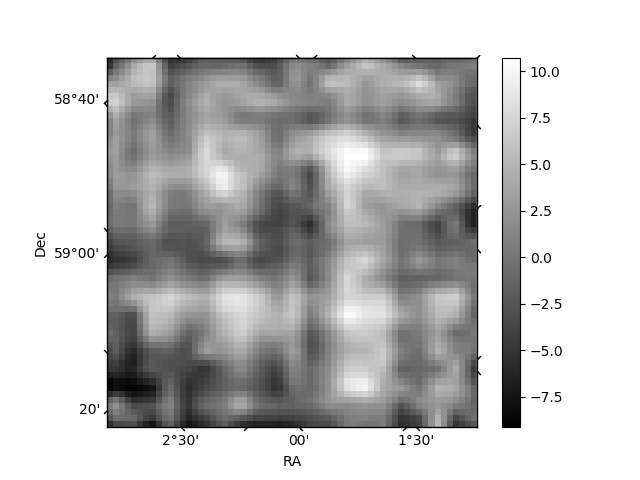
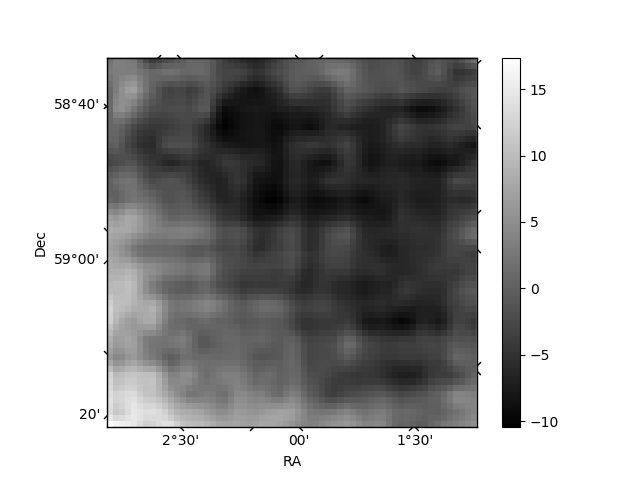
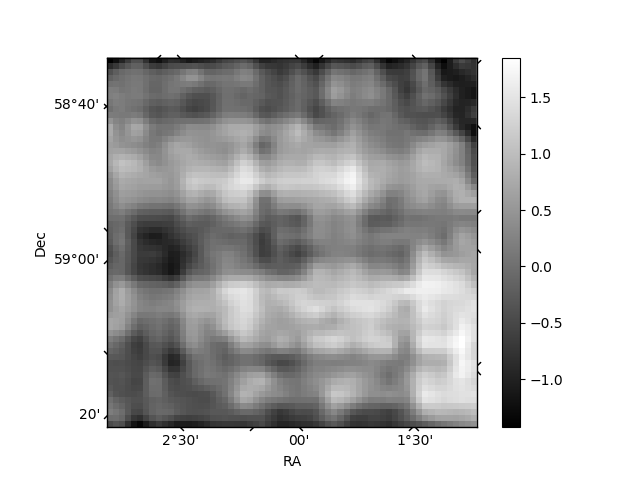
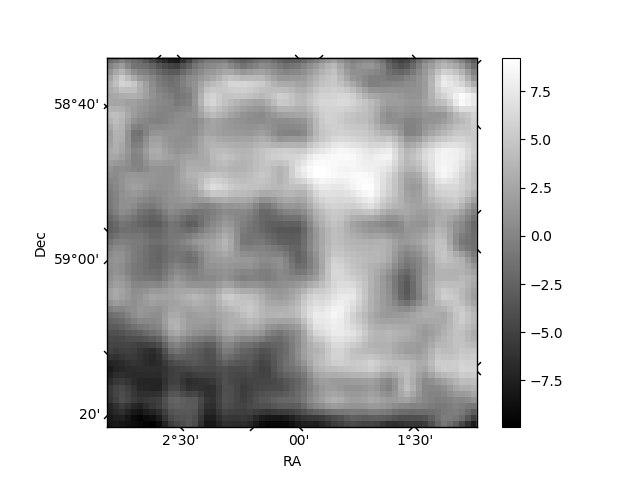
Histogram calculated using DETX and DETY for each event in the final _common_clean file
| Quadrant A | 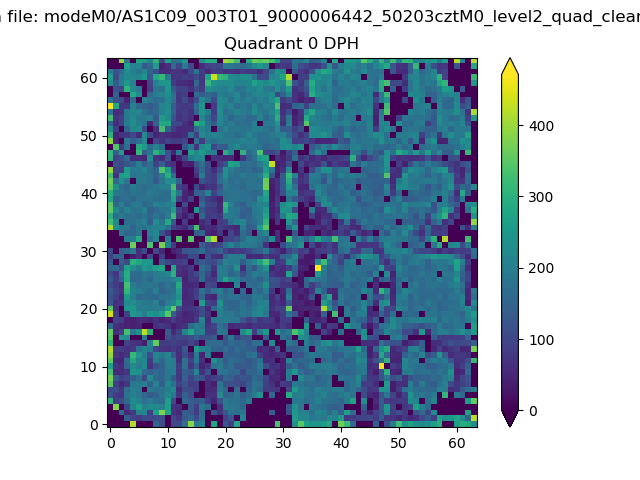 |
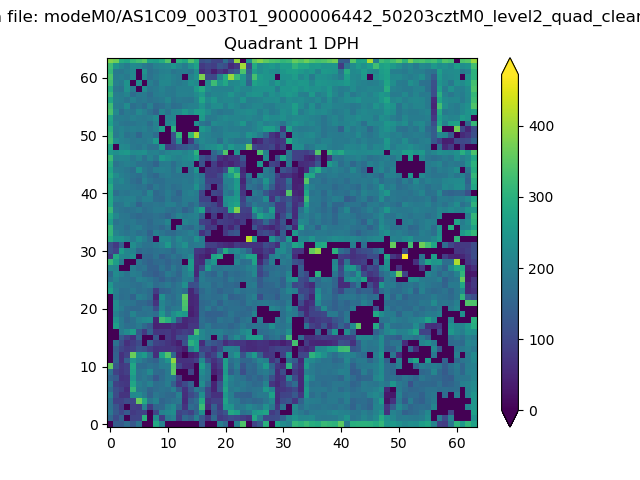 |
Quadrant B |
|---|---|---|---|
| Quadrant D | 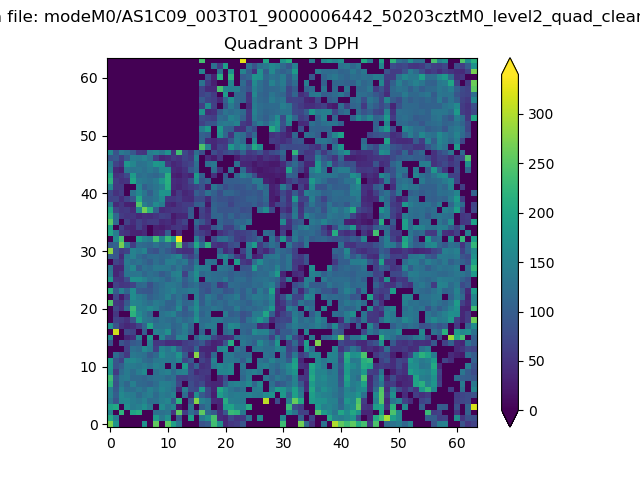 |
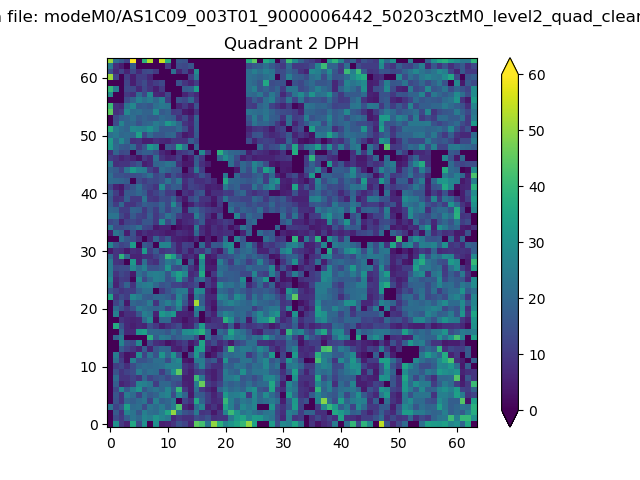 |
Quadrant C |
| Plot type | Count rate plots | Images |
|---|---|---|
| Comparison with Poisson distribution Blue bars denote a histogram of data divided into 1 sec bins. Red curve is a Poisson curve with rate = median count rate of data. |
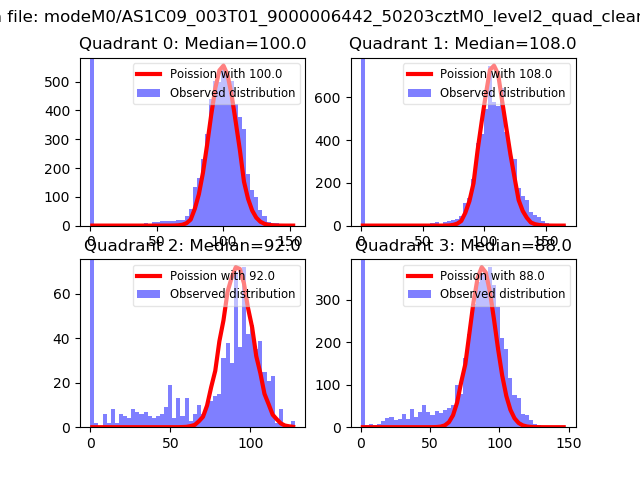 |
 |
| Quadrant-wise count rates Data is divided into 100 sec bins |
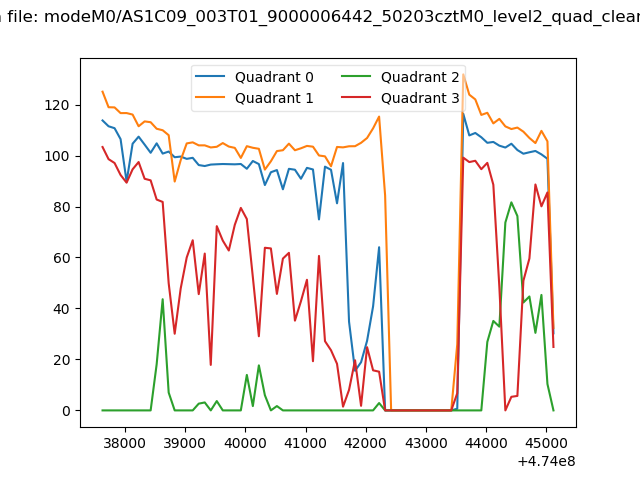 |
|
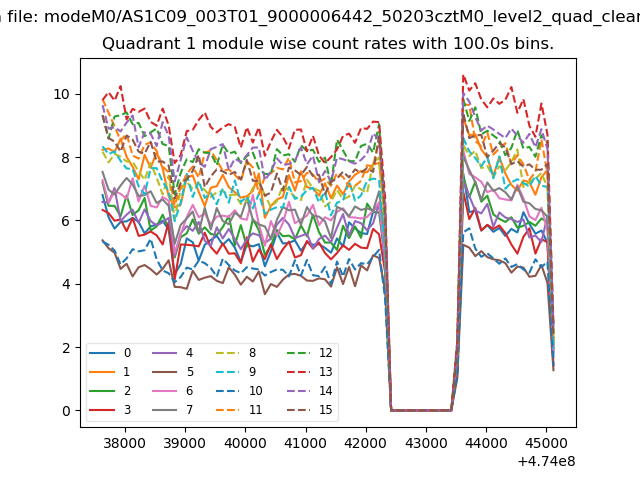
| Module-wise count rates for Quadrant A Data is divided into 100 sec bins |
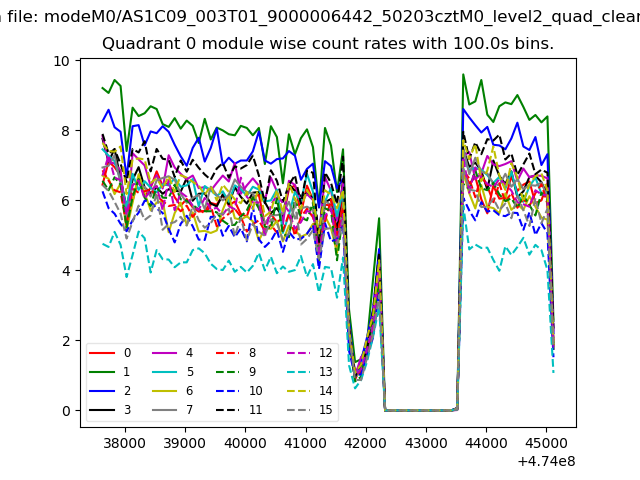 |
 |
| Module-wise count rates for Quadrant B Data is divided into 100 sec bins |
 |
 |
| Module-wise count rates for Quadrant C Data is divided into 100 sec bins |
 |
 |
| Module-wise count rates for Quadrant D Data is divided into 100 sec bins |
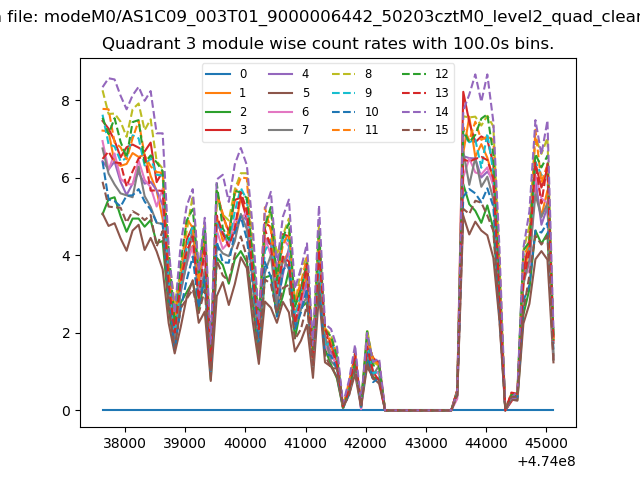 |
 |
| Parameter | Plot |
|---|---|
| CZT HV Monitor | 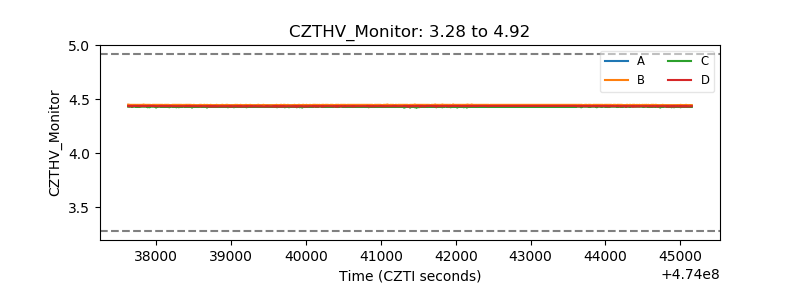 |
| D_VDD | 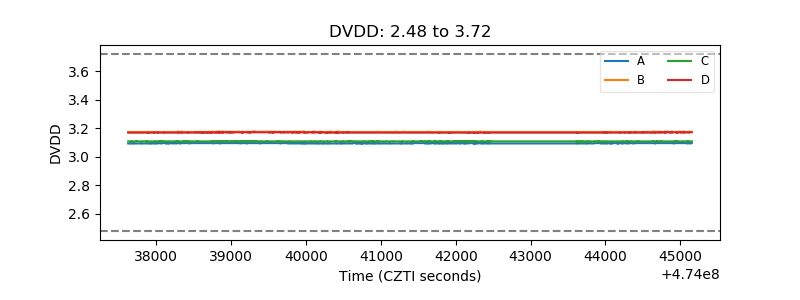 |
| Temperature 1 | 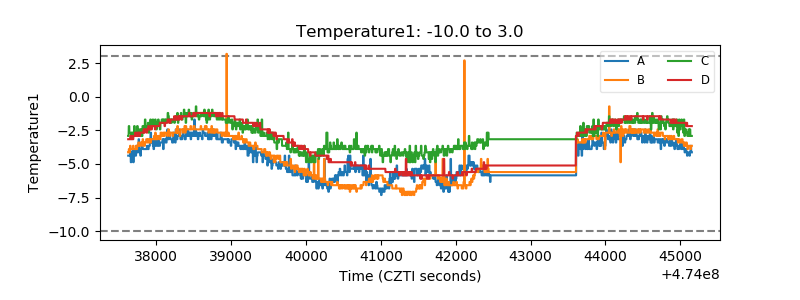 |
| Veto HV Monitor | 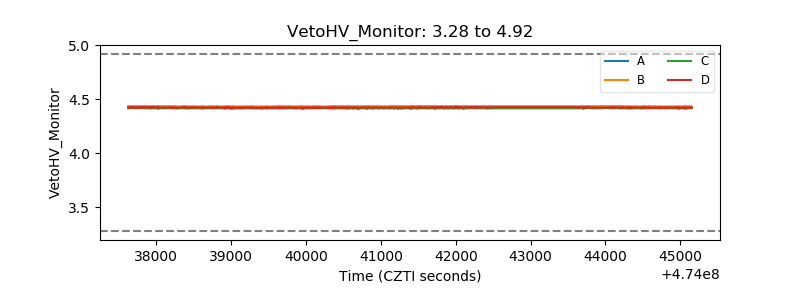 |
| Veto LLD | 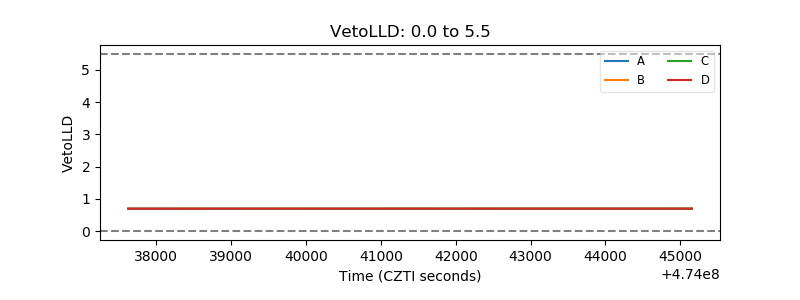 |
| Alpha Counter | 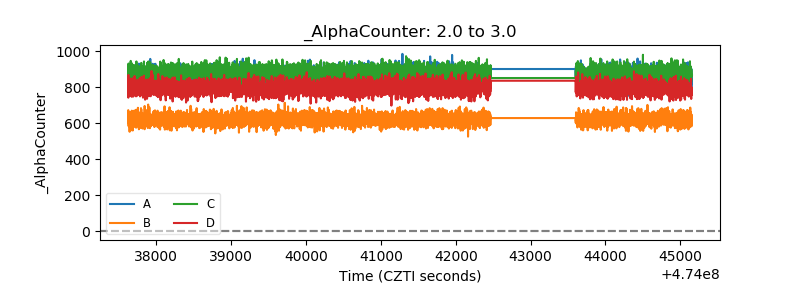 |
| _CPM_Rate | 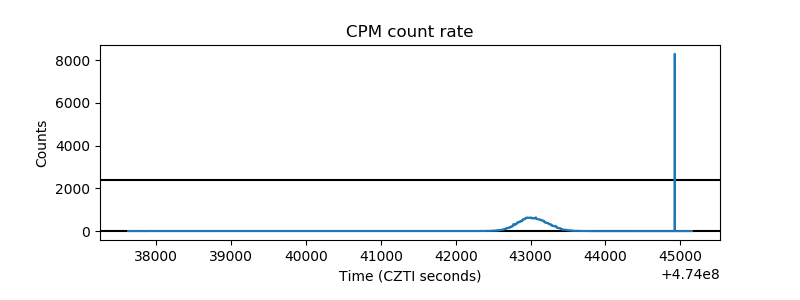 |
| CZT Counter | 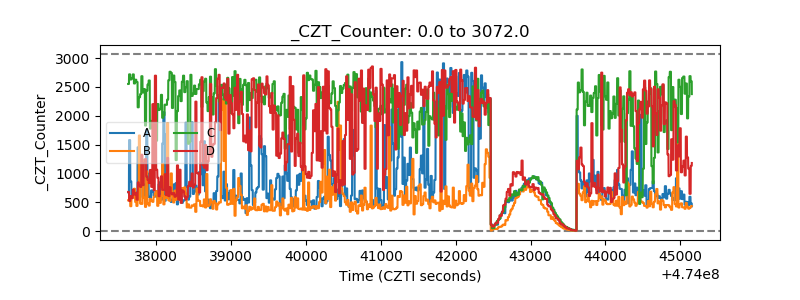 |
| +2.5 Volts monitor |  |
| +5 Volts monitor | 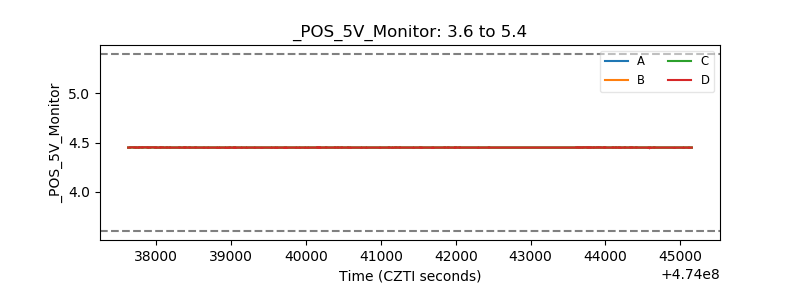 |
| _ROLL_ROT | 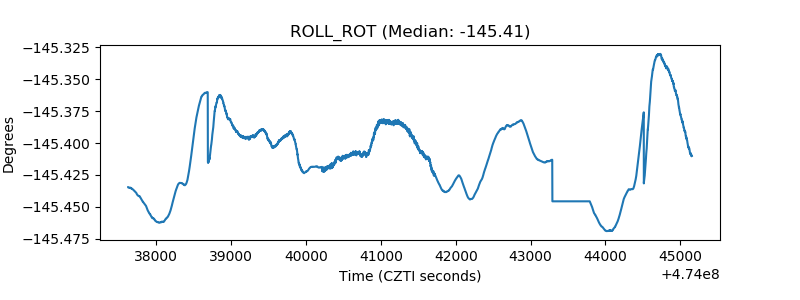 |
| _Roll_DEC | 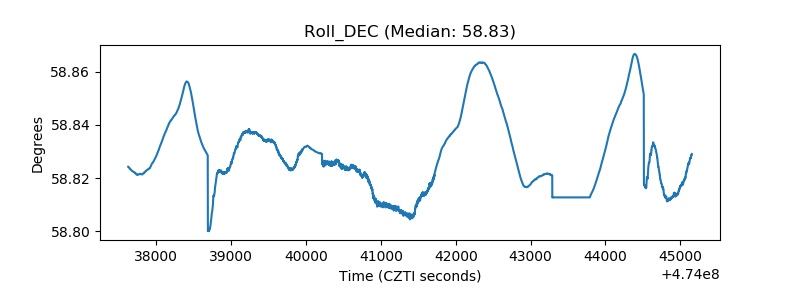 |
| _Roll_RA | 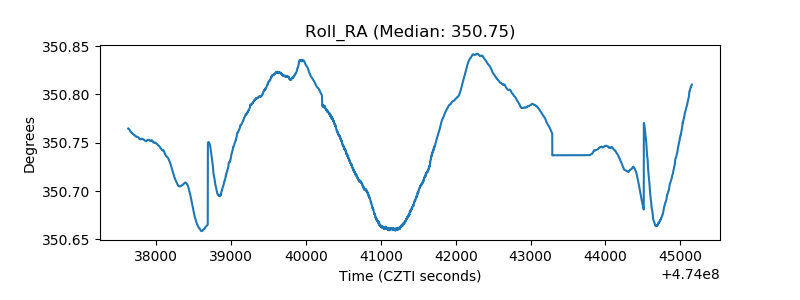 |
| Veto Counter | 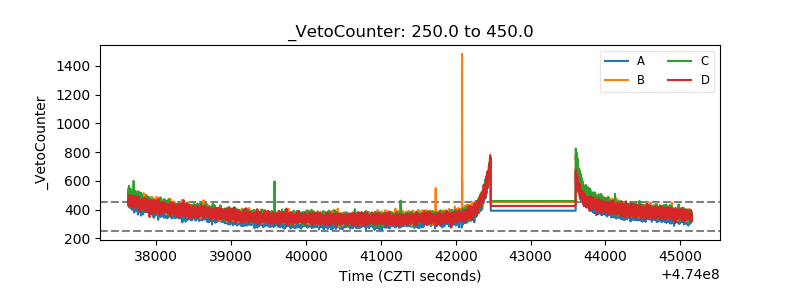 |