| Param | Original file | Final file |
|---|---|---|
| Filename | modeM0/AS1C09_003T01_9000006442_50204cztM0_level2.fits | modeM0/AS1C09_003T01_9000006442_50204cztM0_level2_quad_clean.evt |
| Size (bytes) | 979,790,400 | 70,568,640 |
| Size | 934.4 MB | 67.3 MB |
| Events in quadrant A | 7,000,367 | 524,158 |
| Events in quadrant B | 3,870,847 | 683,201 |
| Events in quadrant C | 14,058,861 | 88,041 |
| Events in quadrant D | 10,832,501 | 384,414 |
| Mode M9 | |||
|---|---|---|---|
| Quadrant | BADHDUFLAG | Total packets | Discarded packets |
| A | 0 | 10 | 0 |
| B | 0 | 10 | 0 |
| C | 0 | 10 | 0 |
| D | 0 | 10 | 0 |
| Mode M0 | |||
|---|---|---|---|
| Quadrant | BADHDUFLAG | Total packets | Discarded packets |
| A | 0 | 25301 | 1 |
| B | 0 | 15952 | 1 |
| C | 0 | 46207 | 4 |
| D | 0 | 36722 | 1 |
| Mode SS | |||
|---|---|---|---|
| Quadrant | BADHDUFLAG | Total packets | Discarded packets |
| A | 0 | 134 | 0 |
| B | 0 | 134 | 0 |
| C | 0 | 134 | 0 |
| D | 0 | 134 | 0 |
| Quadrant | Total seconds | Saturated seconds | Saturation percentage |
|---|---|---|---|
| A | 6545 | 1287 | 19.663866% |
| B | 6545 | 183 | 2.796028% |
| C | 6544 | 5748 | 87.836186% |
| D | 6544 | 2448 | 37.408313% |
Noise dominated data is calculated using 1-second bins in cleaned event files. If a bin has >2000 counts, and if more than 50% of those come from <1% of pixels, then it is considered to be noise-dominated and hence unusable.
| Quadrant | # 1 sec bins | Bins with >0 counts | Bins with >2000 counts | High rate bins dominated by noise | Noise dominated (total time) | Noise dominated (detector-on time) | Marked lightcurve |
|---|---|---|---|---|---|---|---|
| A | 7625 | 6545 | 1139 | 1139 | 14.94% | 17.40% | 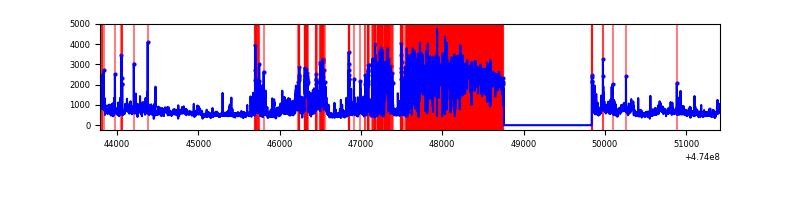 |
| B | 7625 | 6546 | 80 | 80 | 1.05% | 1.22% | 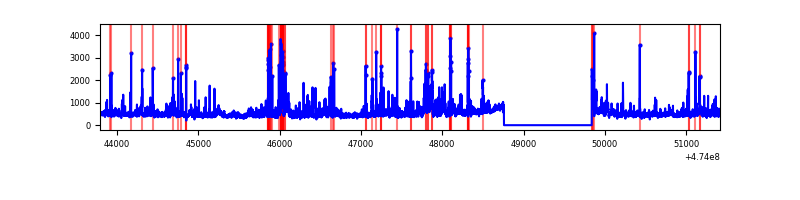 |
| C | 7624 | 6544 | 4328 | 4328 | 56.77% | 66.14% | 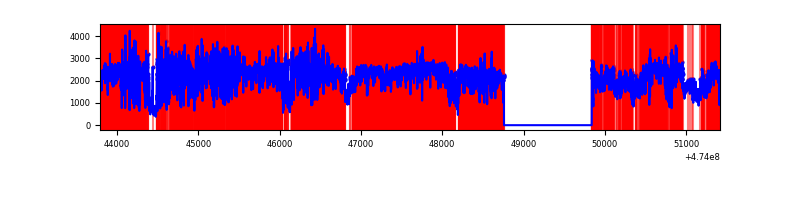 |
| D | 7623 | 6543 | 2268 | 2268 | 29.75% | 34.66% | 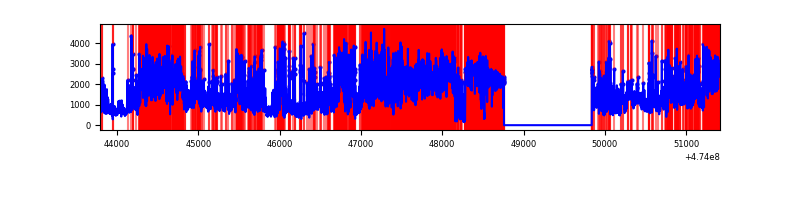 |
Top three noisy pixels from each quadrant. If the there are fewer than three noisy pixels in the level2.evt file, extra rows are filled as -1
| Pixel properties | Quadrant properties | ||||||
|---|---|---|---|---|---|---|---|
| Quadrant | DetID | PixID | Counts | Sigma | Mean | Median | Sigma |
| A | 0 | 98 | 2389972 | 15142.44 | 628 | 611 | 157.8 |
| A | 12 | 250 | 398417 | 2521.07 | 628 | 611 | 157.8 |
| A | 10 | 253 | 392372 | 2482.76 | 628 | 611 | 157.8 |
| B | 4 | 206 | 501813 | 3431.77 | 690 | 669 | 146.0 |
| B | 5 | 185 | 125680 | 856.06 | 690 | 669 | 146.0 |
| B | 3 | 249 | 72688 | 493.18 | 690 | 669 | 146.0 |
| C | 4 | 111 | 10395957 | 149689.18 | 237 | 234 | 69.4 |
| C | 15 | 197 | 1509391 | 21730.52 | 237 | 234 | 69.4 |
| C | 15 | 199 | 487025 | 7009.36 | 237 | 234 | 69.4 |
| D | 7 | 61 | 1996152 | 12814.19 | 551 | 532 | 155.7 |
| D | 15 | 108 | 1505241 | 9661.97 | 551 | 532 | 155.7 |
| D | 8 | 245 | 767186 | 4922.81 | 551 | 532 | 155.7 |
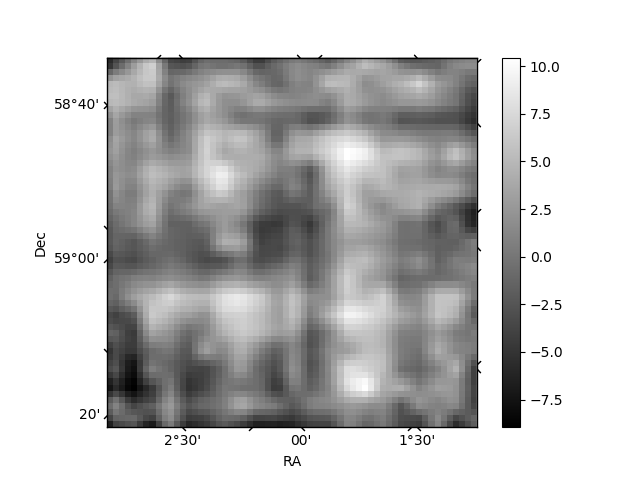
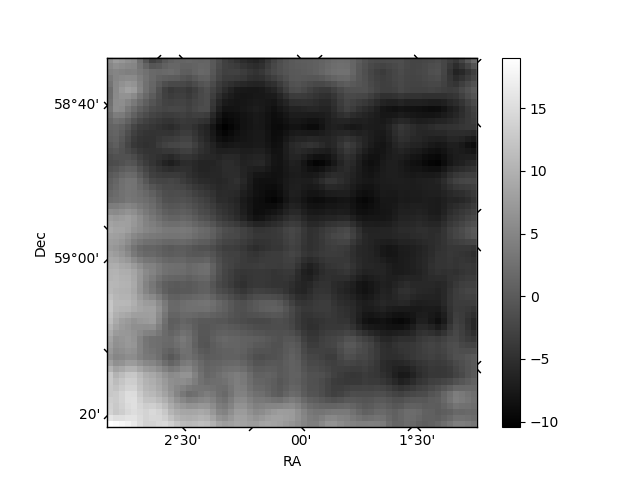
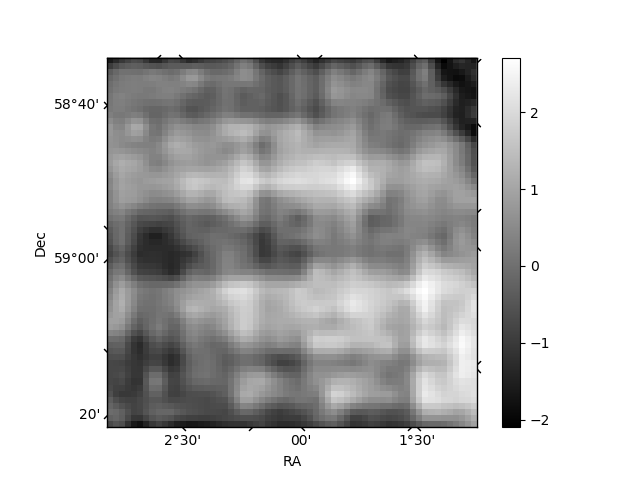
Histogram calculated using DETX and DETY for each event in the final _common_clean file
| Quadrant A | 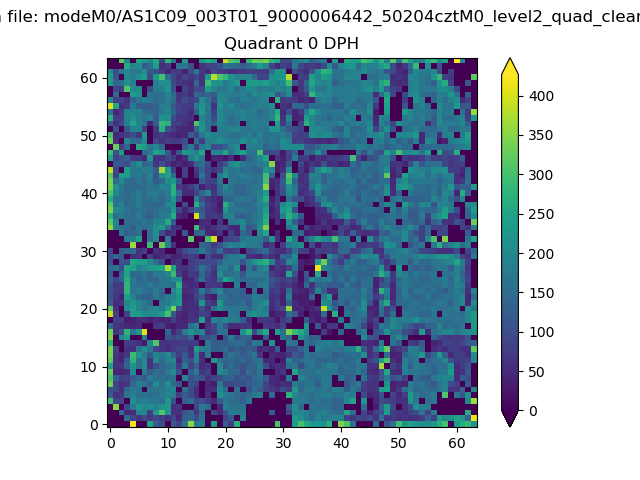 |
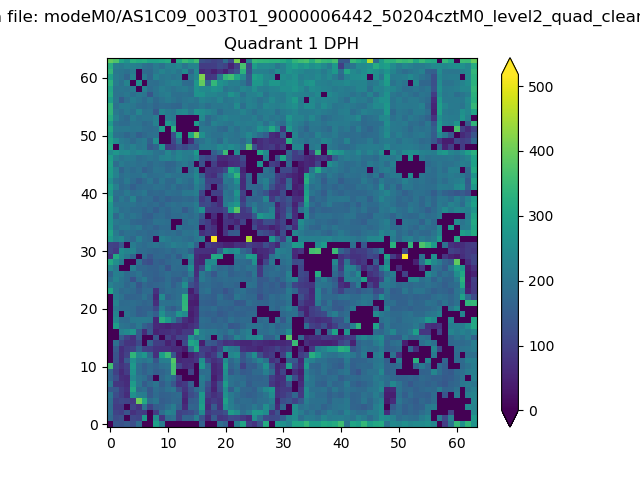 |
Quadrant B |
|---|---|---|---|
| Quadrant D | 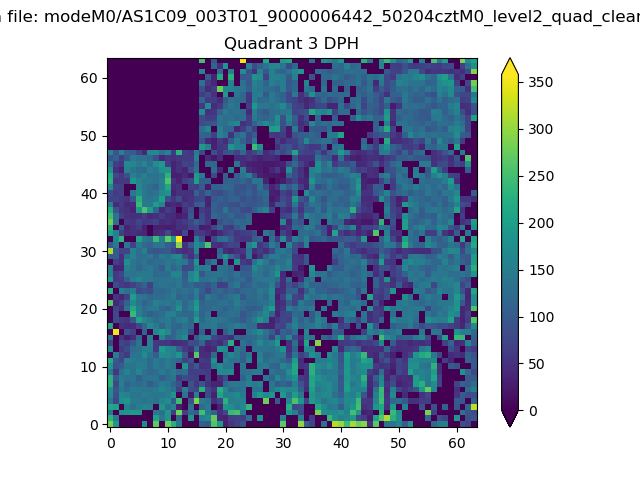 |
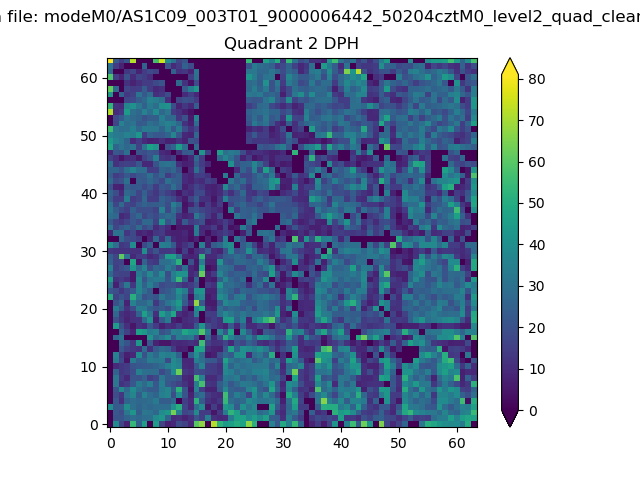 |
Quadrant C |
| Plot type | Count rate plots | Images |
|---|---|---|
| Comparison with Poisson distribution Blue bars denote a histogram of data divided into 1 sec bins. Red curve is a Poisson curve with rate = median count rate of data. |
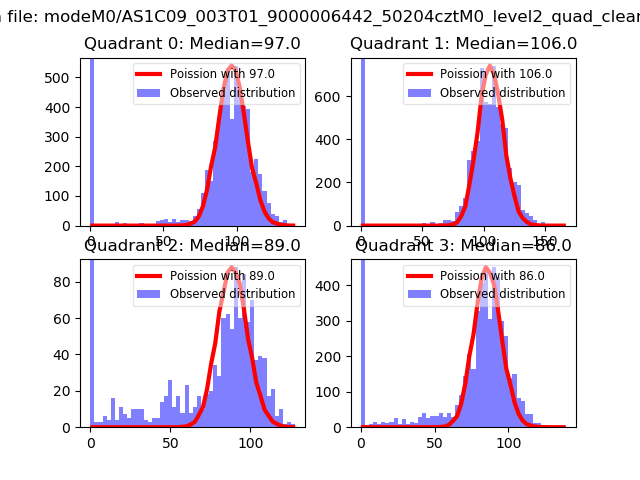 |
 |
| Quadrant-wise count rates Data is divided into 100 sec bins |
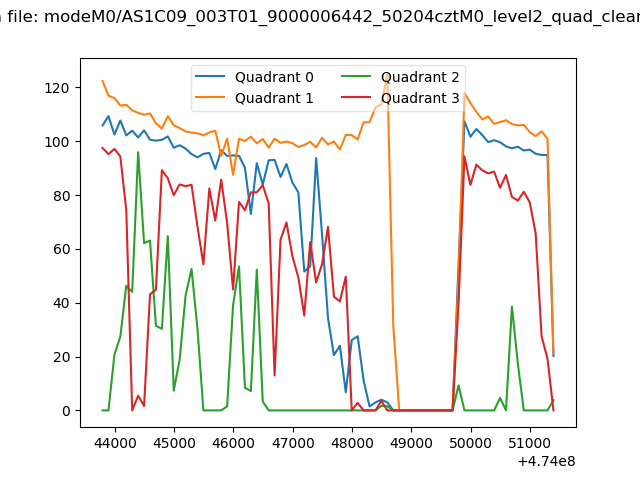 |
|
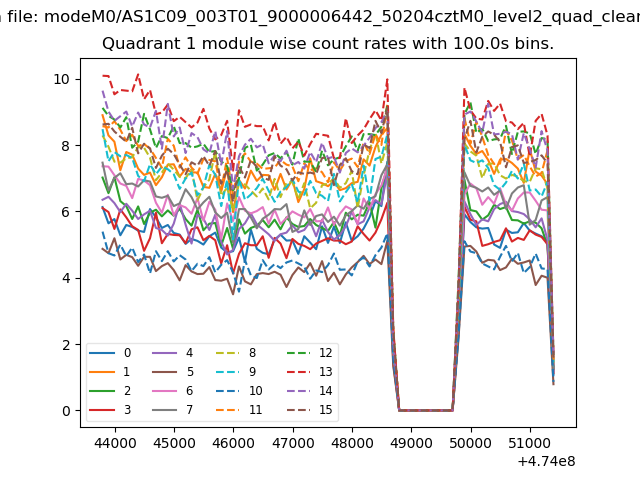
| Module-wise count rates for Quadrant A Data is divided into 100 sec bins |
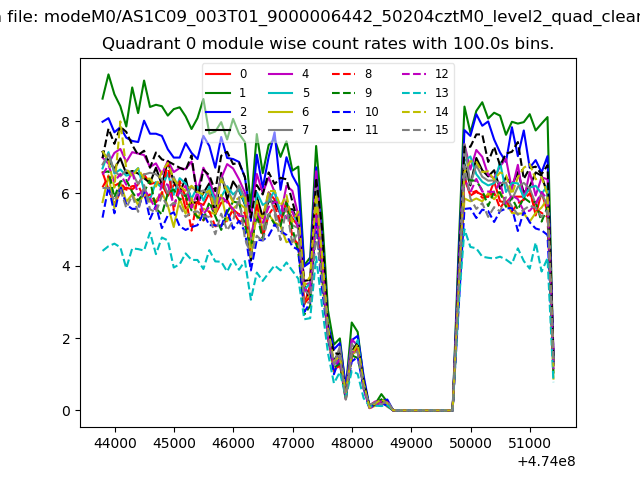 |
 |
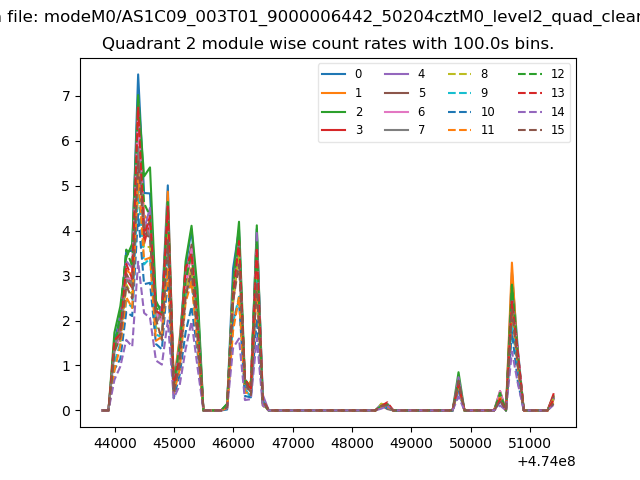
| Module-wise count rates for Quadrant B Data is divided into 100 sec bins |
 |
 |
| Module-wise count rates for Quadrant C Data is divided into 100 sec bins |
 |
 |
| Module-wise count rates for Quadrant D Data is divided into 100 sec bins |
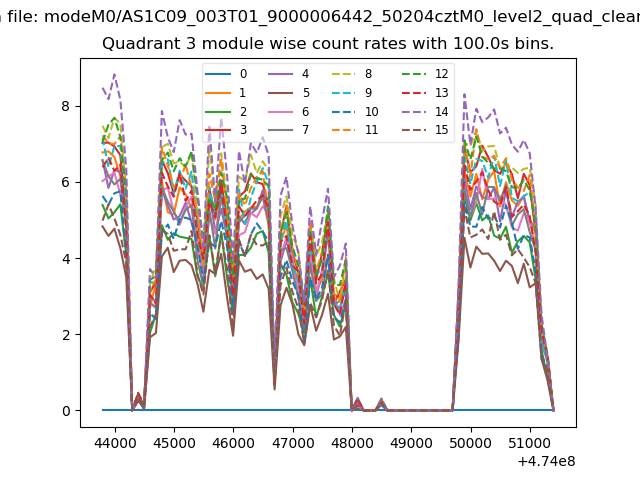 |
 |
| Parameter | Plot |
|---|---|
| CZT HV Monitor | 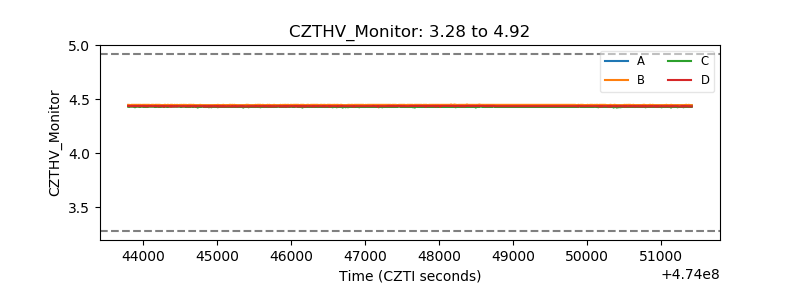 |
| D_VDD | 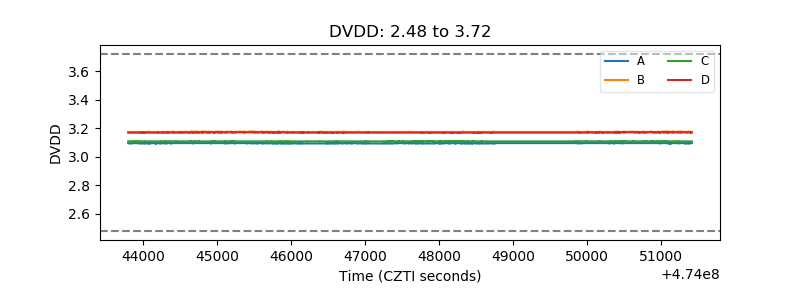 |
| Temperature 1 | 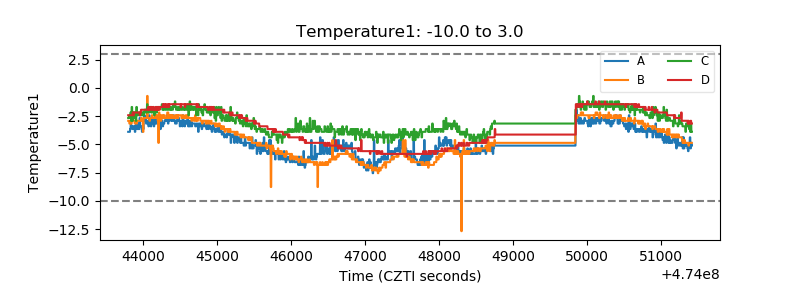 |
| Veto HV Monitor | 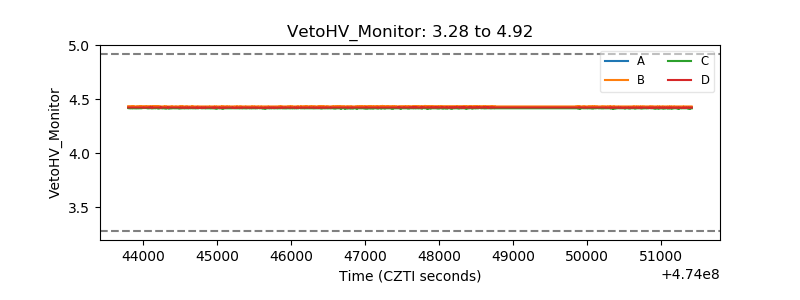 |
| Veto LLD | 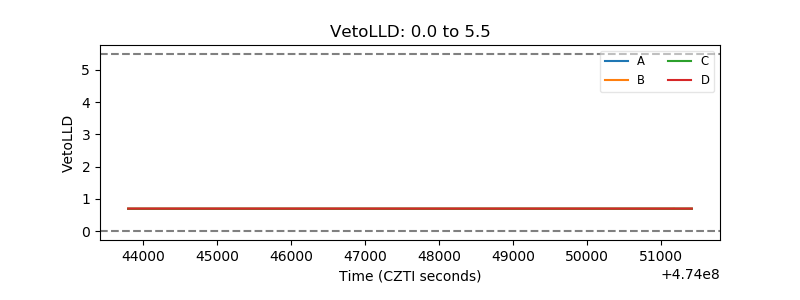 |
| Alpha Counter | 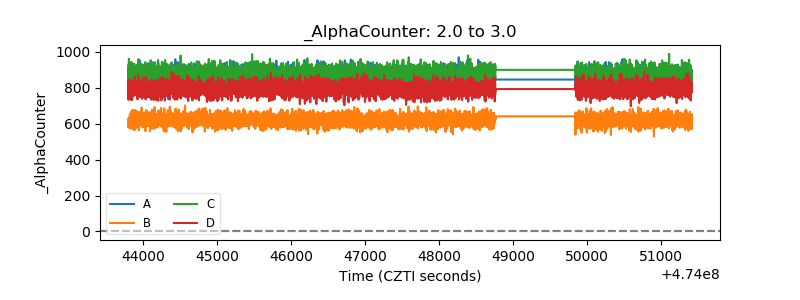 |
| _CPM_Rate | 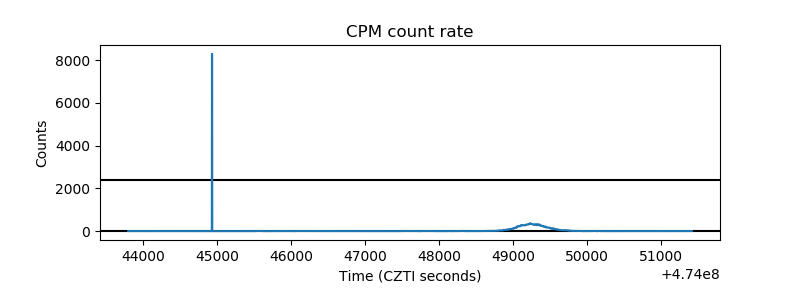 |
| CZT Counter | 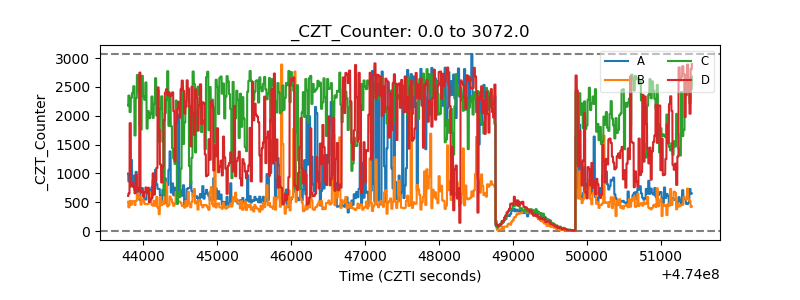 |
| +2.5 Volts monitor |  |
| +5 Volts monitor | 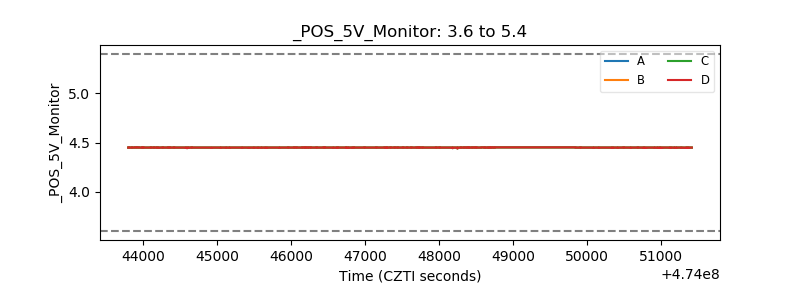 |
| _ROLL_ROT | 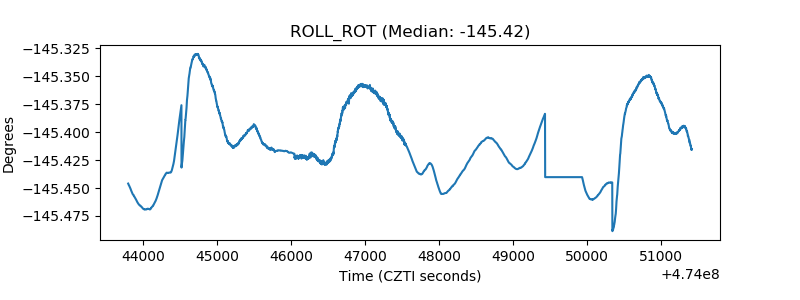 |
| _Roll_DEC | 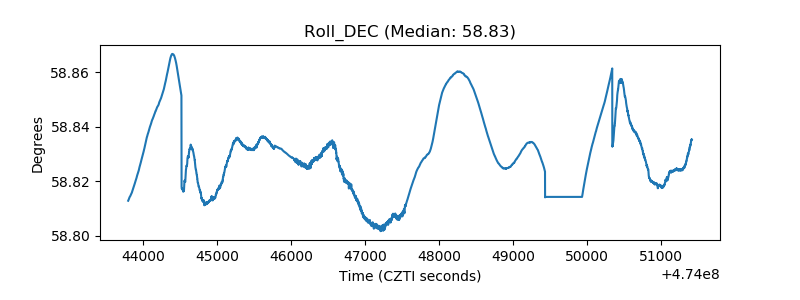 |
| _Roll_RA | 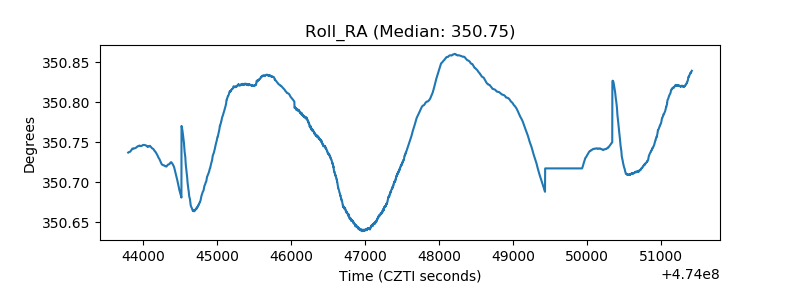 |
| Veto Counter | 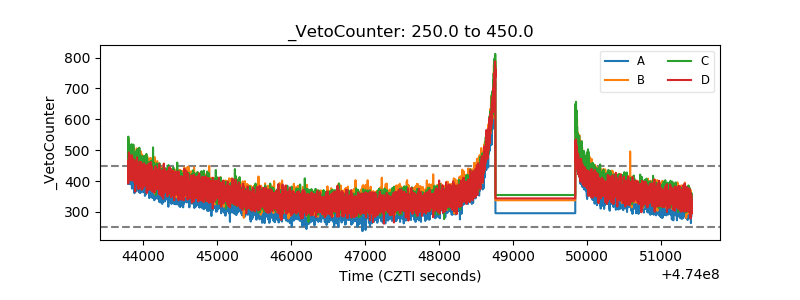 |