| Param | Original file | Final file |
|---|---|---|
| Filename | modeM0/AS1C09_003T01_9000006442_50205cztM0_level2.fits | modeM0/AS1C09_003T01_9000006442_50205cztM0_level2_quad_clean.evt |
| Size (bytes) | 1,106,334,720 | 66,666,240 |
| Size | 1.0 GB | 63.6 MB |
| Events in quadrant A | 7,959,171 | 497,619 |
| Events in quadrant B | 5,317,139 | 649,163 |
| Events in quadrant C | 13,751,920 | 131,798 |
| Events in quadrant D | 13,407,361 | 272,497 |
| Mode M9 | |||
|---|---|---|---|
| Quadrant | BADHDUFLAG | Total packets | Discarded packets |
| A | 0 | 9 | 0 |
| B | 0 | 9 | 0 |
| C | 0 | 9 | 0 |
| D | 0 | 9 | 0 |
| Mode M0 | |||
|---|---|---|---|
| Quadrant | BADHDUFLAG | Total packets | Discarded packets |
| A | 0 | 28308 | 1 |
| B | 0 | 20438 | 1 |
| C | 0 | 45412 | 1 |
| D | 0 | 44457 | 9 |
| Mode SS | |||
|---|---|---|---|
| Quadrant | BADHDUFLAG | Total packets | Discarded packets |
| A | 0 | 136 | 0 |
| B | 0 | 136 | 0 |
| C | 0 | 136 | 0 |
| D | 0 | 136 | 0 |
| Quadrant | Total seconds | Saturated seconds | Saturation percentage |
|---|---|---|---|
| A | 6701 | 1643 | 24.518729% |
| B | 6702 | 541 | 8.072217% |
| C | 6702 | 5402 | 80.602805% |
| D | 6701 | 3851 | 57.469034% |
Noise dominated data is calculated using 1-second bins in cleaned event files. If a bin has >2000 counts, and if more than 50% of those come from <1% of pixels, then it is considered to be noise-dominated and hence unusable.
| Quadrant | # 1 sec bins | Bins with >0 counts | Bins with >2000 counts | High rate bins dominated by noise | Noise dominated (total time) | Noise dominated (detector-on time) | Marked lightcurve |
|---|---|---|---|---|---|---|---|
| A | 7561 | 6701 | 1385 | 1385 | 18.32% | 20.67% | 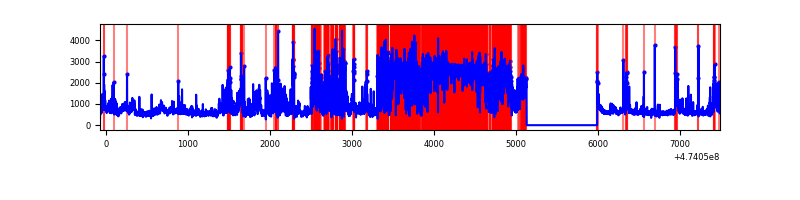 |
| B | 7562 | 6703 | 410 | 410 | 5.42% | 6.12% | 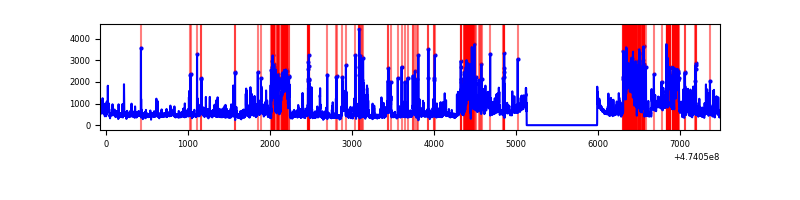 |
| C | 7561 | 6701 | 4023 | 4023 | 53.21% | 60.04% | 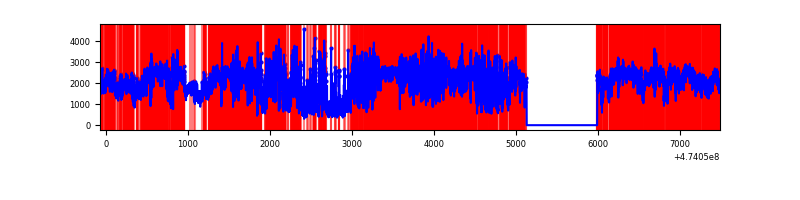 |
| D | 7560 | 6700 | 3627 | 3627 | 47.98% | 54.13% | 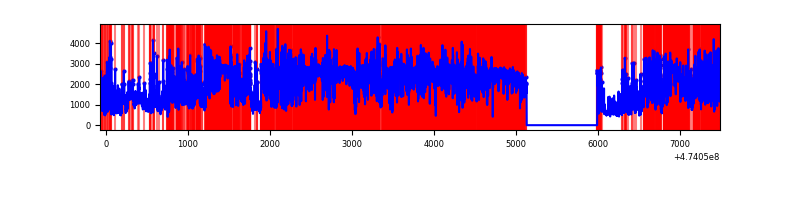 |
Top three noisy pixels from each quadrant. If the there are fewer than three noisy pixels in the level2.evt file, extra rows are filled as -1
| Pixel properties | Quadrant properties | ||||||
|---|---|---|---|---|---|---|---|
| Quadrant | DetID | PixID | Counts | Sigma | Mean | Median | Sigma |
| A | 0 | 98 | 3033137 | 19007.54 | 628 | 611 | 159.5 |
| A | 12 | 250 | 684993 | 4289.63 | 628 | 611 | 159.5 |
| A | 10 | 253 | 321423 | 2010.81 | 628 | 611 | 159.5 |
| B | 4 | 206 | 1678887 | 11618.23 | 686 | 664 | 144.4 |
| B | 10 | 28 | 294836 | 2036.53 | 686 | 664 | 144.4 |
| B | 4 | 170 | 99513 | 684.33 | 686 | 664 | 144.4 |
| C | 4 | 111 | 9802861 | 120564.57 | 288 | 288 | 81.3 |
| C | 15 | 197 | 1309233 | 16099.08 | 288 | 288 | 81.3 |
| C | 15 | 199 | 507576 | 6239.28 | 288 | 288 | 81.3 |
| D | 7 | 61 | 6080205 | 45294.95 | 468 | 452 | 134.2 |
| D | 15 | 108 | 1222298 | 9102.91 | 468 | 452 | 134.2 |
| D | 15 | 106 | 684160 | 5093.71 | 468 | 452 | 134.2 |
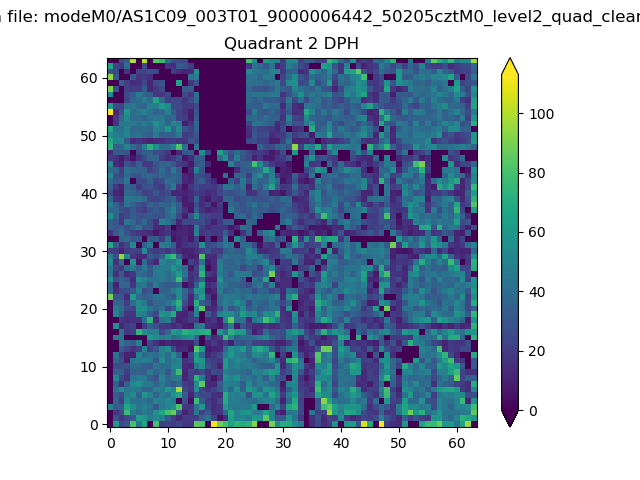
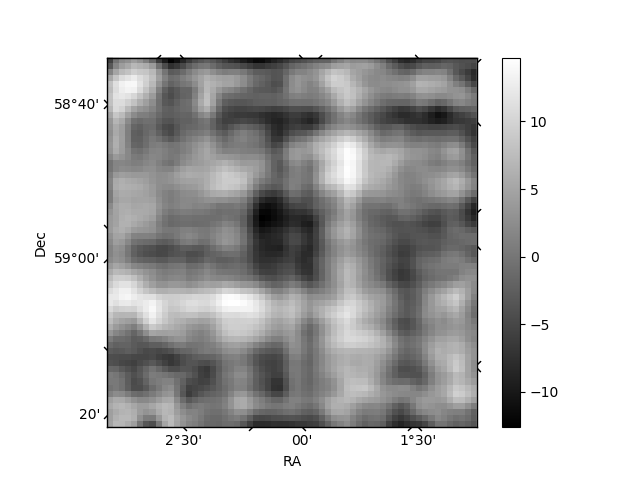
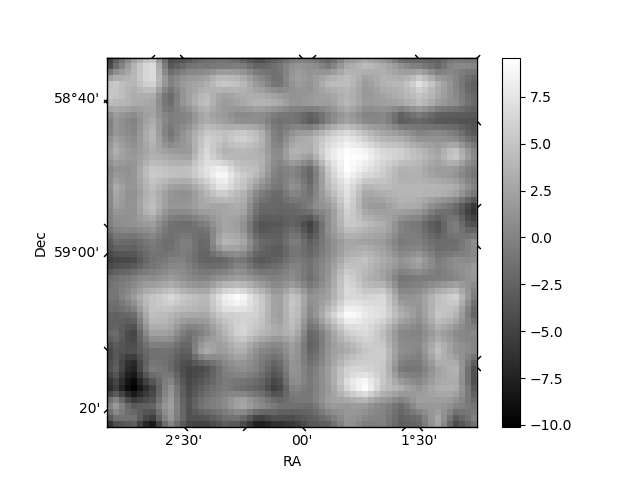
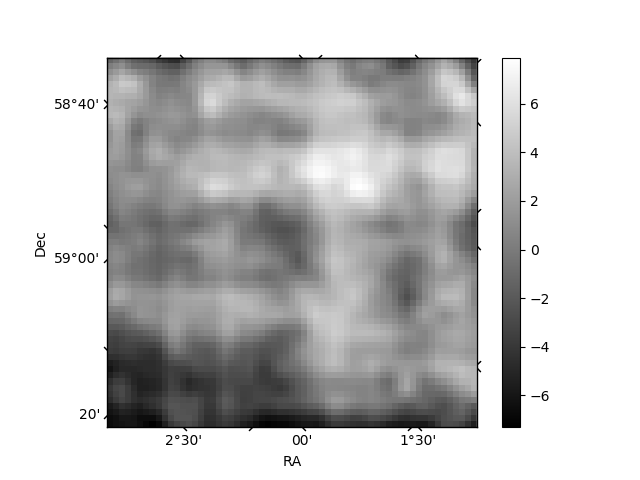
Histogram calculated using DETX and DETY for each event in the final _common_clean file
| Quadrant A | 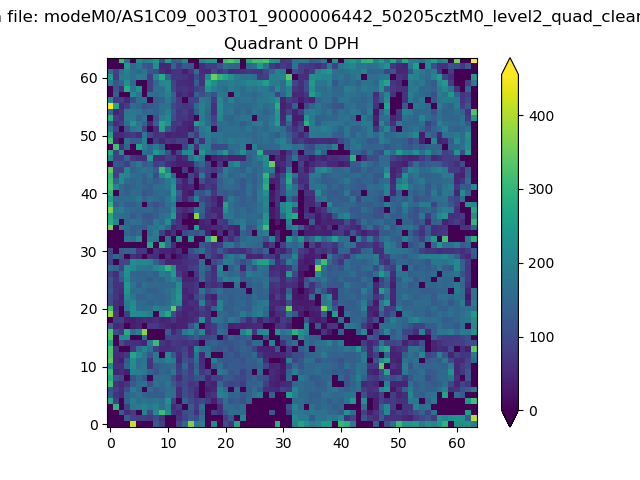 |
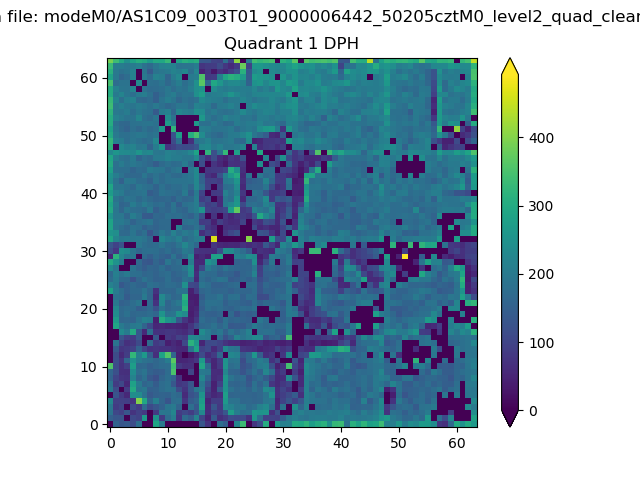 |
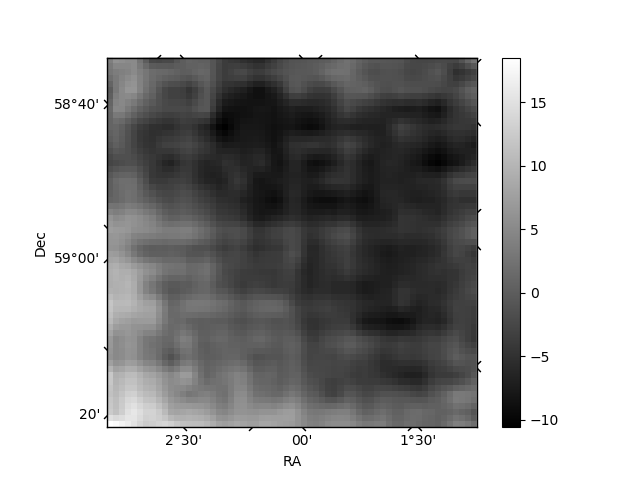
Quadrant B |
|---|---|---|---|
| Quadrant D | 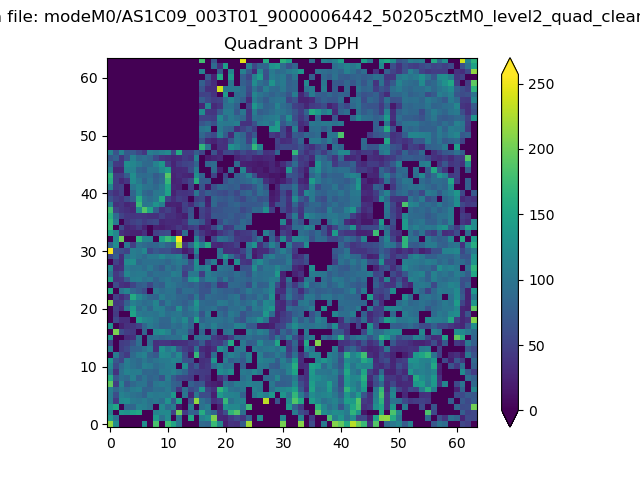 |
 |
Quadrant C |
| Plot type | Count rate plots | Images |
|---|---|---|
| Comparison with Poisson distribution Blue bars denote a histogram of data divided into 1 sec bins. Red curve is a Poisson curve with rate = median count rate of data. |
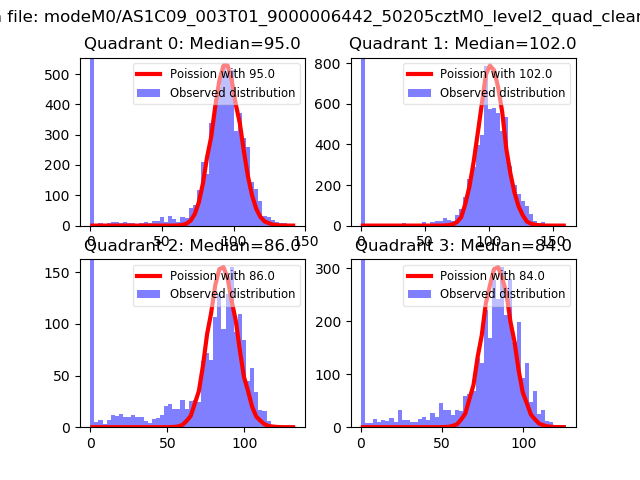 |
 |
| Quadrant-wise count rates Data is divided into 100 sec bins |
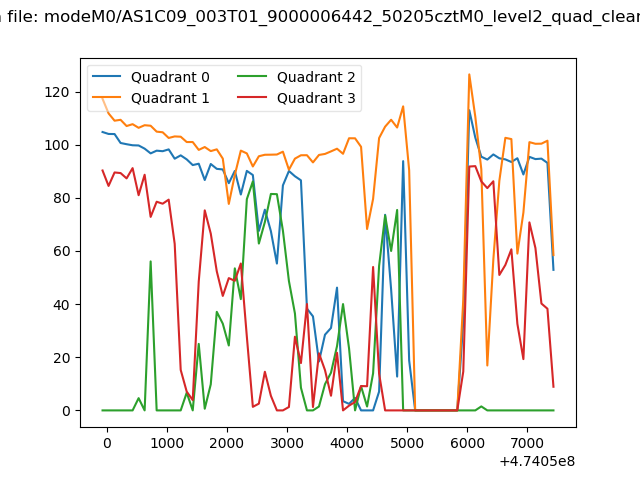 |
|
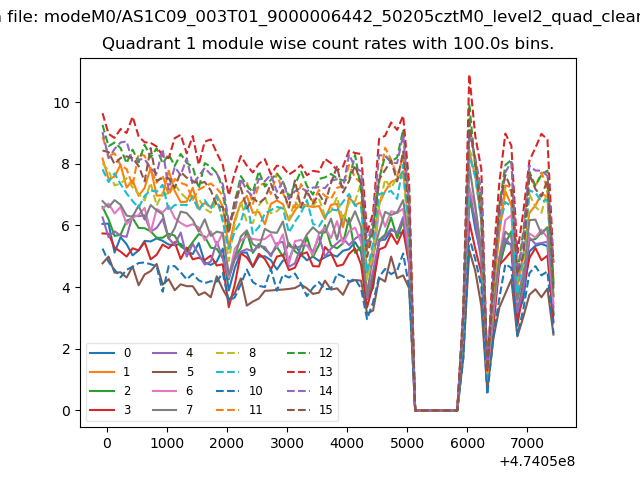
| Module-wise count rates for Quadrant A Data is divided into 100 sec bins |
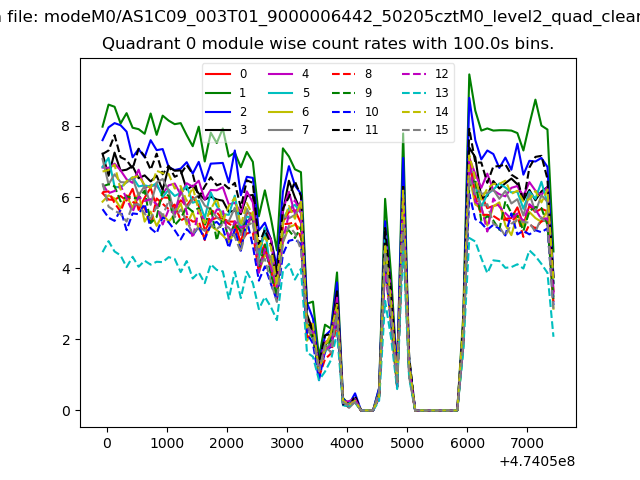 |
 |
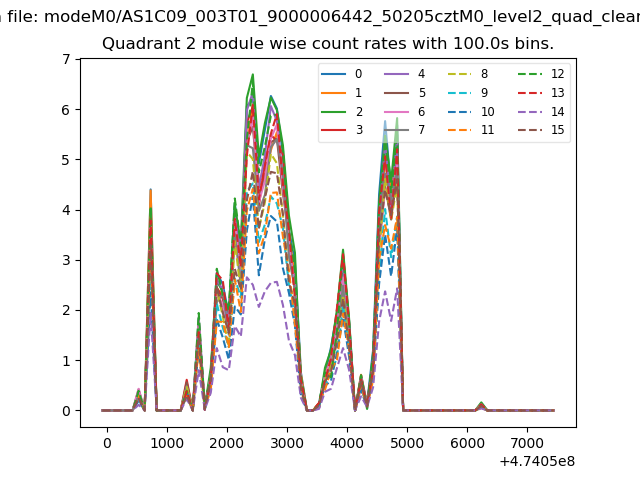
| Module-wise count rates for Quadrant B Data is divided into 100 sec bins |
 |
 |
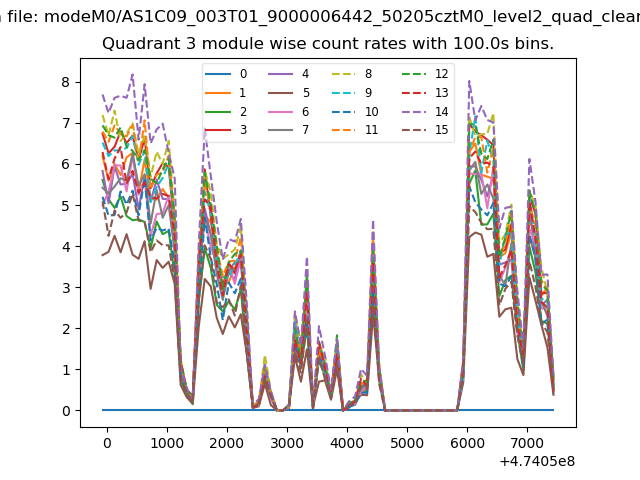
| Module-wise count rates for Quadrant C Data is divided into 100 sec bins |
 |
 |
| Module-wise count rates for Quadrant D Data is divided into 100 sec bins |
 |
 |
| Parameter | Plot |
|---|---|
| CZT HV Monitor | 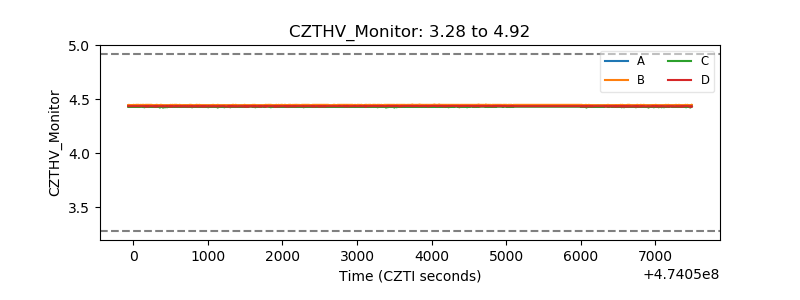 |
| D_VDD | 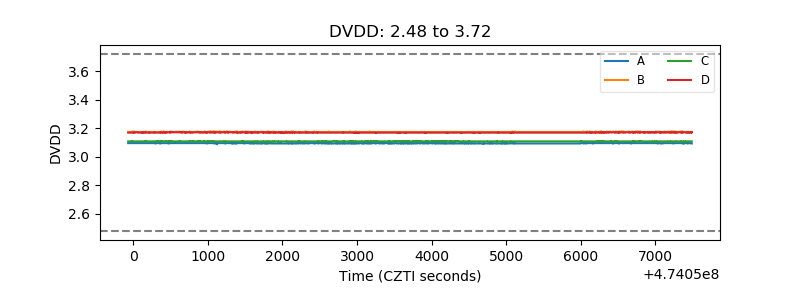 |
| Temperature 1 | 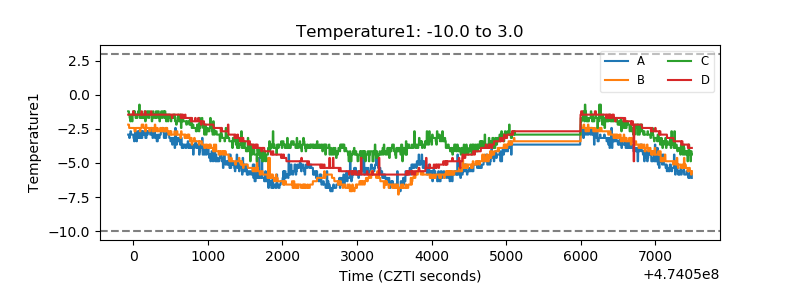 |
| Veto HV Monitor | 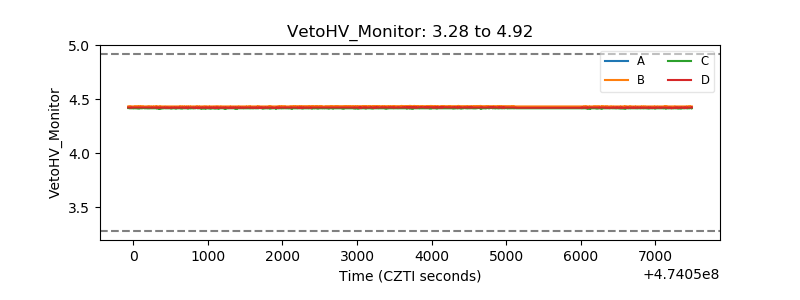 |
| Veto LLD | 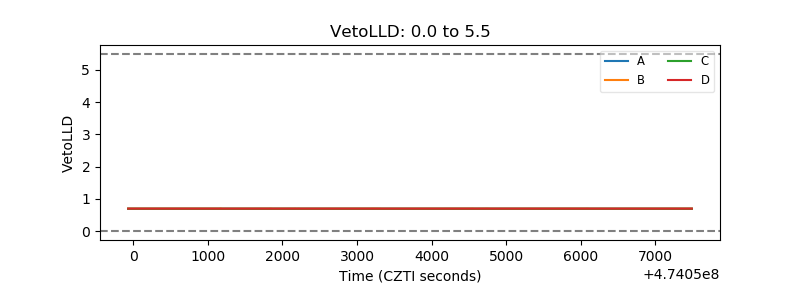 |
| Alpha Counter | 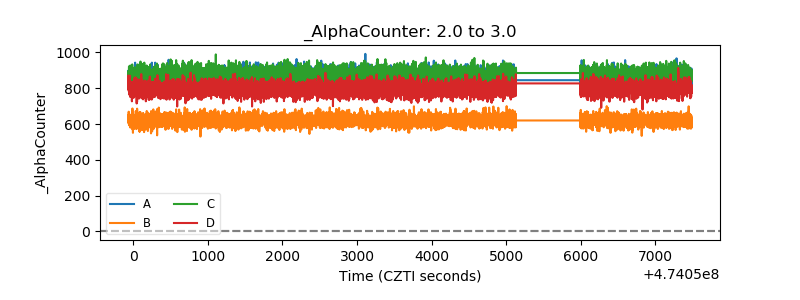 |
| _CPM_Rate | 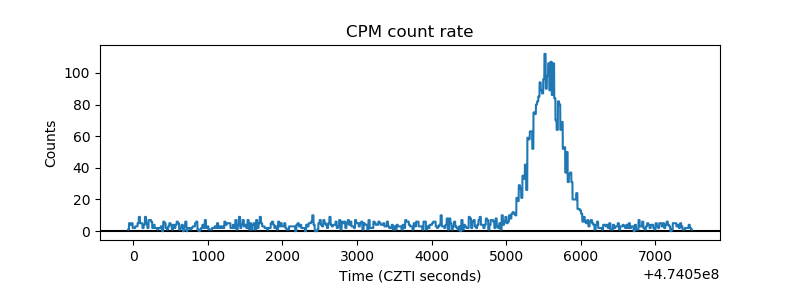 |
| CZT Counter | 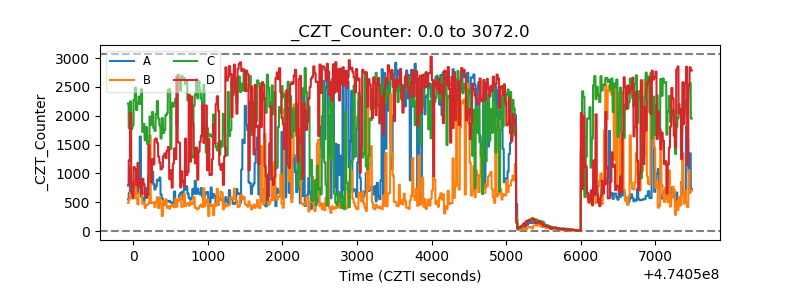 |
| +2.5 Volts monitor | 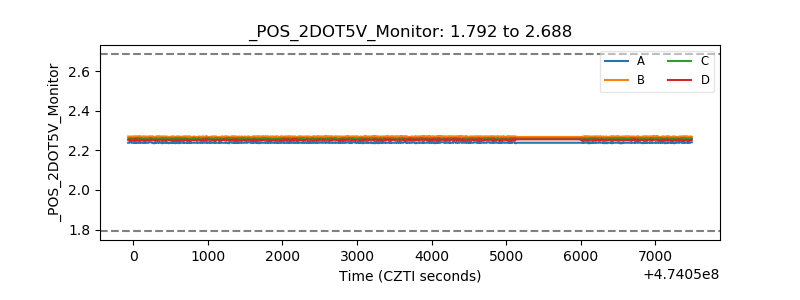 |
| +5 Volts monitor |  |
| _ROLL_ROT | 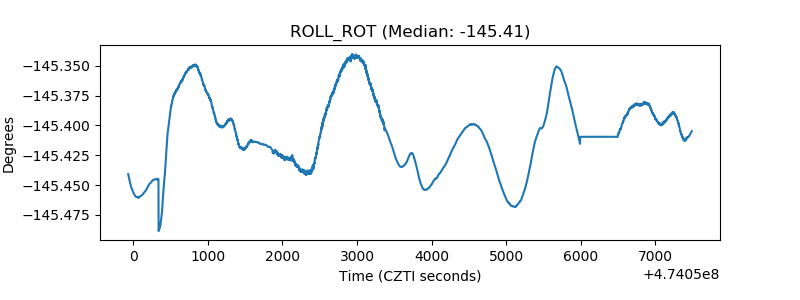 |
| _Roll_DEC | 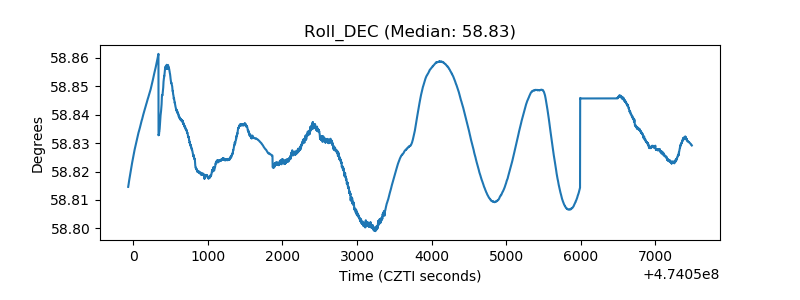 |
| _Roll_RA | 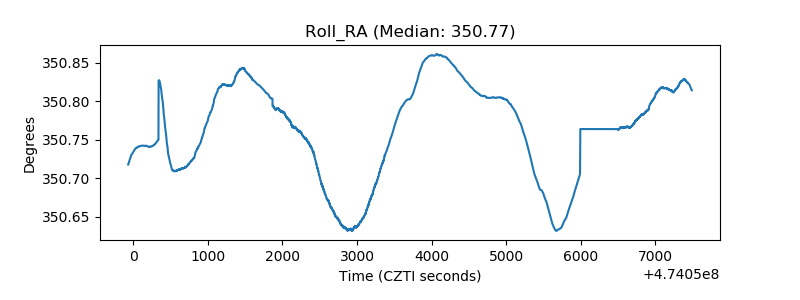 |
| Veto Counter | 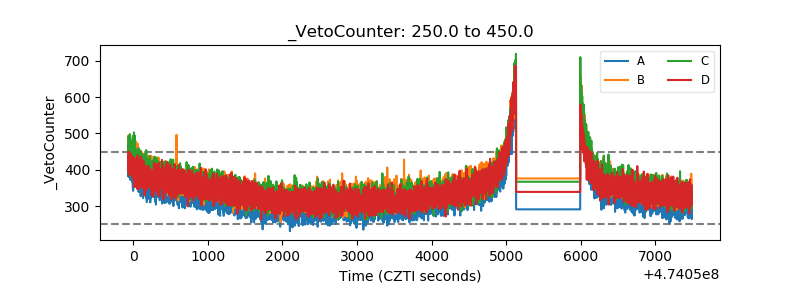 |