| Param | Original file | Final file |
|---|---|---|
| Filename | modeM0/AS1C09_003T01_9000006442_50206cztM0_level2.fits | modeM0/AS1C09_003T01_9000006442_50206cztM0_level2_quad_clean.evt |
| Size (bytes) | 1,196,812,800 | 60,857,280 |
| Size | 1.1 GB | 58.0 MB |
| Events in quadrant A | 9,878,297 | 408,135 |
| Events in quadrant B | 4,860,658 | 661,316 |
| Events in quadrant C | 15,370,650 | 3,251 |
| Events in quadrant D | 13,669,784 | 296,979 |
| Mode M9 | |||
|---|---|---|---|
| Quadrant | BADHDUFLAG | Total packets | Discarded packets |
| A | 0 | 4 | 0 |
| B | 0 | 4 | 0 |
| C | 0 | 4 | 0 |
| D | 0 | 4 | 0 |
| Mode M0 | |||
|---|---|---|---|
| Quadrant | BADHDUFLAG | Total packets | Discarded packets |
| A | 0 | 34037 | 1 |
| B | 0 | 19108 | 1 |
| C | 0 | 50300 | 1 |
| D | 0 | 45312 | 4 |
| Mode SS | |||
|---|---|---|---|
| Quadrant | BADHDUFLAG | Total packets | Discarded packets |
| A | 0 | 138 | 0 |
| B | 0 | 138 | 0 |
| C | 0 | 138 | 0 |
| D | 0 | 138 | 0 |
| Quadrant | Total seconds | Saturated seconds | Saturation percentage |
|---|---|---|---|
| A | 6779 | 2648 | 39.061809% |
| B | 6779 | 370 | 5.458032% |
| C | 6779 | 6751 | 99.586960% |
| D | 6778 | 3636 | 53.644143% |
Noise dominated data is calculated using 1-second bins in cleaned event files. If a bin has >2000 counts, and if more than 50% of those come from <1% of pixels, then it is considered to be noise-dominated and hence unusable.
| Quadrant | # 1 sec bins | Bins with >0 counts | Bins with >2000 counts | High rate bins dominated by noise | Noise dominated (total time) | Noise dominated (detector-on time) | Marked lightcurve |
|---|---|---|---|---|---|---|---|
| A | 7189 | 6778 | 2224 | 2224 | 30.94% | 32.81% | 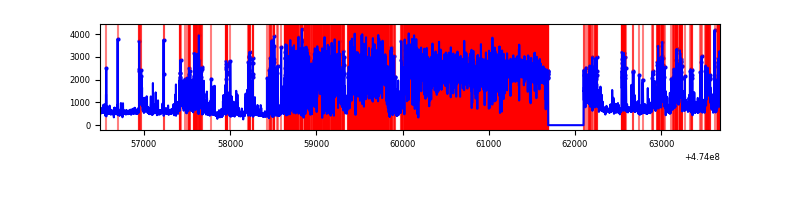 |
| B | 7190 | 6780 | 214 | 214 | 2.98% | 3.16% | 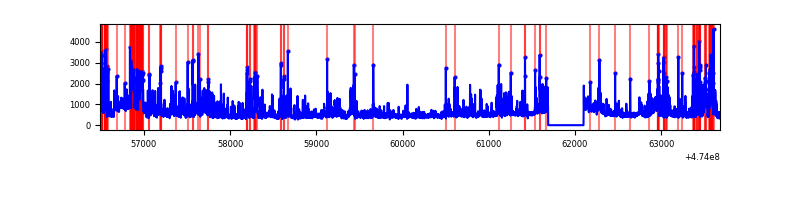 |
| C | 7189 | 6778 | 5218 | 5218 | 72.58% | 76.98% | 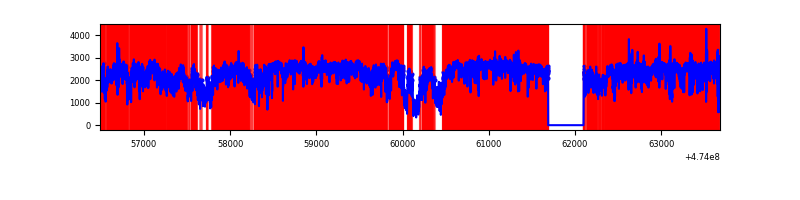 |
| D | 7189 | 6779 | 3486 | 3486 | 48.49% | 51.42% | 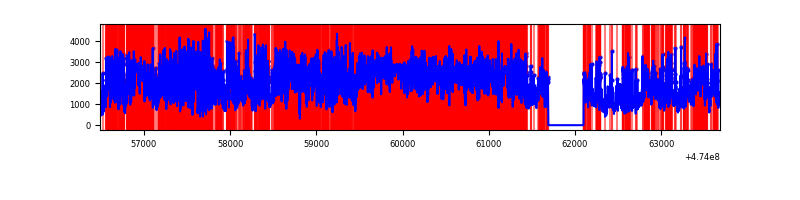 |
Top three noisy pixels from each quadrant. If the there are fewer than three noisy pixels in the level2.evt file, extra rows are filled as -1
| Pixel properties | Quadrant properties | ||||||
|---|---|---|---|---|---|---|---|
| Quadrant | DetID | PixID | Counts | Sigma | Mean | Median | Sigma |
| A | 0 | 98 | 4325874 | 29294.27 | 597 | 583 | 147.6 |
| A | 12 | 250 | 993274 | 6723.28 | 597 | 583 | 147.6 |
| A | 7 | 206 | 496426 | 3358.24 | 597 | 583 | 147.6 |
| B | 4 | 206 | 1385895 | 9404.3 | 697 | 673 | 147.3 |
| B | 5 | 185 | 141412 | 955.48 | 697 | 673 | 147.3 |
| B | 0 | 155 | 113300 | 764.63 | 697 | 673 | 147.3 |
| C | 4 | 111 | 8593917 | 250681.82 | 116 | 115 | 34.3 |
| C | 15 | 199 | 5738868 | 167399.83 | 116 | 115 | 34.3 |
| C | 0 | 177 | 106909 | 3115.19 | 116 | 115 | 34.3 |
| D | 7 | 61 | 4634013 | 29810.67 | 539 | 518 | 155.4 |
| D | 15 | 108 | 2243212 | 14428.89 | 539 | 518 | 155.4 |
| D | 15 | 185 | 655143 | 4211.68 | 539 | 518 | 155.4 |
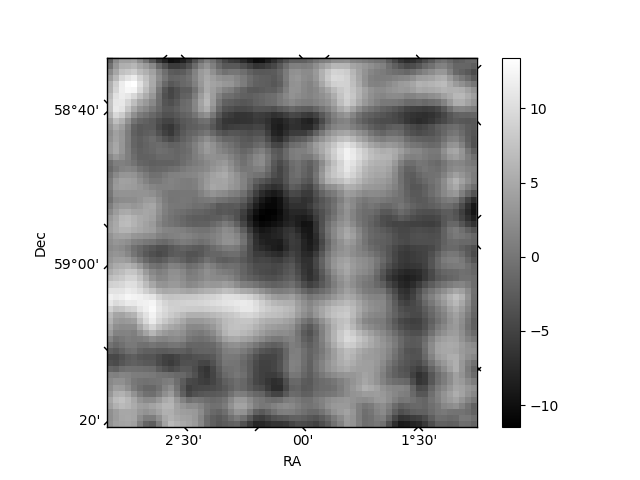
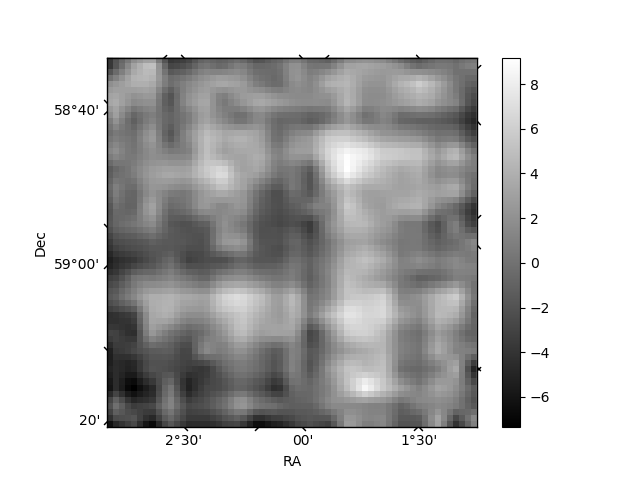
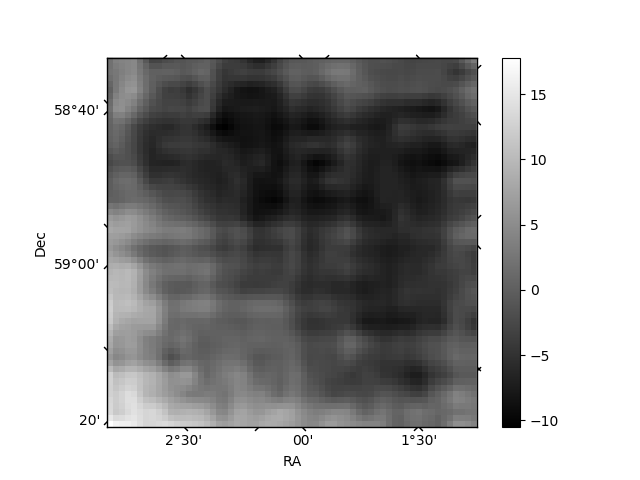
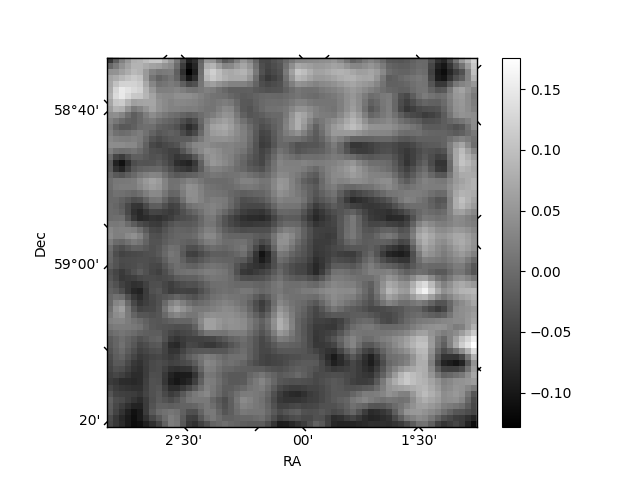
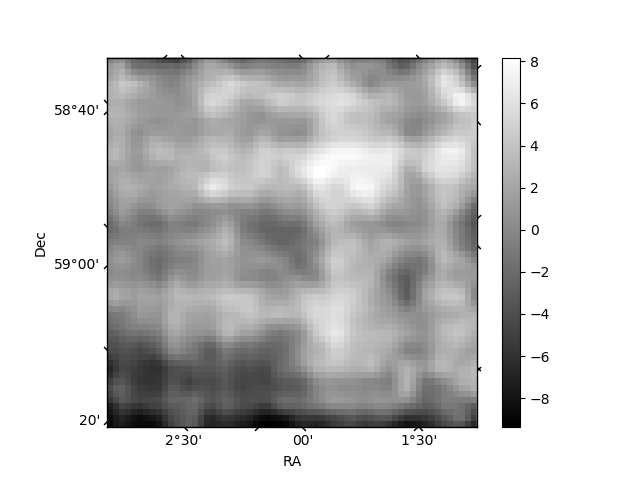
Histogram calculated using DETX and DETY for each event in the final _common_clean file
| Quadrant A | 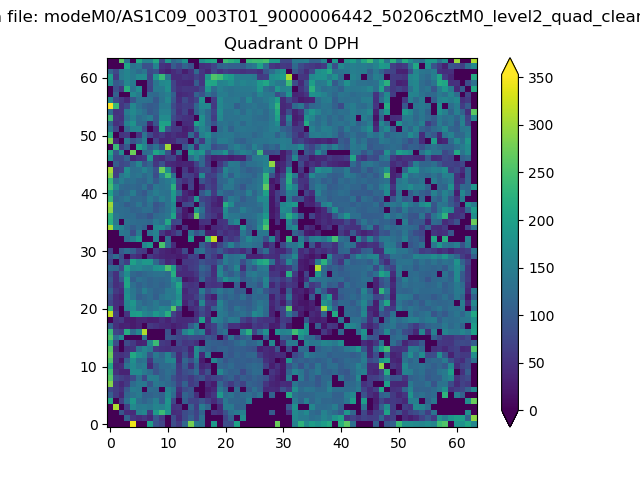 |
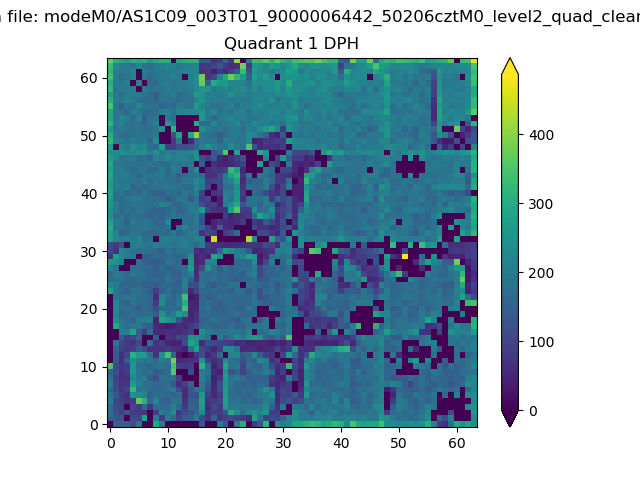 |
Quadrant B |
|---|---|---|---|
| Quadrant D | 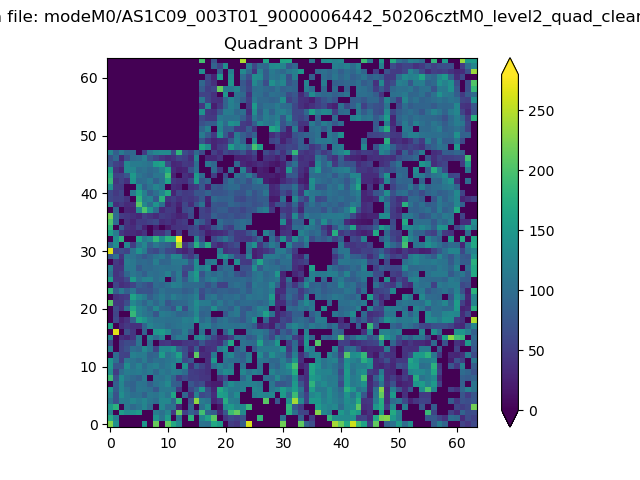 |
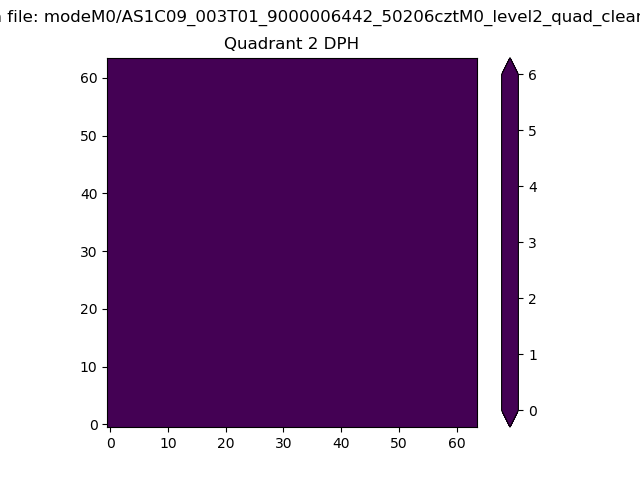 |
Quadrant C |
| Plot type | Count rate plots | Images |
|---|---|---|
| Comparison with Poisson distribution Blue bars denote a histogram of data divided into 1 sec bins. Red curve is a Poisson curve with rate = median count rate of data. |
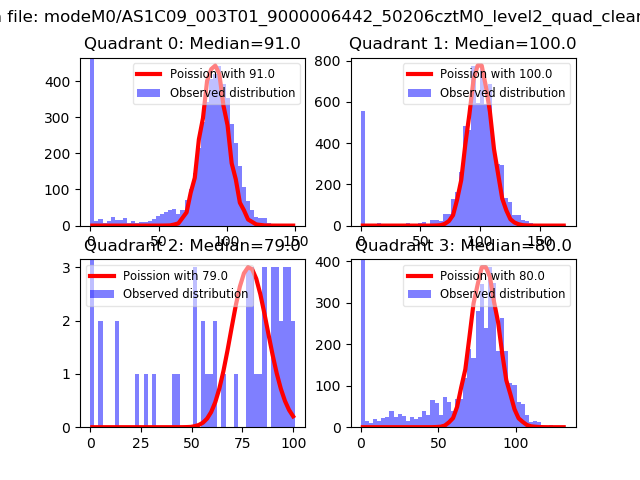 |
 |
| Quadrant-wise count rates Data is divided into 100 sec bins |
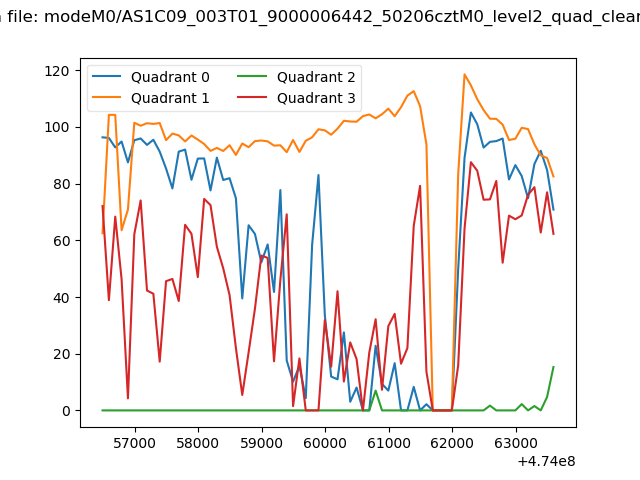 |
|
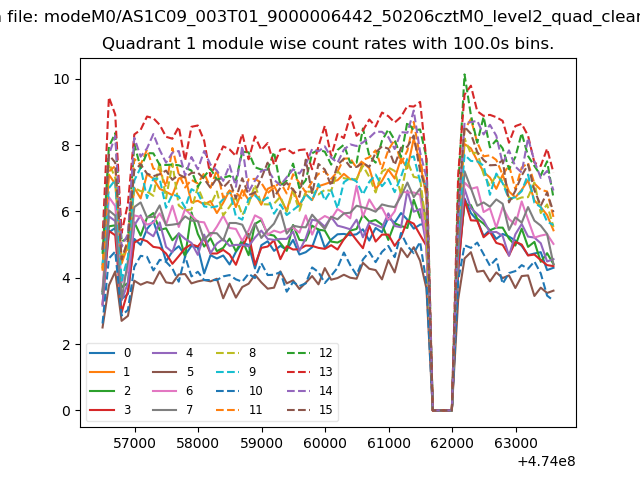
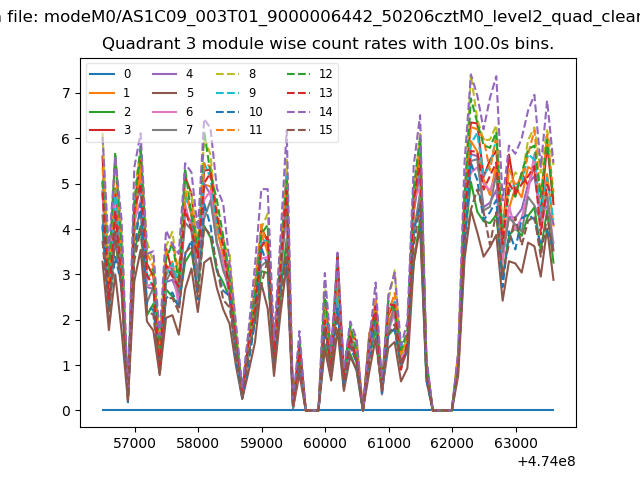
| Module-wise count rates for Quadrant A Data is divided into 100 sec bins |
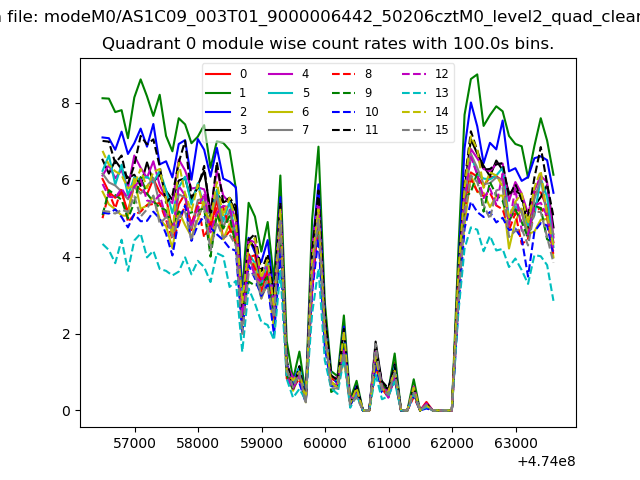 |
 |
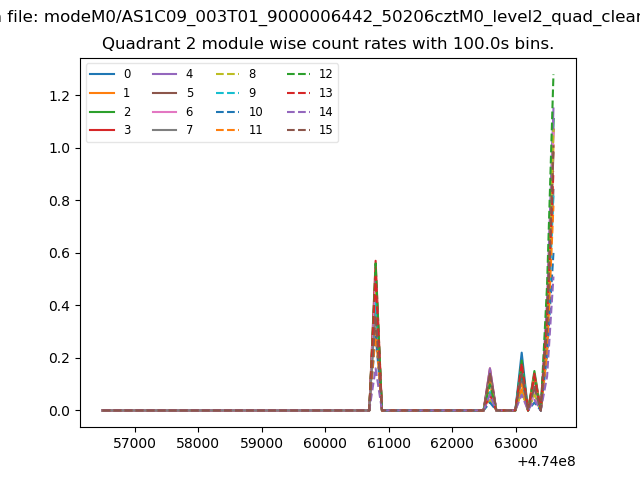
| Module-wise count rates for Quadrant B Data is divided into 100 sec bins |
 |
 |
| Module-wise count rates for Quadrant C Data is divided into 100 sec bins |
 |
 |
| Module-wise count rates for Quadrant D Data is divided into 100 sec bins |
 |
 |
| Parameter | Plot |
|---|---|
| CZT HV Monitor | 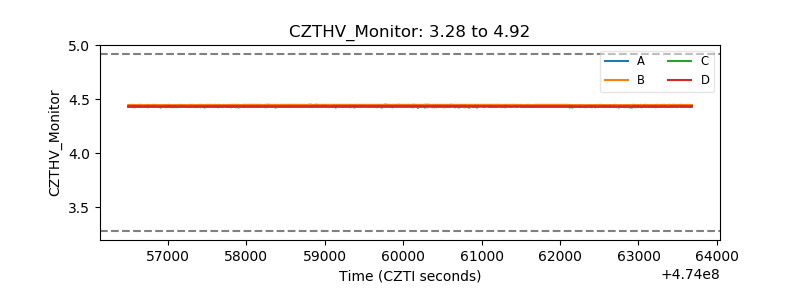 |
| D_VDD | 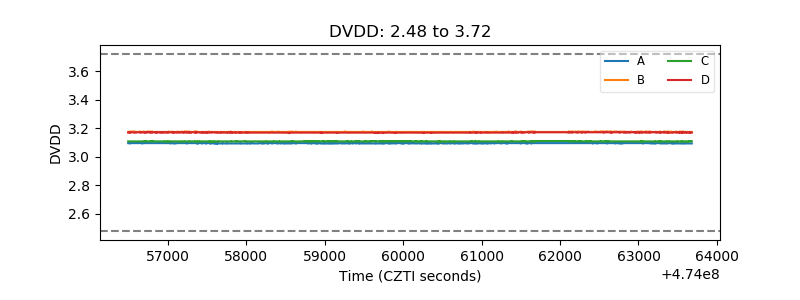 |
| Temperature 1 | 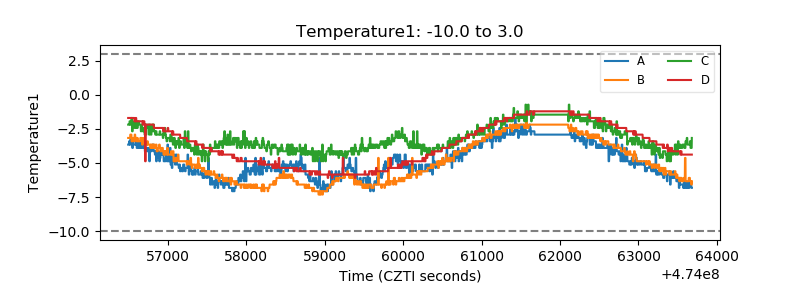 |
| Veto HV Monitor | 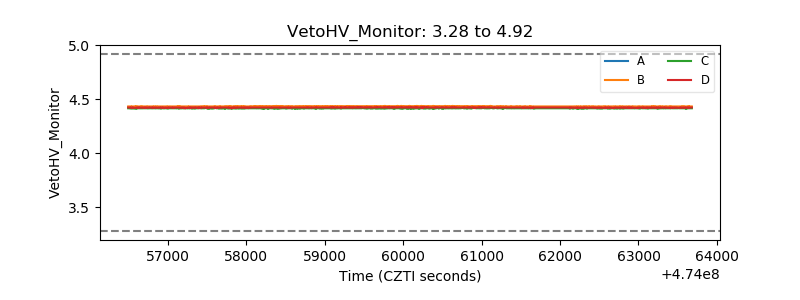 |
| Veto LLD | 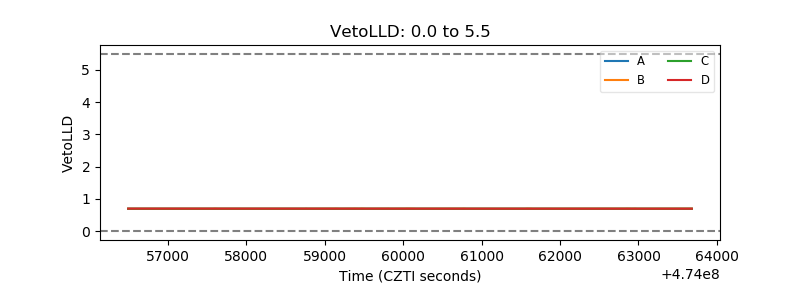 |
| Alpha Counter | 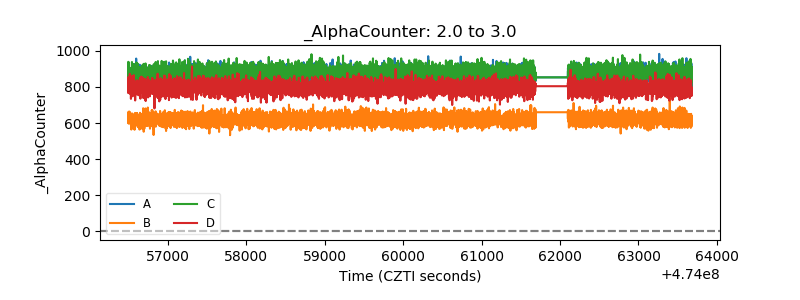 |
| _CPM_Rate | 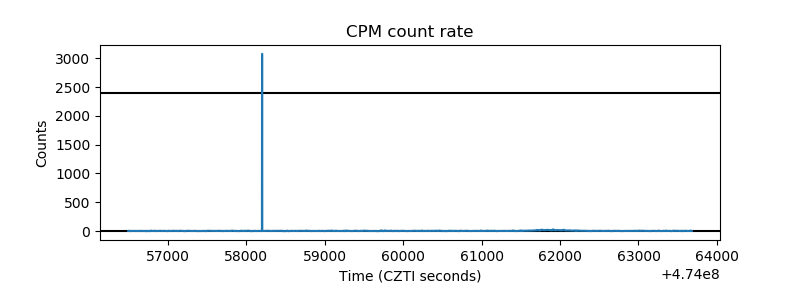 |
| CZT Counter | 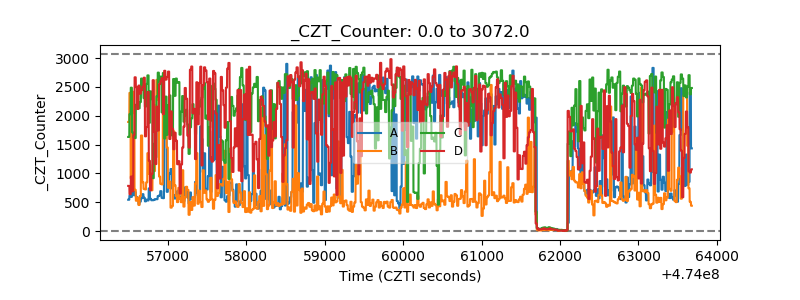 |
| +2.5 Volts monitor |  |
| +5 Volts monitor |  |
| _ROLL_ROT | 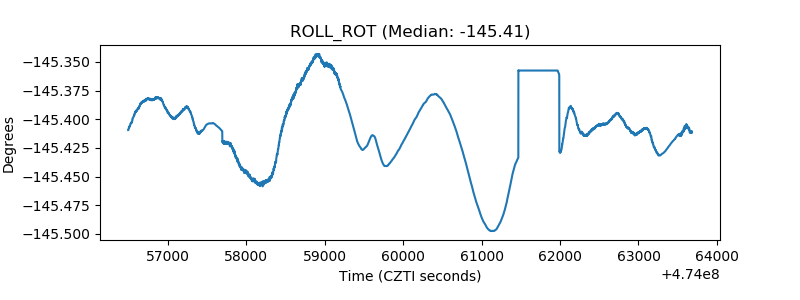 |
| _Roll_DEC | 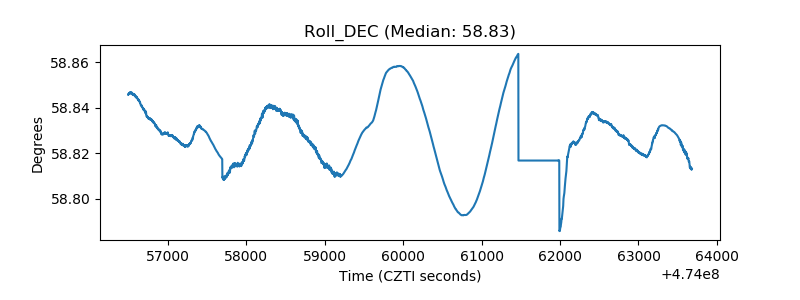 |
| _Roll_RA | 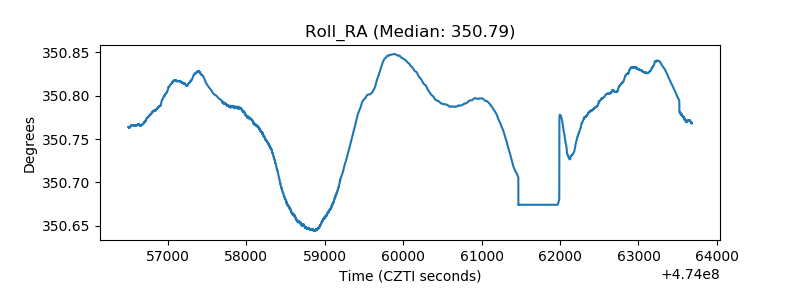 |
| Veto Counter | 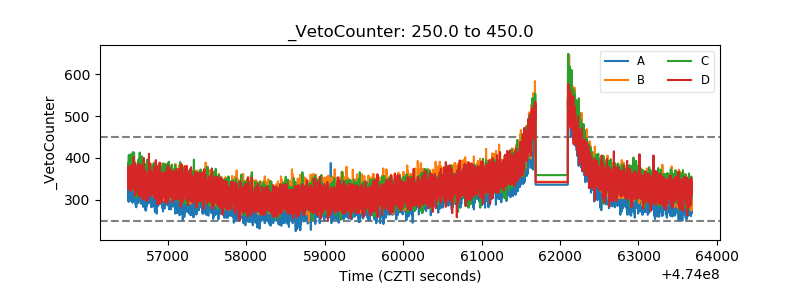 |