| Param | Original file | Final file |
|---|---|---|
| Filename | modeM0/AS1C09_003T01_9000006442_50207cztM0_level2.fits | modeM0/AS1C09_003T01_9000006442_50207cztM0_level2_quad_clean.evt |
| Size (bytes) | 1,492,994,880 | 69,419,520 |
| Size | 1.4 GB | 66.2 MB |
| Events in quadrant A | 12,687,894 | 453,765 |
| Events in quadrant B | 6,963,162 | 753,506 |
| Events in quadrant C | 18,552,070 | 52,174 |
| Events in quadrant D | 16,451,438 | 288,884 |
| Mode M9 | |||
|---|---|---|---|
| Quadrant | BADHDUFLAG | Total packets | Discarded packets |
| A | 1 | 140372584478760 | 140372416135214 |
| B | 1 | -1 | -1 |
| C | 1 | -1 | -1 |
| D | 1 | -1 | -1 |
| Mode M0 | |||
|---|---|---|---|
| Quadrant | BADHDUFLAG | Total packets | Discarded packets |
| A | 0 | 43270 | 1 |
| B | 0 | 26162 | 1 |
| C | 0 | 60557 | 1 |
| D | 0 | 54366 | 5 |
| Mode SS | |||
|---|---|---|---|
| Quadrant | BADHDUFLAG | Total packets | Discarded packets |
| A | 0 | 160 | 0 |
| B | 0 | 160 | 0 |
| C | 0 | 160 | 0 |
| D | 0 | 158 | 0 |
| Quadrant | Total seconds | Saturated seconds | Saturation percentage |
|---|---|---|---|
| A | 7954 | 3416 | 42.946945% |
| B | 7954 | 739 | 9.290923% |
| C | 7954 | 7454 | 93.713855% |
| D | 7953 | 4799 | 60.342009% |
Noise dominated data is calculated using 1-second bins in cleaned event files. If a bin has >2000 counts, and if more than 50% of those come from <1% of pixels, then it is considered to be noise-dominated and hence unusable.
| Quadrant | # 1 sec bins | Bins with >0 counts | Bins with >2000 counts | High rate bins dominated by noise | Noise dominated (total time) | Noise dominated (detector-on time) | Marked lightcurve |
|---|---|---|---|---|---|---|---|
| A | 7953 | 7953 | 3007 | 3007 | 37.81% | 37.81% | 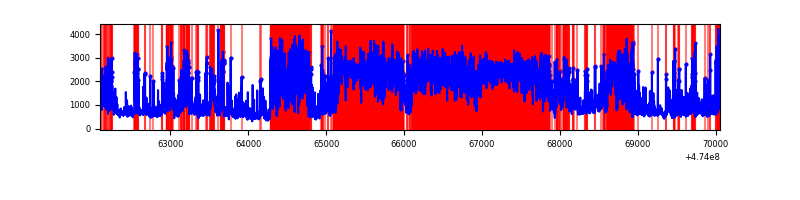 |
| B | 7954 | 7954 | 487 | 487 | 6.12% | 6.12% | 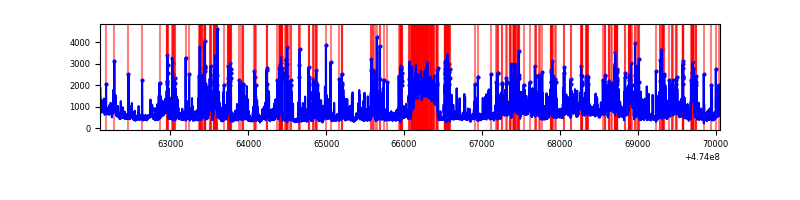 |
| C | 7954 | 7954 | 6517 | 6517 | 81.93% | 81.93% | 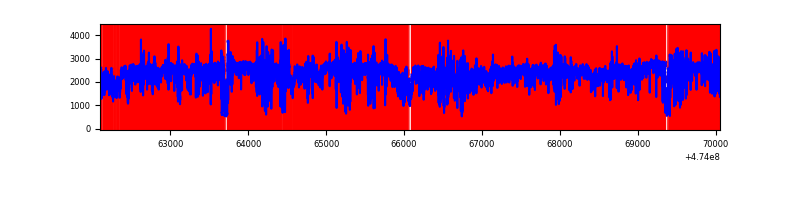 |
| D | 7952 | 7952 | 4657 | 4657 | 58.56% | 58.56% | 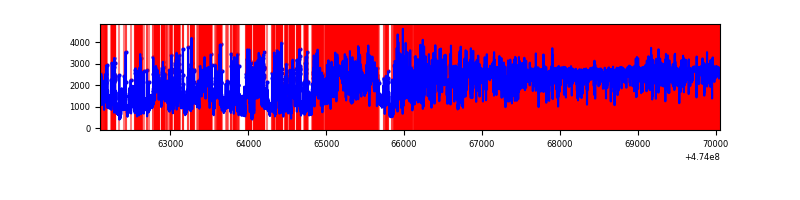 |
Top three noisy pixels from each quadrant. If the there are fewer than three noisy pixels in the level2.evt file, extra rows are filled as -1
| Pixel properties | Quadrant properties | ||||||
|---|---|---|---|---|---|---|---|
| Quadrant | DetID | PixID | Counts | Sigma | Mean | Median | Sigma |
| A | 0 | 98 | 5721286 | 31929.95 | 708 | 687 | 179.2 |
| A | 12 | 250 | 1107081 | 6175.42 | 708 | 687 | 179.2 |
| A | 8 | 8 | 503809 | 2808.21 | 708 | 687 | 179.2 |
| B | 4 | 206 | 2750901 | 16004.94 | 817 | 790 | 171.8 |
| B | 4 | 170 | 115389 | 666.94 | 817 | 790 | 171.8 |
| B | 3 | 249 | 84080 | 484.73 | 817 | 790 | 171.8 |
| C | 4 | 111 | 15576412 | 213394.47 | 251 | 248 | 73.0 |
| C | 15 | 147 | 463292 | 6343.73 | 251 | 248 | 73.0 |
| C | 13 | 250 | 353154 | 4834.84 | 251 | 248 | 73.0 |
| D | 7 | 61 | 5347793 | 32835.65 | 558 | 537 | 162.8 |
| D | 15 | 108 | 3492208 | 21441.14 | 558 | 537 | 162.8 |
| D | 15 | 168 | 1717064 | 10540.6 | 558 | 537 | 162.8 |
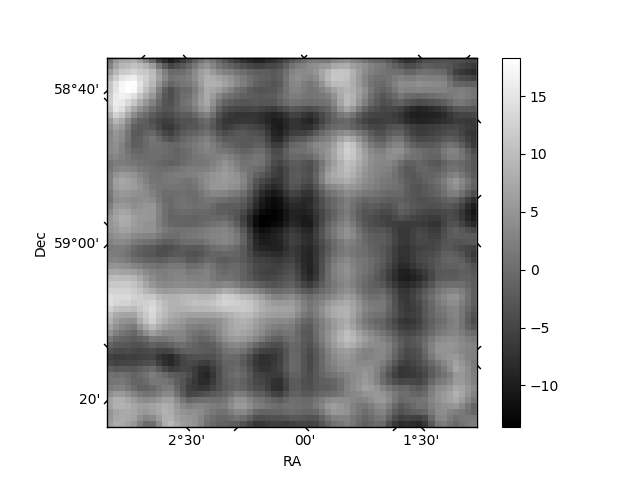
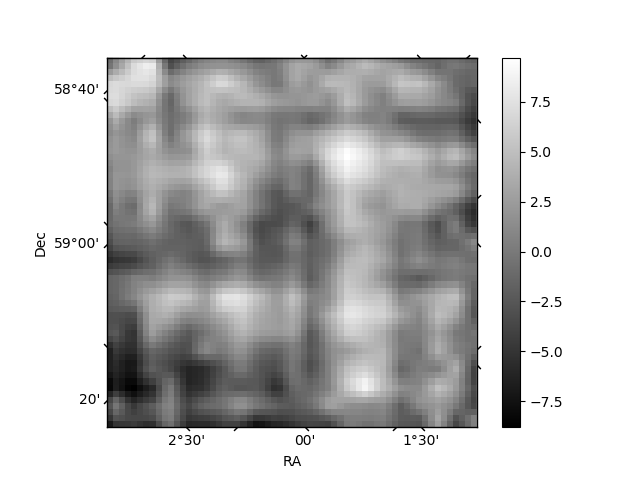
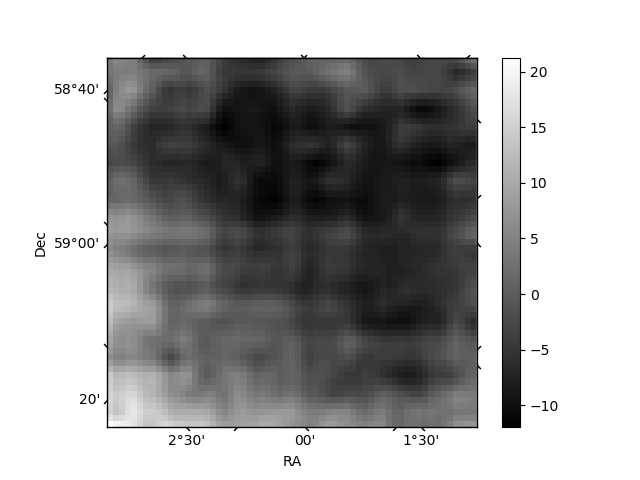
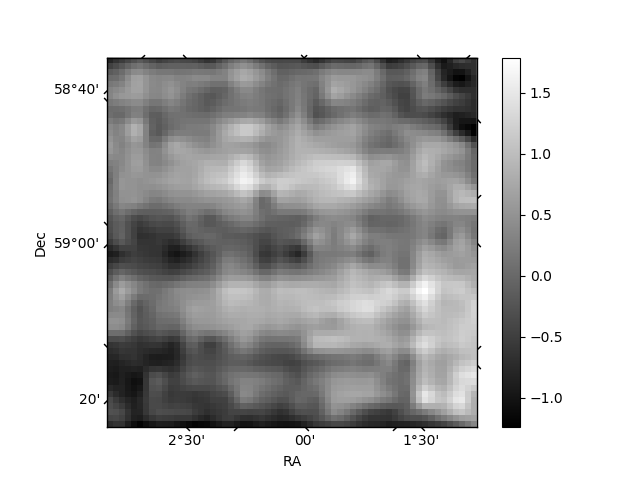
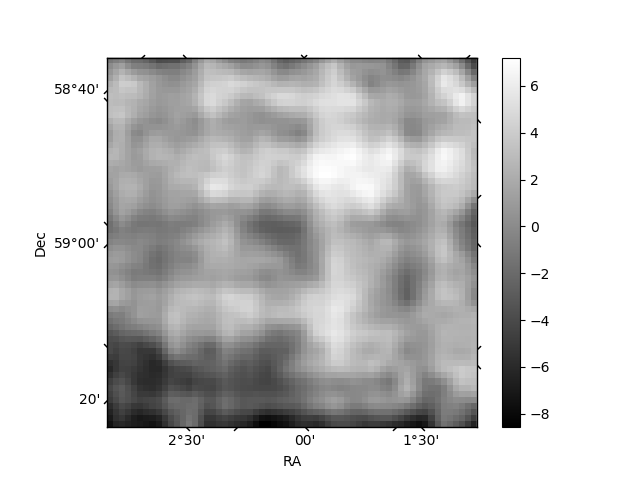
Histogram calculated using DETX and DETY for each event in the final _common_clean file
| Quadrant A | 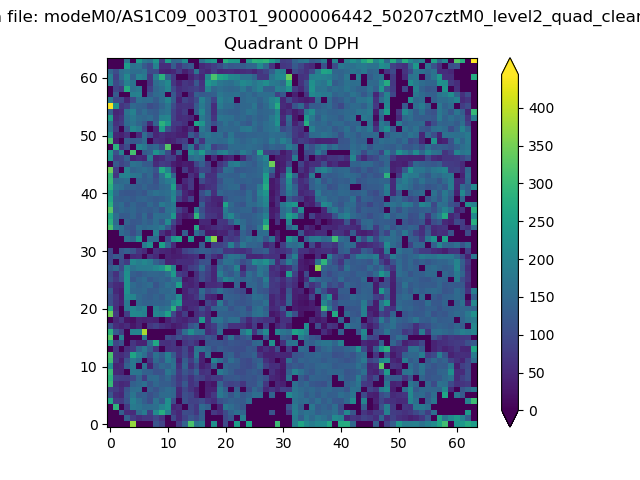 |
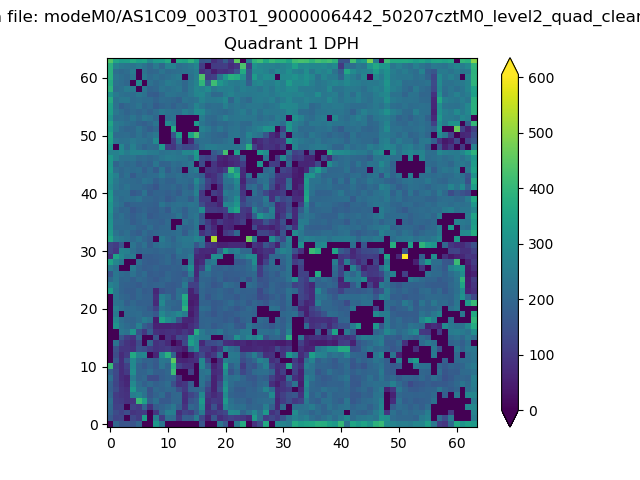 |
Quadrant B |
|---|---|---|---|
| Quadrant D | 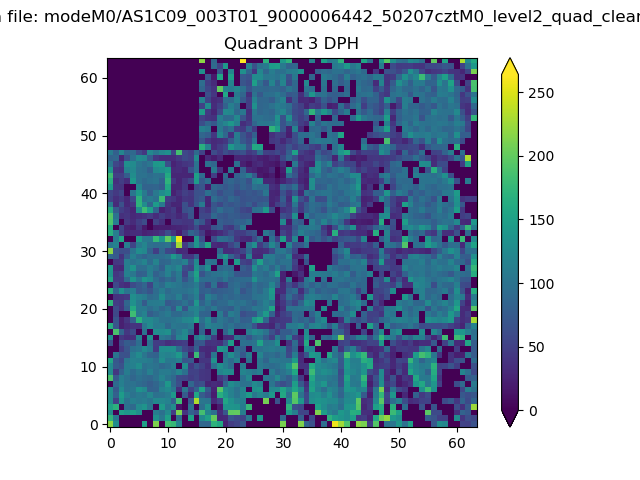 |
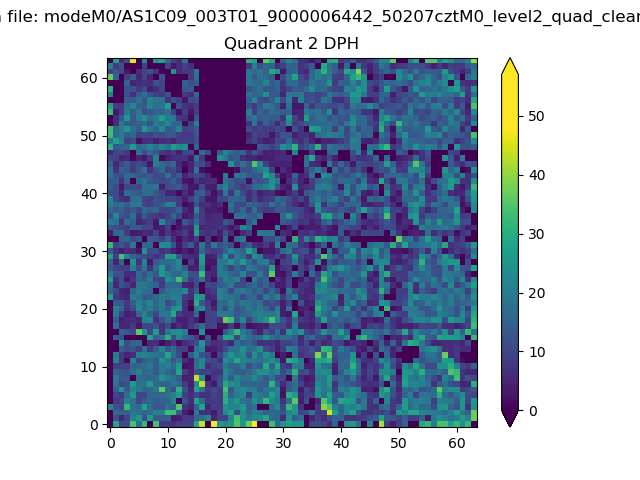 |
Quadrant C |
| Plot type | Count rate plots | Images |
|---|---|---|
| Comparison with Poisson distribution Blue bars denote a histogram of data divided into 1 sec bins. Red curve is a Poisson curve with rate = median count rate of data. |
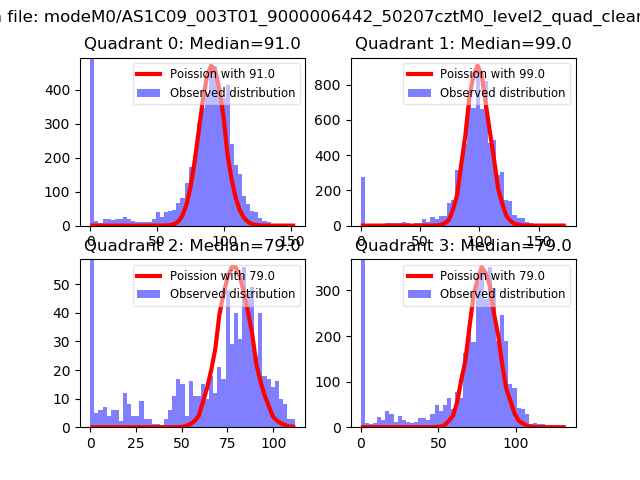 |
 |
| Quadrant-wise count rates Data is divided into 100 sec bins |
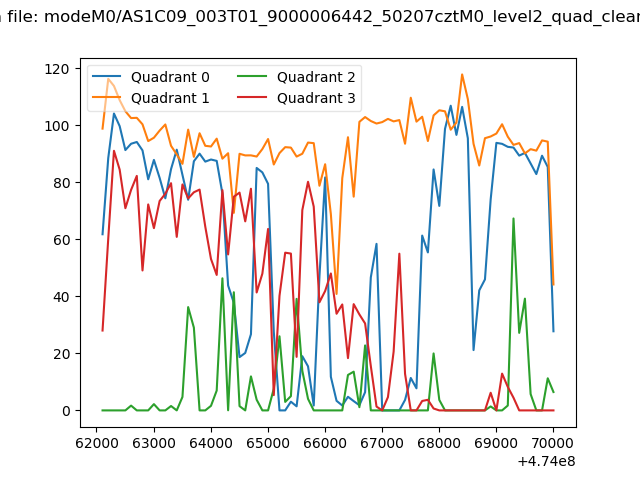 |
|
| Module-wise count rates for Quadrant A Data is divided into 100 sec bins |
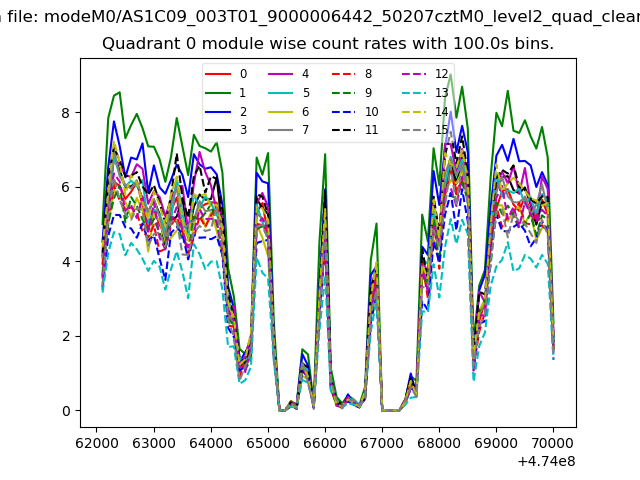 |
 |
| Module-wise count rates for Quadrant B Data is divided into 100 sec bins |
 |
 |
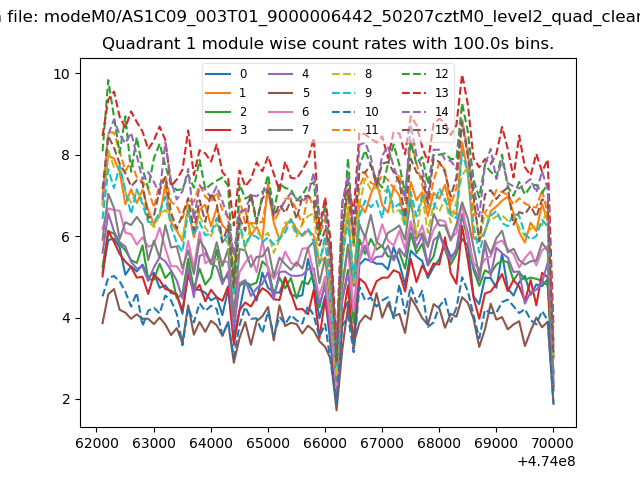
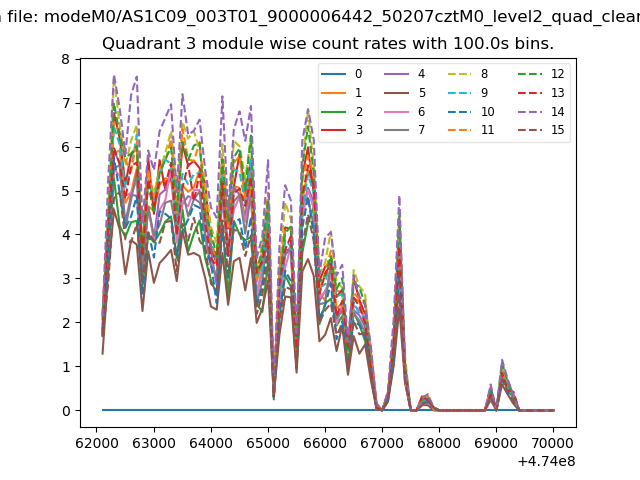
| Module-wise count rates for Quadrant C Data is divided into 100 sec bins |
 |
 |
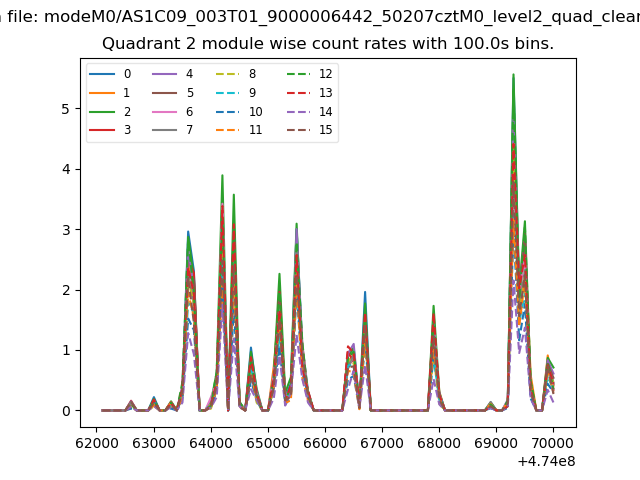
| Module-wise count rates for Quadrant D Data is divided into 100 sec bins |
 |
 |
| Parameter | Plot |
|---|---|
| CZT HV Monitor | 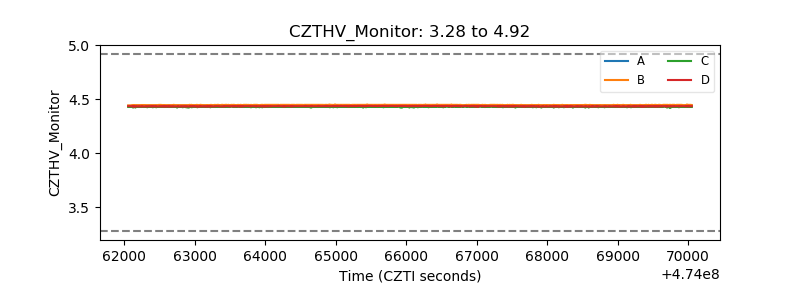 |
| D_VDD | 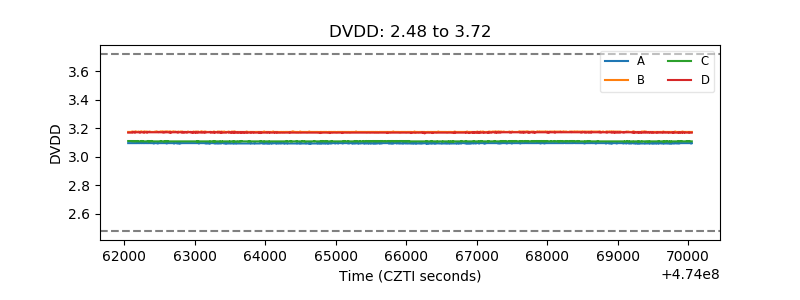 |
| Temperature 1 | 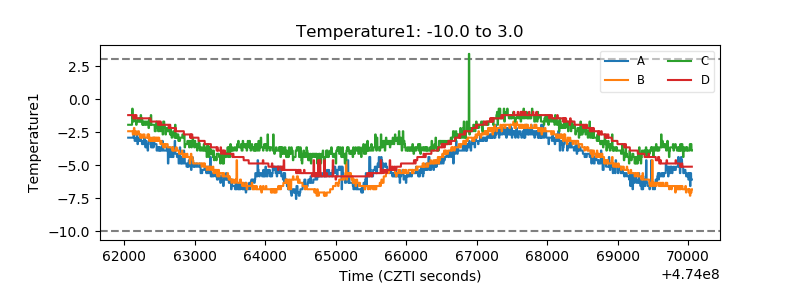 |
| Veto HV Monitor | 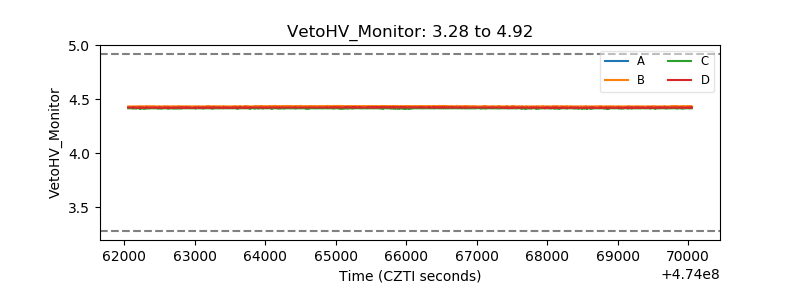 |
| Veto LLD |  |
| Alpha Counter | 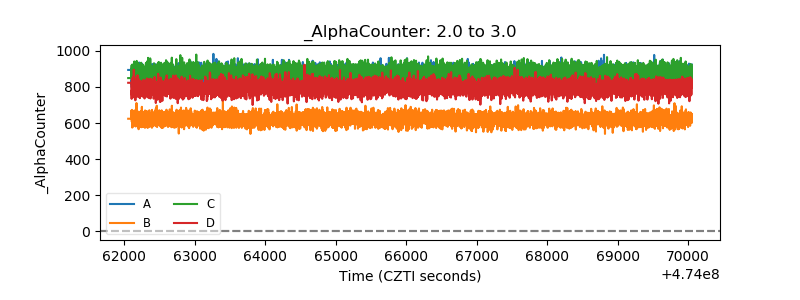 |
| _CPM_Rate | 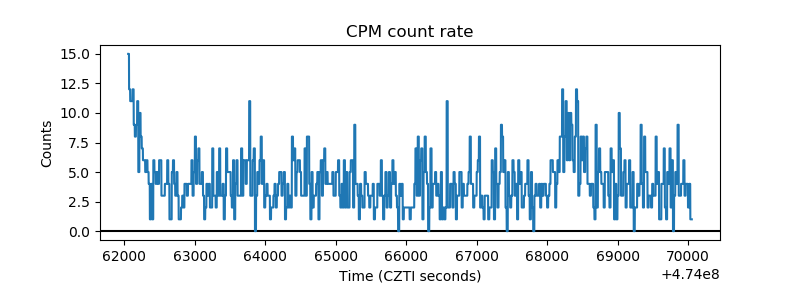 |
| CZT Counter | 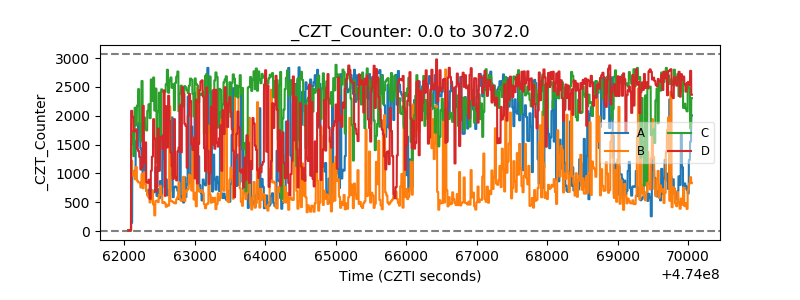 |
| +2.5 Volts monitor | 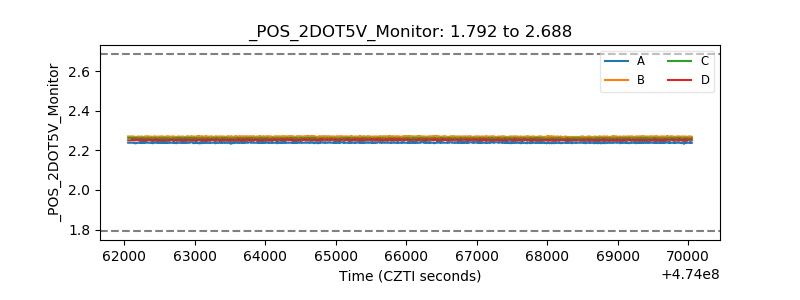 |
| +5 Volts monitor | 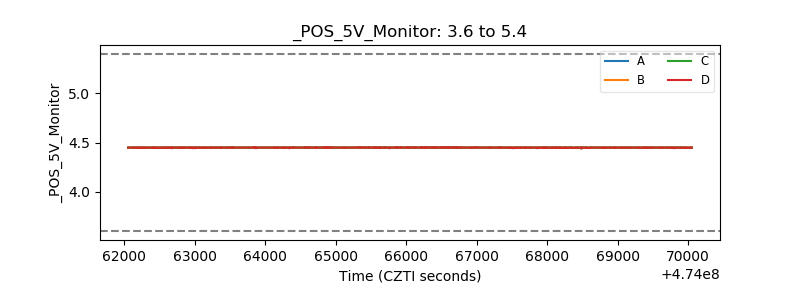 |
| _ROLL_ROT | 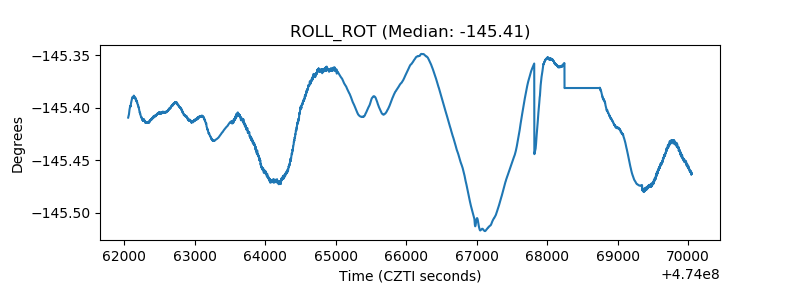 |
| _Roll_DEC | 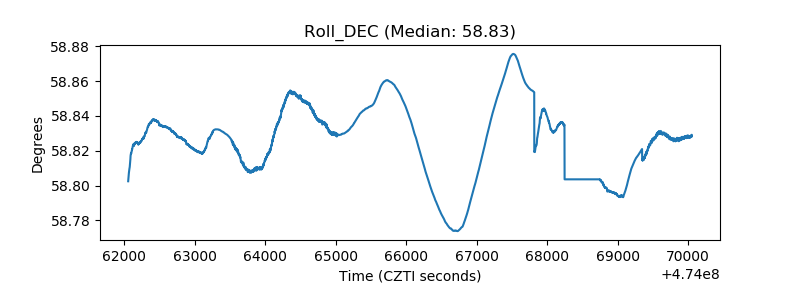 |
| _Roll_RA | 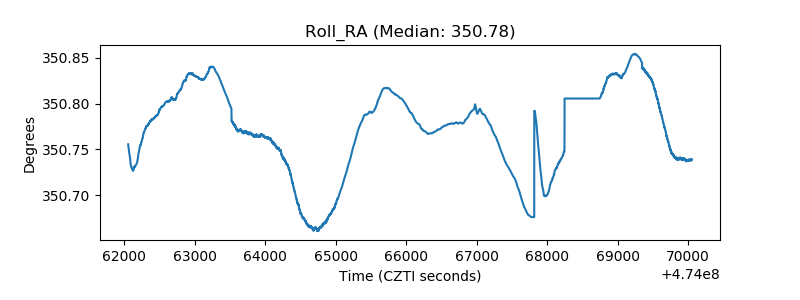 |
| Veto Counter | 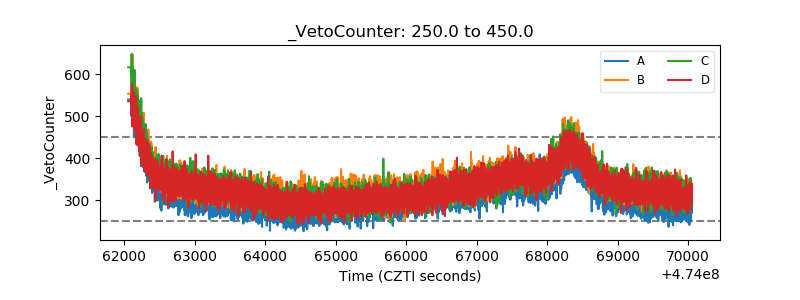 |