| Param | Original file | Final file |
|---|---|---|
| Filename | modeM0/AS1C09_003T01_9000006442_50208cztM0_level2.fits | modeM0/AS1C09_003T01_9000006442_50208cztM0_level2_quad_clean.evt |
| Size (bytes) | 1,706,137,920 | 49,605,120 |
| Size | 1.6 GB | 47.3 MB |
| Events in quadrant A | 16,131,303 | 222,313 |
| Events in quadrant B | 8,891,540 | 658,259 |
| Events in quadrant C | 17,936,875 | 69,482 |
| Events in quadrant D | 19,605,026 | 14,525 |
| Mode M0 | |||
|---|---|---|---|
| Quadrant | BADHDUFLAG | Total packets | Discarded packets |
| A | 0 | 53263 | 0 |
| B | 0 | 31786 | 0 |
| C | 0 | 58511 | 0 |
| D | 0 | 63464 | 0 |
| Mode SS | |||
|---|---|---|---|
| Quadrant | BADHDUFLAG | Total packets | Discarded packets |
| A | 0 | 156 | 0 |
| B | 0 | 156 | 0 |
| C | 0 | 156 | 0 |
| D | 0 | 156 | 0 |
| Quadrant | Total seconds | Saturated seconds | Saturation percentage |
|---|---|---|---|
| A | 7711 | 5520 | 71.586046% |
| B | 7712 | 1384 | 17.946058% |
| C | 7711 | 7055 | 91.492673% |
| D | 7711 | 7579 | 98.288160% |
Noise dominated data is calculated using 1-second bins in cleaned event files. If a bin has >2000 counts, and if more than 50% of those come from <1% of pixels, then it is considered to be noise-dominated and hence unusable.
| Quadrant | # 1 sec bins | Bins with >0 counts | Bins with >2000 counts | High rate bins dominated by noise | Noise dominated (total time) | Noise dominated (detector-on time) | Marked lightcurve |
|---|---|---|---|---|---|---|---|
| A | 7710 | 7710 | 5125 | 5125 | 66.47% | 66.47% | 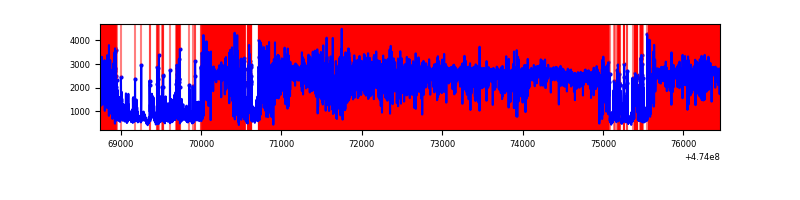 |
| B | 7712 | 7712 | 1011 | 1011 | 13.11% | 13.11% | 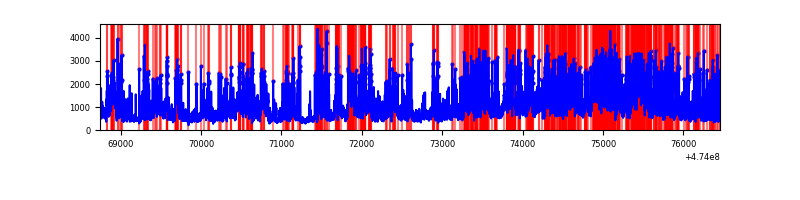 |
| C | 7710 | 7710 | 6191 | 6191 | 80.30% | 80.30% | 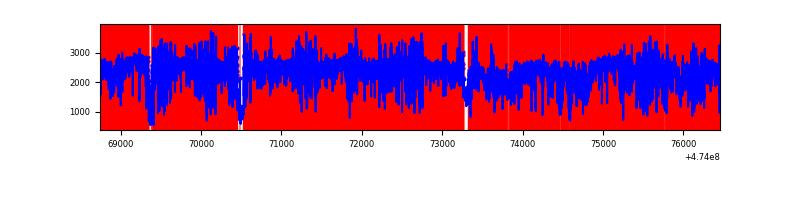 |
| D | 7710 | 7710 | 7334 | 7334 | 95.12% | 95.12% | 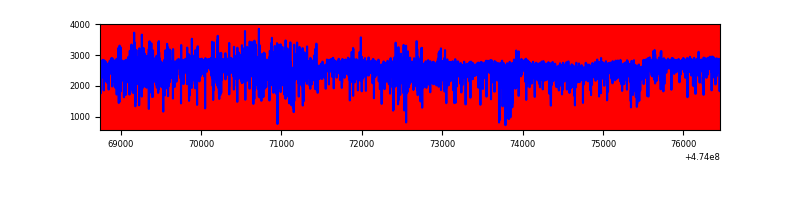 |
Top three noisy pixels from each quadrant. If the there are fewer than three noisy pixels in the level2.evt file, extra rows are filled as -1
| Pixel properties | Quadrant properties | ||||||
|---|---|---|---|---|---|---|---|
| Quadrant | DetID | PixID | Counts | Sigma | Mean | Median | Sigma |
| A | 0 | 98 | 10002118 | 70693.08 | 537 | 521 | 141.5 |
| A | 12 | 250 | 913832 | 6455.45 | 537 | 521 | 141.5 |
| A | 8 | 249 | 691958 | 4887.2 | 537 | 521 | 141.5 |
| B | 4 | 206 | 2731910 | 17410.6 | 745 | 719 | 156.9 |
| B | 10 | 128 | 1641691 | 10460.75 | 745 | 719 | 156.9 |
| B | 3 | 249 | 607914 | 3870.7 | 745 | 719 | 156.9 |
| C | 4 | 111 | 11451722 | 135616.79 | 289 | 288 | 84.4 |
| C | 15 | 197 | 2398092 | 28396.66 | 289 | 288 | 84.4 |
| C | 13 | 250 | 984972 | 11661.39 | 289 | 288 | 84.4 |
| D | 7 | 61 | 7822968 | 80531.69 | 302 | 289 | 97.1 |
| D | 15 | 168 | 3012756 | 31012.27 | 302 | 289 | 97.1 |
| D | 15 | 108 | 2532578 | 26069.01 | 302 | 289 | 97.1 |
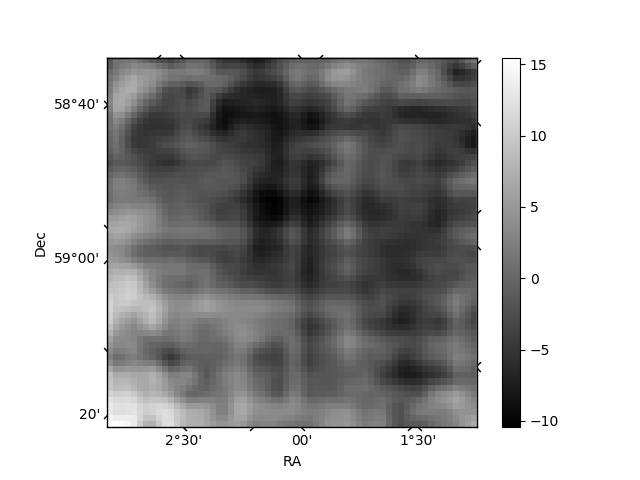
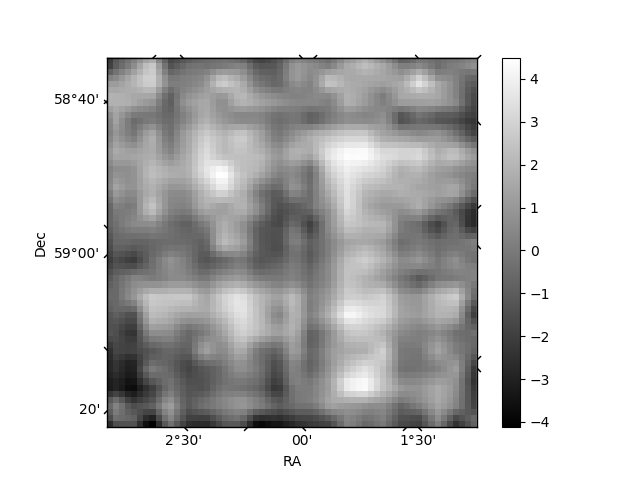
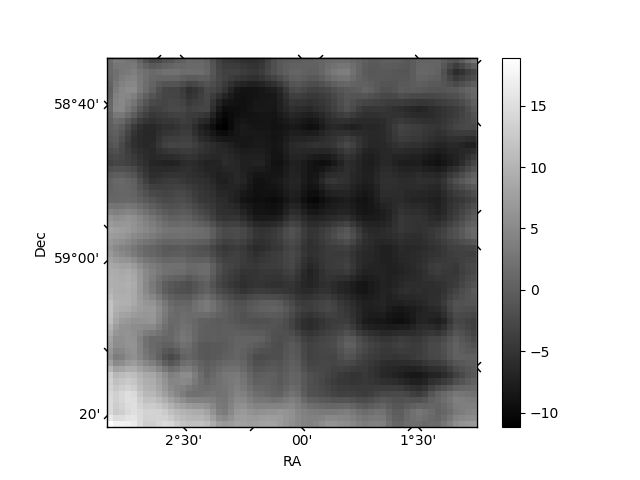
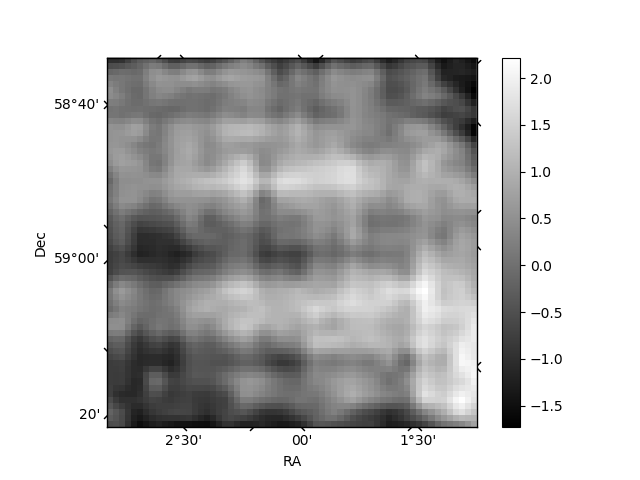
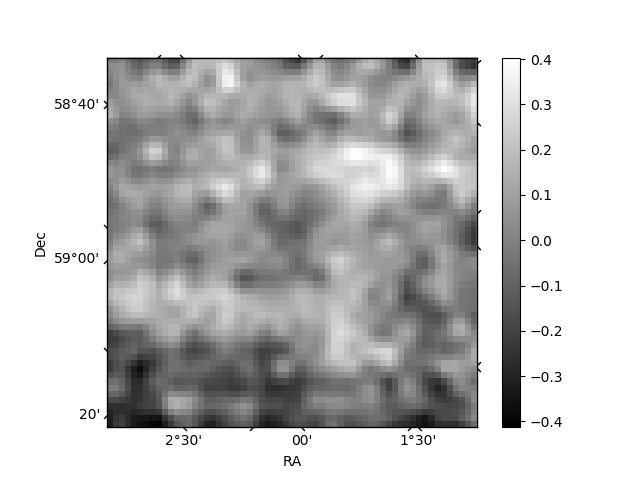
Histogram calculated using DETX and DETY for each event in the final _common_clean file
| Quadrant A | 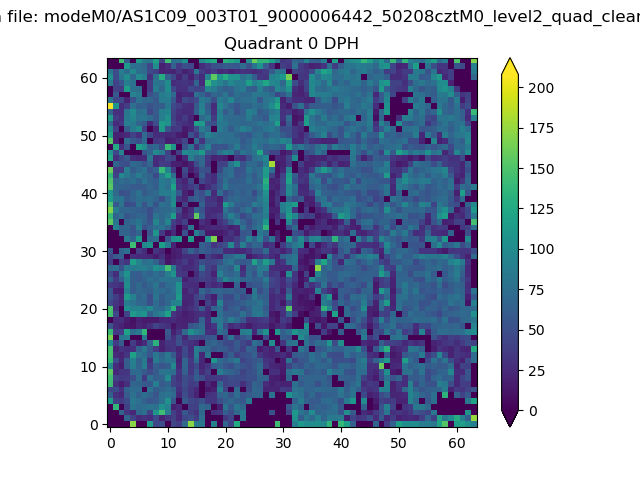 |
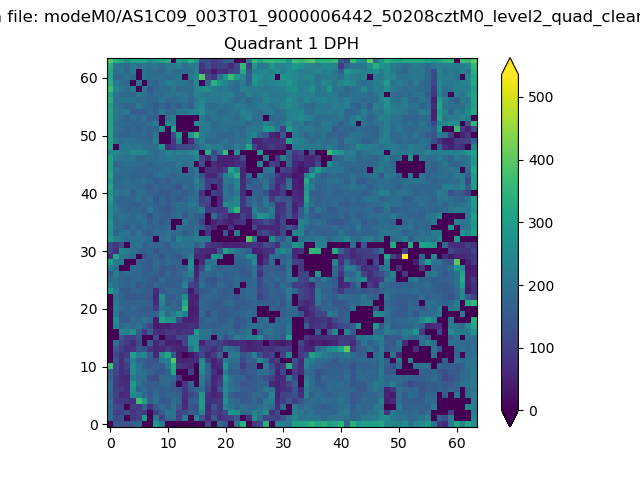 |
Quadrant B |
|---|---|---|---|
| Quadrant D | 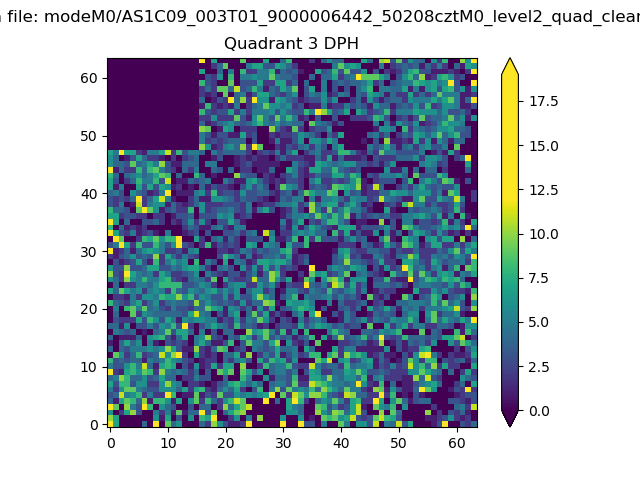 |
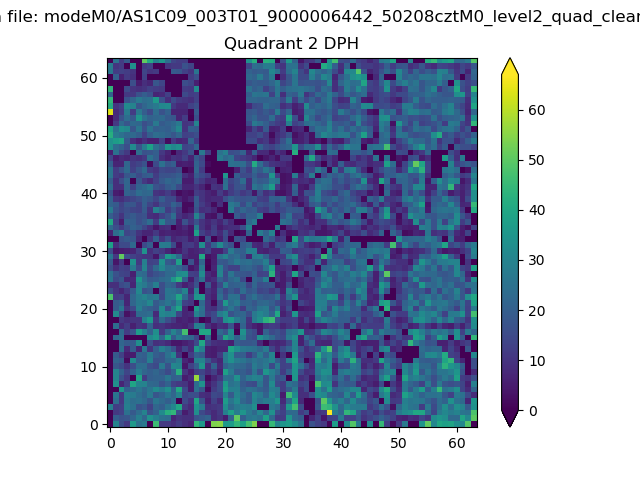 |
Quadrant C |
| Plot type | Count rate plots | Images |
|---|---|---|
| Comparison with Poisson distribution Blue bars denote a histogram of data divided into 1 sec bins. Red curve is a Poisson curve with rate = median count rate of data. |
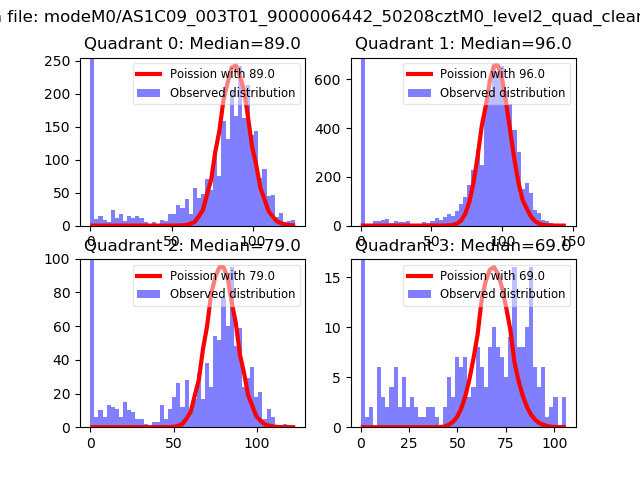 |
 |
| Quadrant-wise count rates Data is divided into 100 sec bins |
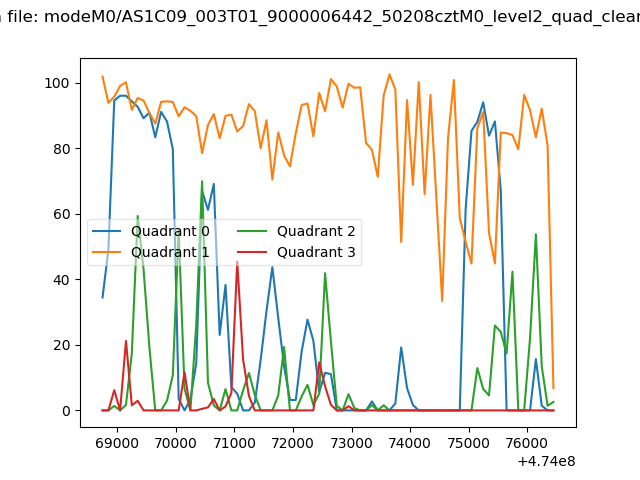 |
|
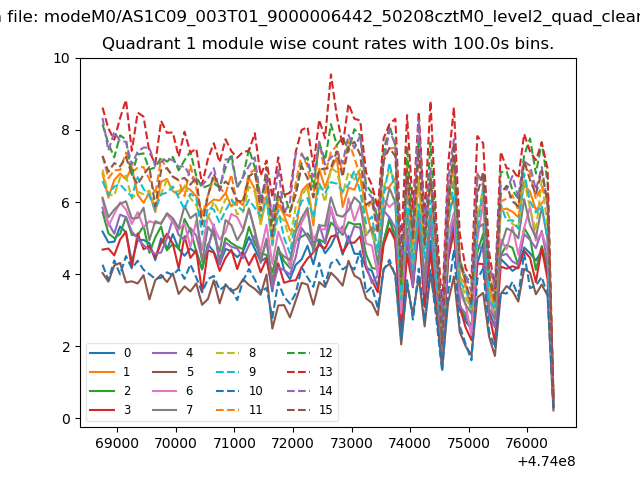
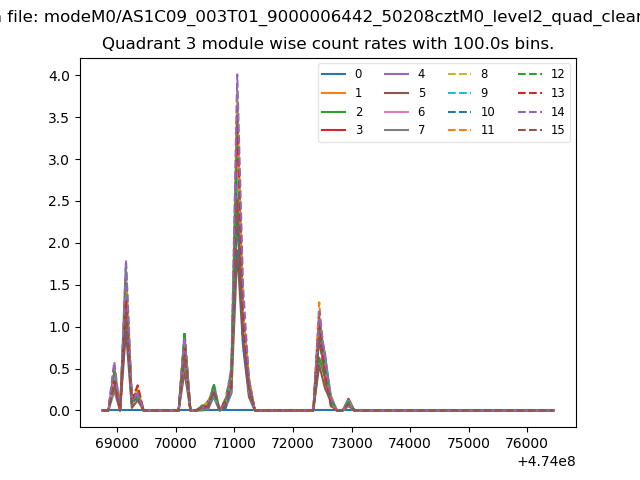
| Module-wise count rates for Quadrant A Data is divided into 100 sec bins |
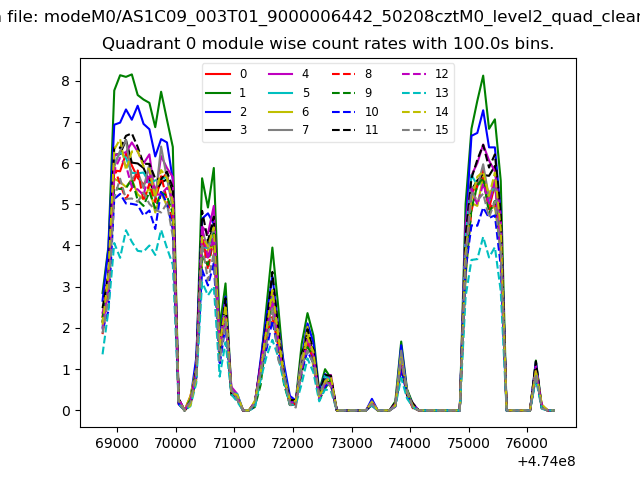 |
 |
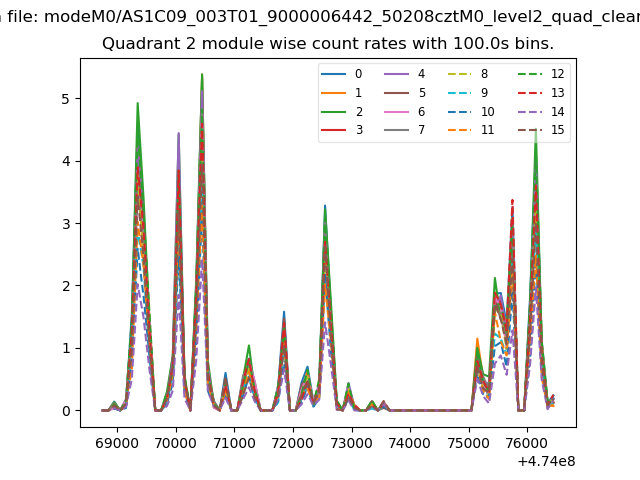
| Module-wise count rates for Quadrant B Data is divided into 100 sec bins |
 |
 |
| Module-wise count rates for Quadrant C Data is divided into 100 sec bins |
 |
 |
| Module-wise count rates for Quadrant D Data is divided into 100 sec bins |
 |
 |
| Parameter | Plot |
|---|---|
| CZT HV Monitor | 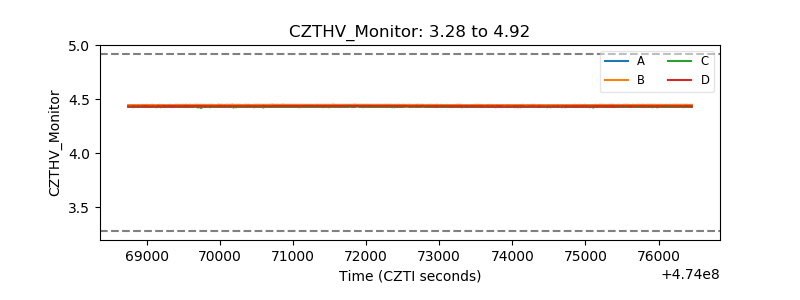 |
| D_VDD | 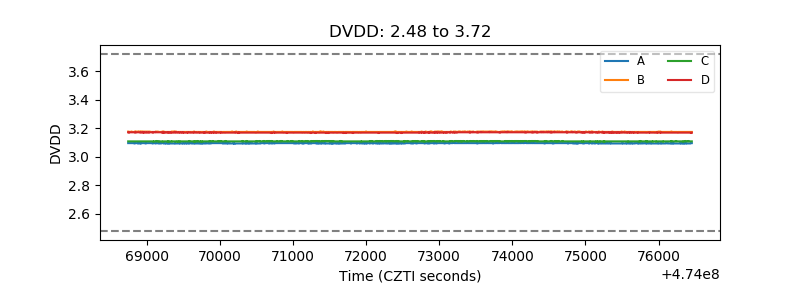 |
| Temperature 1 | 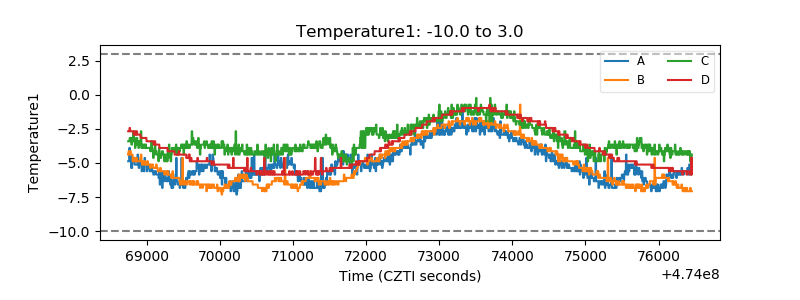 |
| Veto HV Monitor | 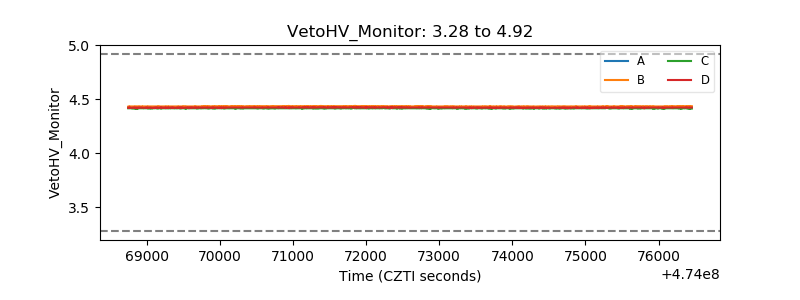 |
| Veto LLD | 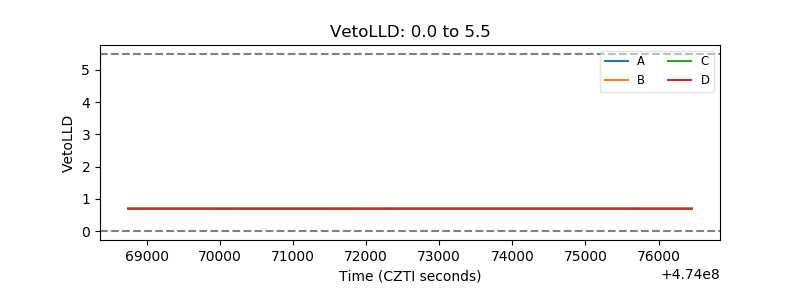 |
| Alpha Counter | 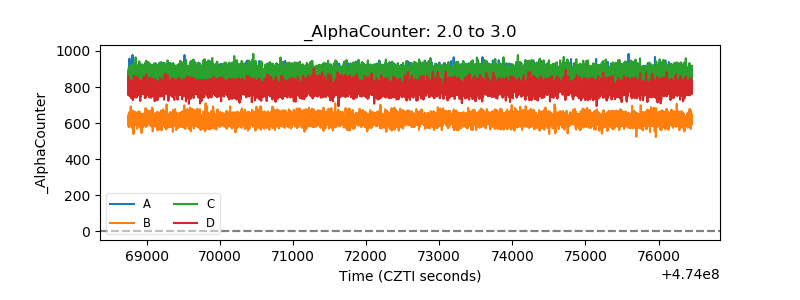 |
| _CPM_Rate | 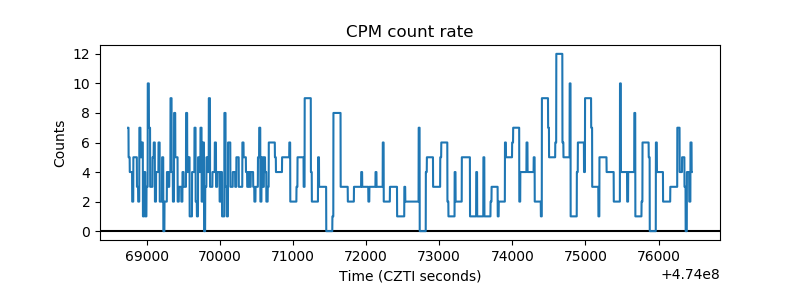 |
| CZT Counter | 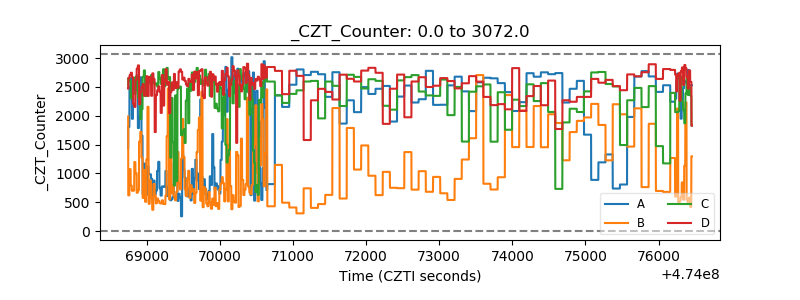 |
| +2.5 Volts monitor | 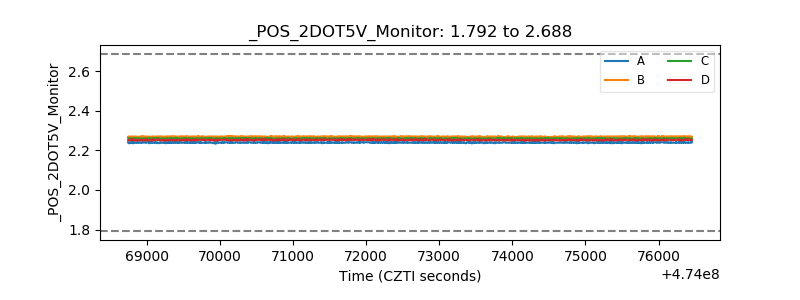 |
| +5 Volts monitor |  |
| _ROLL_ROT | 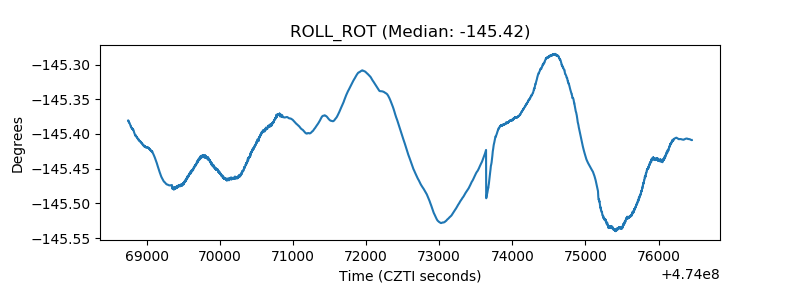 |
| _Roll_DEC | 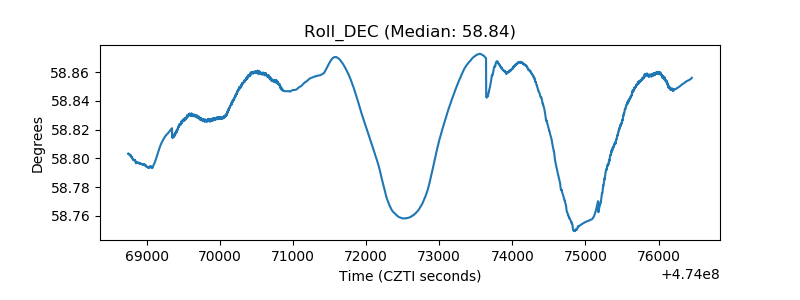 |
| _Roll_RA | 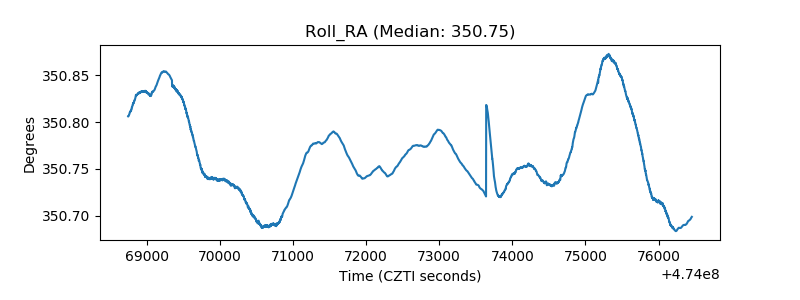 |
| Veto Counter | 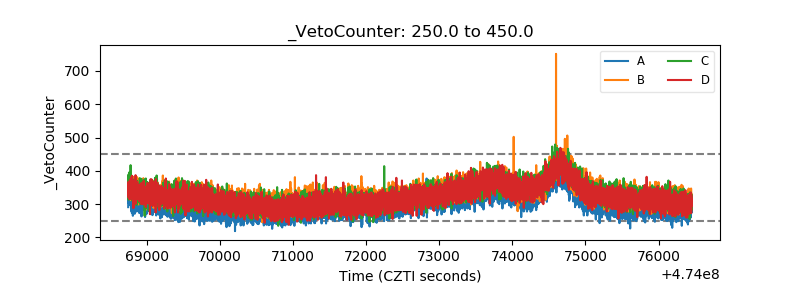 |