| Param | Original file | Final file |
|---|---|---|
| Filename | modeM0/AS1C09_003T01_9000006442_50211cztM0_level2.fits | modeM0/AS1C09_003T01_9000006442_50211cztM0_level2_quad_clean.evt |
| Size (bytes) | 3,813,220,800 | 146,027,520 |
| Size | 3.6 GB | 139.3 MB |
| Events in quadrant A | 35,847,670 | 772,488 |
| Events in quadrant B | 17,910,451 | 1,703,954 |
| Events in quadrant C | 41,564,886 | 401,567 |
| Events in quadrant D | 44,370,164 | 225,789 |
| Mode M9 | |||
|---|---|---|---|
| Quadrant | BADHDUFLAG | Total packets | Discarded packets |
| A | 0 | 7 | 0 |
| B | 0 | 7 | 0 |
| C | 0 | 7 | 0 |
| D | 0 | 7 | 0 |
| Mode M0 | |||
|---|---|---|---|
| Quadrant | BADHDUFLAG | Total packets | Discarded packets |
| A | 0 | 119652 | 3 |
| B | 0 | 66512 | 3 |
| C | 0 | 136419 | 3 |
| D | 0 | 144794 | 9 |
| Mode SS | |||
|---|---|---|---|
| Quadrant | BADHDUFLAG | Total packets | Discarded packets |
| A | 0 | 388 | 0 |
| B | 0 | 388 | 0 |
| C | 0 | 388 | 0 |
| D | 0 | 388 | 0 |
| Quadrant | Total seconds | Saturated seconds | Saturation percentage |
|---|---|---|---|
| A | 19087 | 11188 | 58.615812% |
| B | 19087 | 2254 | 11.809085% |
| C | 19087 | 14998 | 78.577042% |
| D | 19086 | 16644 | 87.205281% |
Noise dominated data is calculated using 1-second bins in cleaned event files. If a bin has >2000 counts, and if more than 50% of those come from <1% of pixels, then it is considered to be noise-dominated and hence unusable.
| Quadrant | # 1 sec bins | Bins with >0 counts | Bins with >2000 counts | High rate bins dominated by noise | Noise dominated (total time) | Noise dominated (detector-on time) | Marked lightcurve |
|---|---|---|---|---|---|---|---|
| A | 19852 | 19088 | 10233 | 10233 | 51.55% | 53.61% | 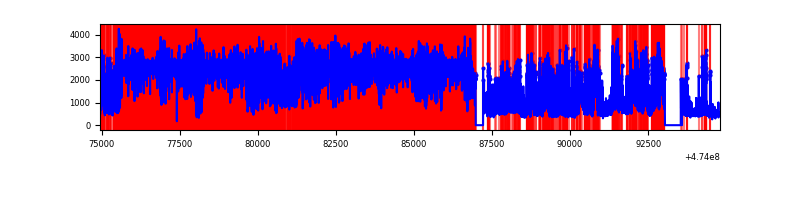 |
| B | 19852 | 19089 | 1474 | 1474 | 7.42% | 7.72% | 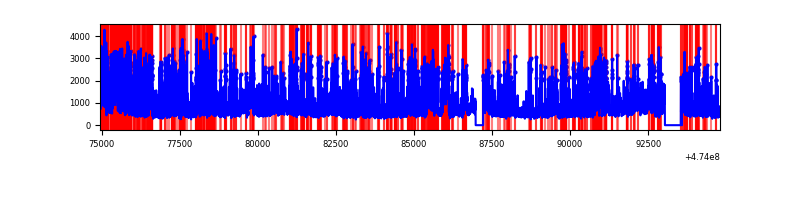 |
| C | 19852 | 19088 | 13699 | 13699 | 69.01% | 71.77% | 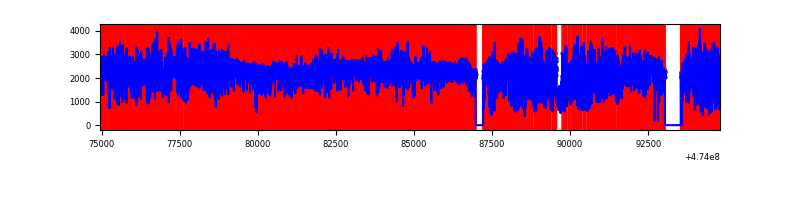 |
| D | 19851 | 19086 | 15638 | 15638 | 78.78% | 81.93% | 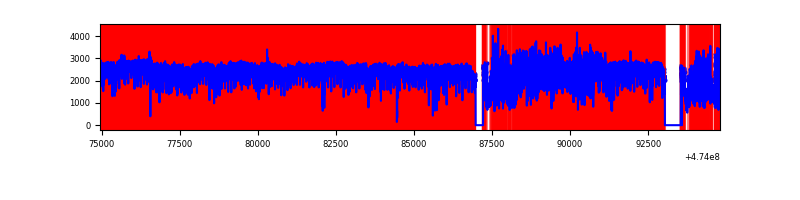 |
Top three noisy pixels from each quadrant. If the there are fewer than three noisy pixels in the level2.evt file, extra rows are filled as -1
| Pixel properties | Quadrant properties | ||||||
|---|---|---|---|---|---|---|---|
| Quadrant | DetID | PixID | Counts | Sigma | Mean | Median | Sigma |
| A | 0 | 98 | 19269037 | 49192.48 | 1506 | 1460 | 391.7 |
| A | 4 | 76 | 3379944 | 8625.68 | 1506 | 1460 | 391.7 |
| A | 8 | 249 | 1581182 | 4033.22 | 1506 | 1460 | 391.7 |
| B | 4 | 206 | 6508886 | 16077.6 | 1931 | 1867 | 404.7 |
| B | 3 | 249 | 889714 | 2193.7 | 1931 | 1867 | 404.7 |
| B | 10 | 128 | 849808 | 2095.1 | 1931 | 1867 | 404.7 |
| C | 4 | 111 | 13943266 | 45636.36 | 1025 | 1012 | 305.5 |
| C | 15 | 197 | 13508064 | 44211.84 | 1025 | 1012 | 305.5 |
| C | 13 | 250 | 2451600 | 8021.37 | 1025 | 1012 | 305.5 |
| D | 7 | 61 | 19550548 | 70548.74 | 822 | 780 | 277.1 |
| D | 15 | 108 | 5707562 | 20593.91 | 822 | 780 | 277.1 |
| D | 15 | 168 | 4059931 | 14648.15 | 822 | 780 | 277.1 |
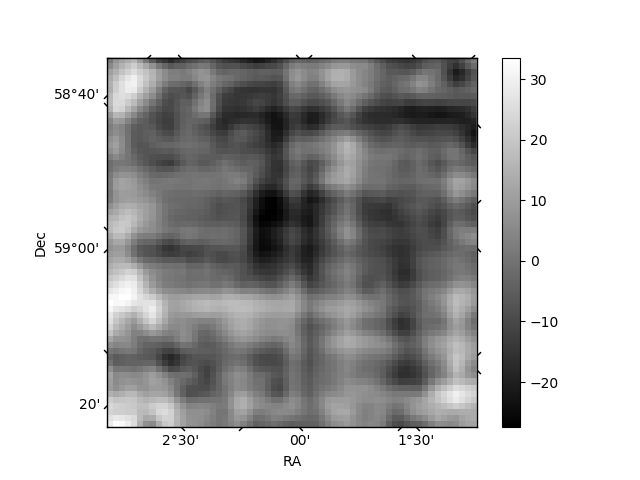
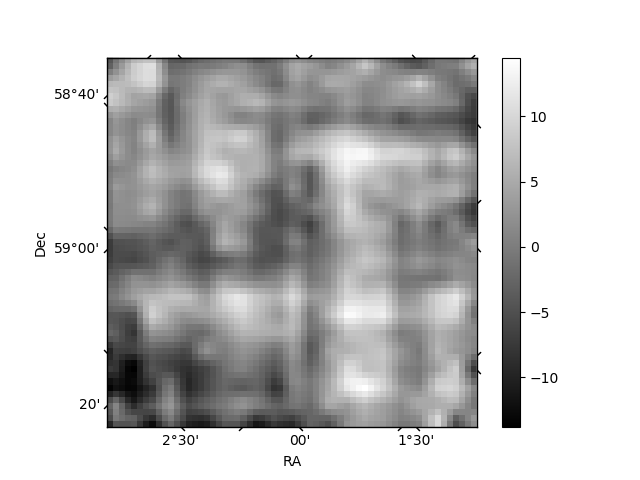
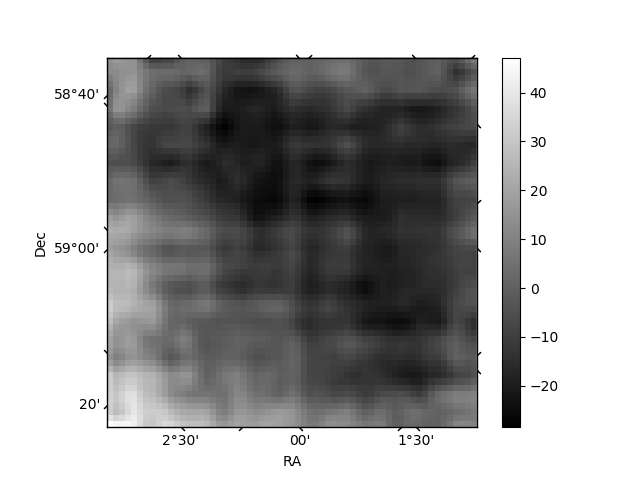
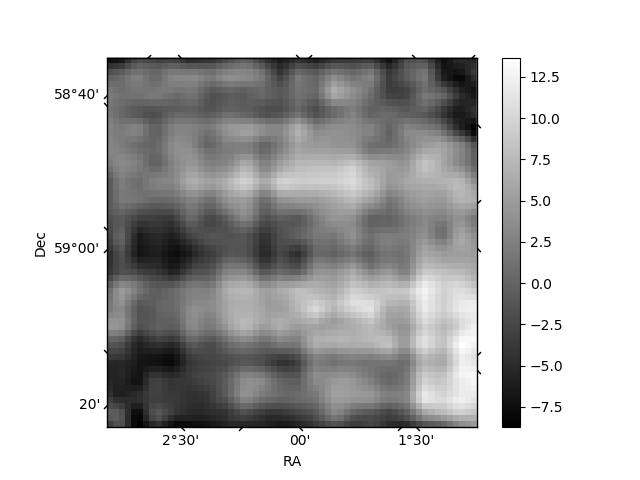
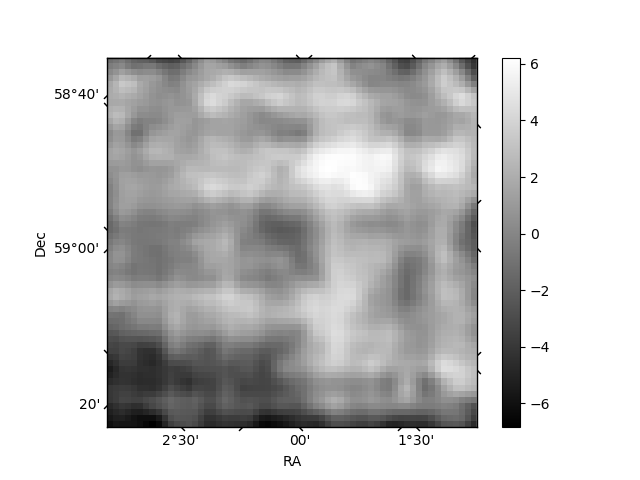
Histogram calculated using DETX and DETY for each event in the final _common_clean file
| Quadrant A | 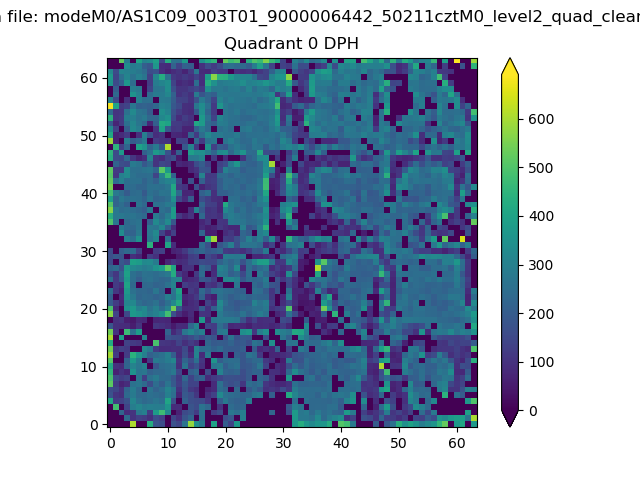 |
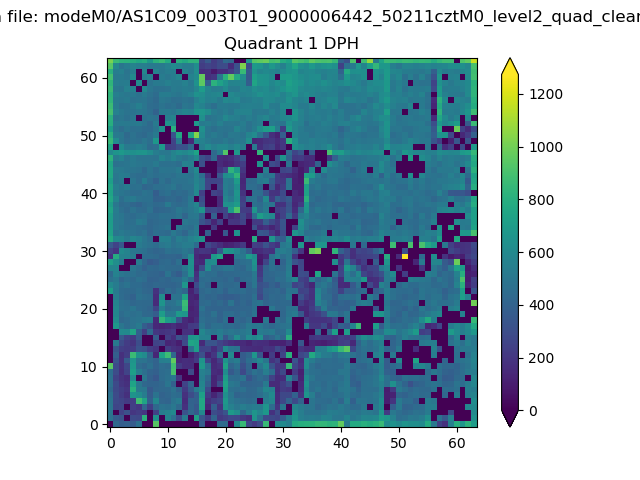 |
Quadrant B |
|---|---|---|---|
| Quadrant D | 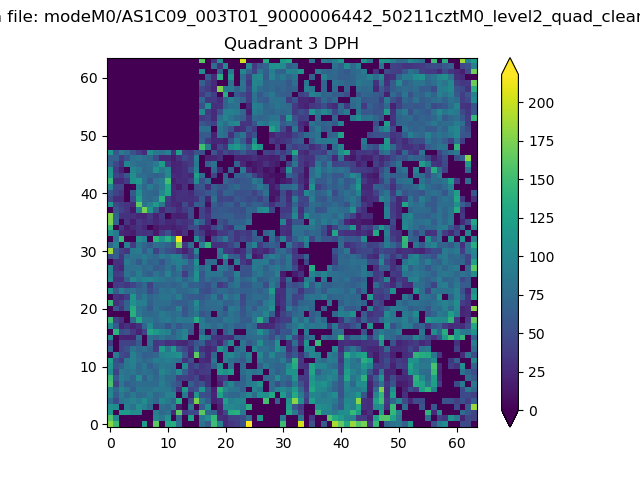 |
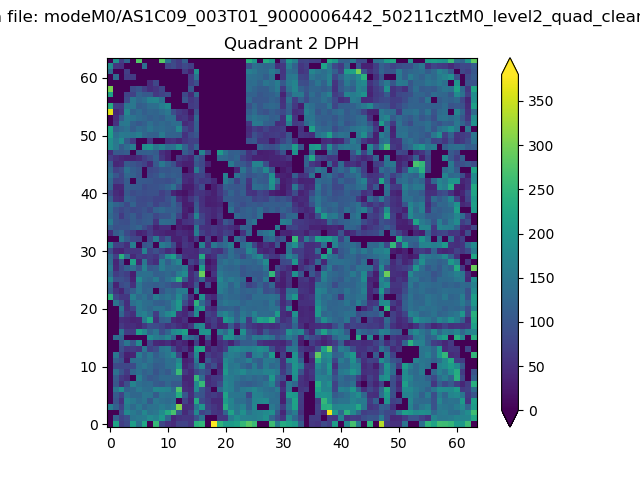 |
Quadrant C |
| Plot type | Count rate plots | Images |
|---|---|---|
| Comparison with Poisson distribution Blue bars denote a histogram of data divided into 1 sec bins. Red curve is a Poisson curve with rate = median count rate of data. |
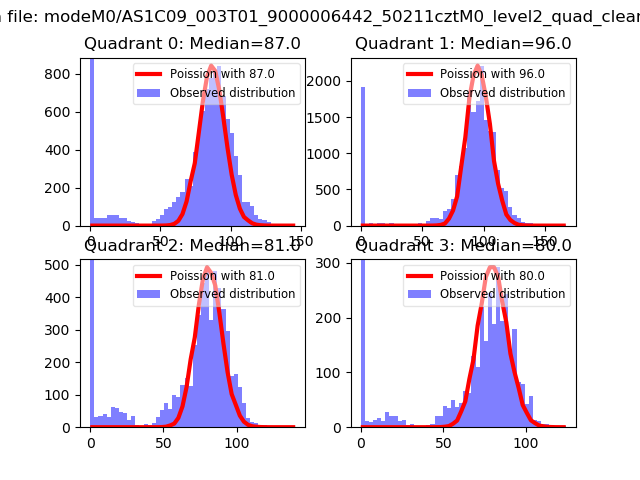 |
 |
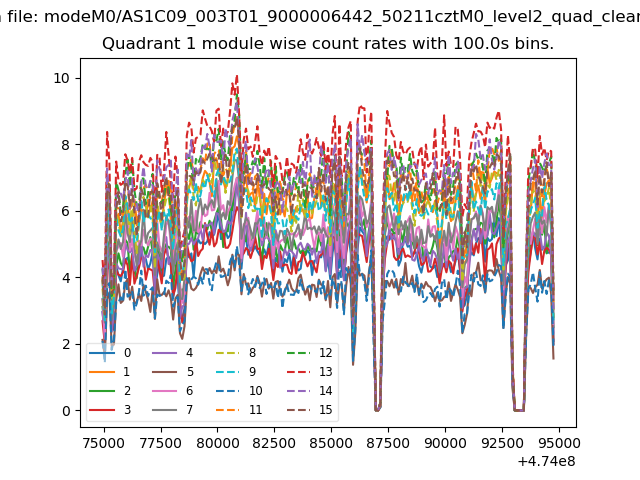
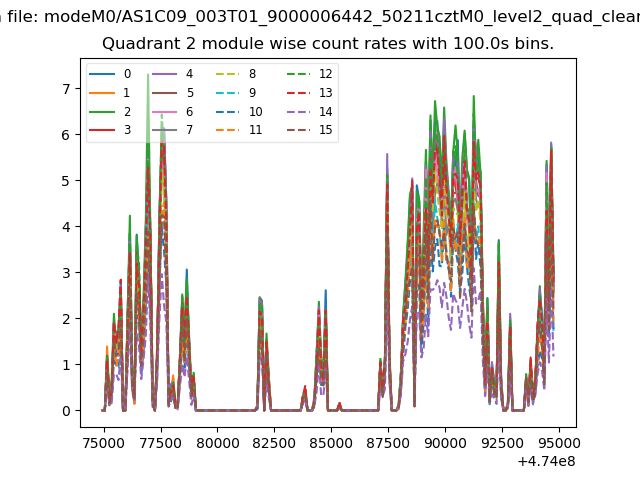
| Quadrant-wise count rates Data is divided into 100 sec bins |
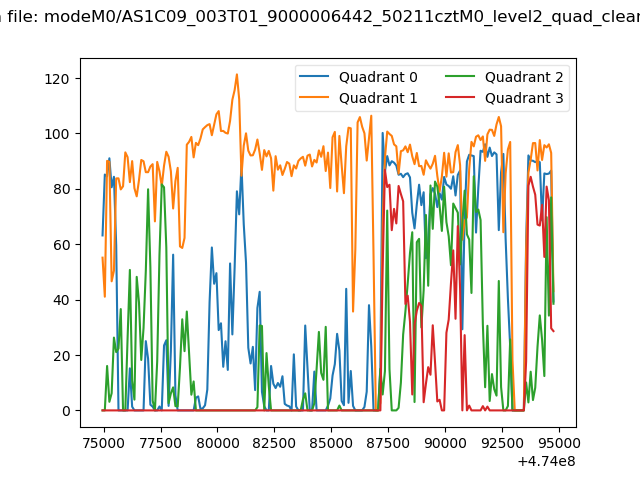 |
|
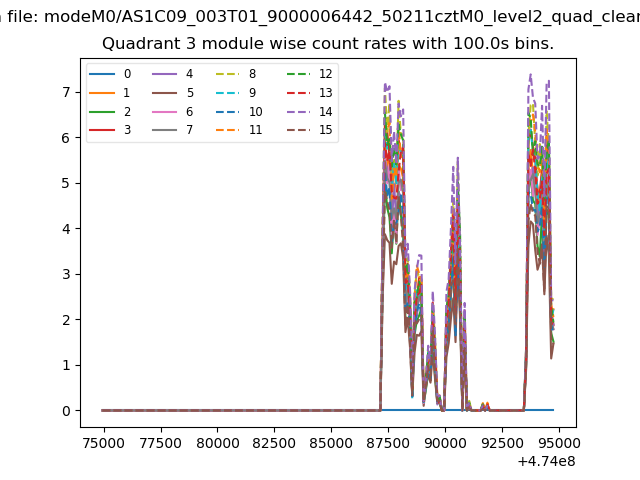
| Module-wise count rates for Quadrant A Data is divided into 100 sec bins |
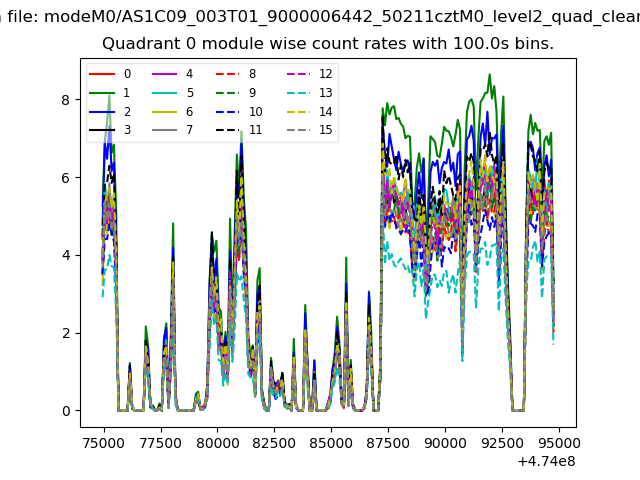 |
 |
| Module-wise count rates for Quadrant B Data is divided into 100 sec bins |
 |
 |
| Module-wise count rates for Quadrant C Data is divided into 100 sec bins |
 |
 |
| Module-wise count rates for Quadrant D Data is divided into 100 sec bins |
 |
 |
| Parameter | Plot |
|---|---|
| CZT HV Monitor | 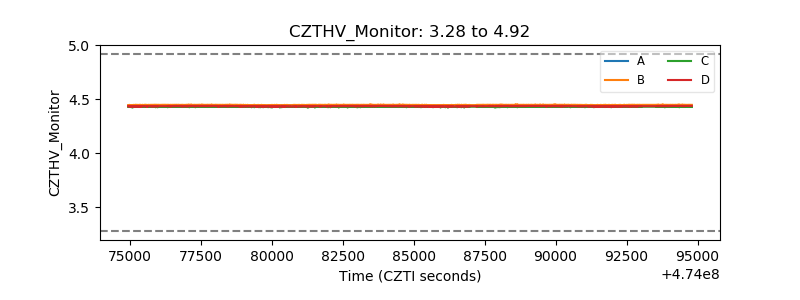 |
| D_VDD | 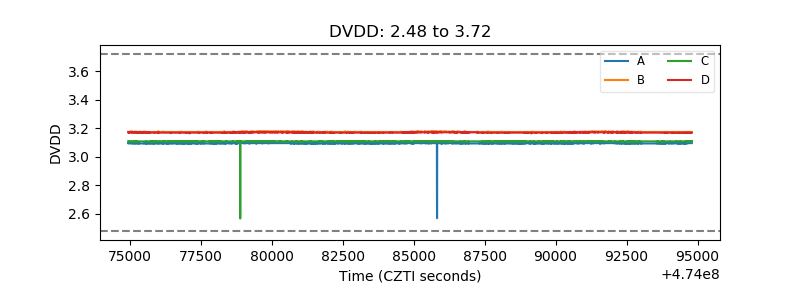 |
| Temperature 1 | 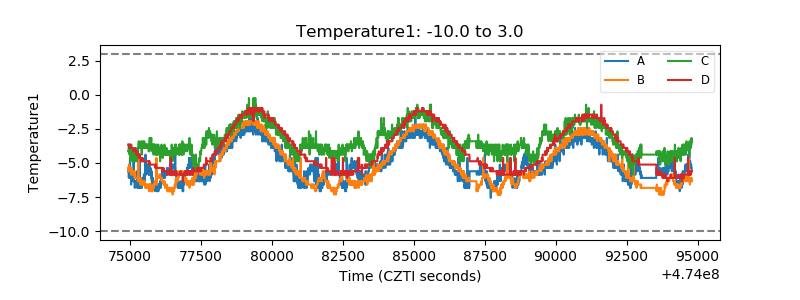 |
| Veto HV Monitor | 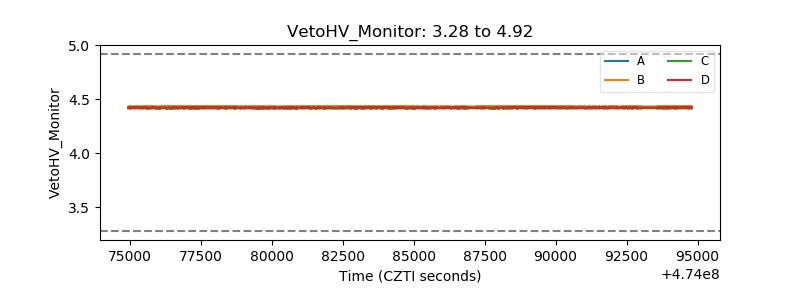 |
| Veto LLD | 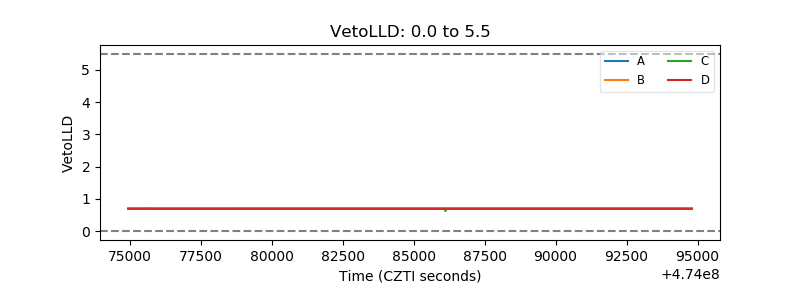 |
| Alpha Counter | 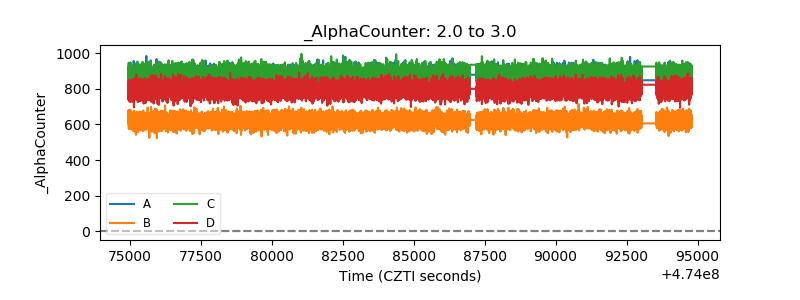 |
| _CPM_Rate | 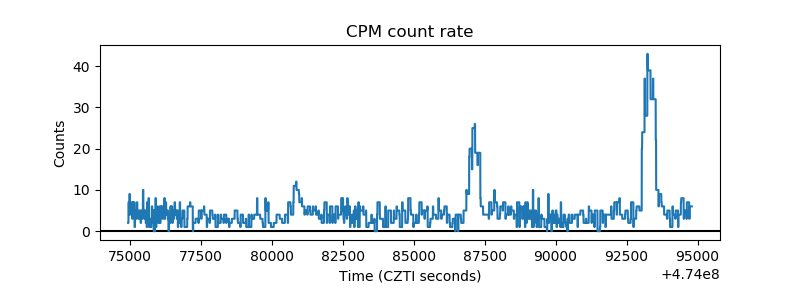 |
| CZT Counter | 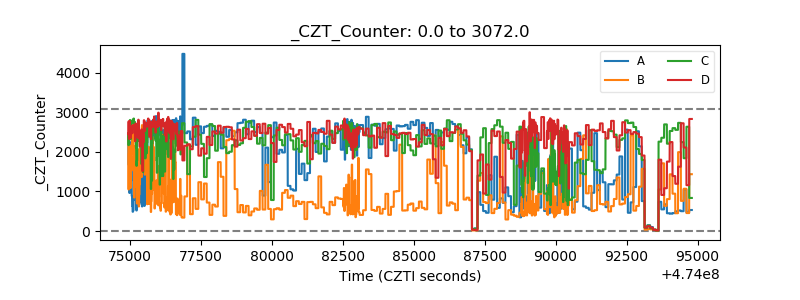 |
| +2.5 Volts monitor | 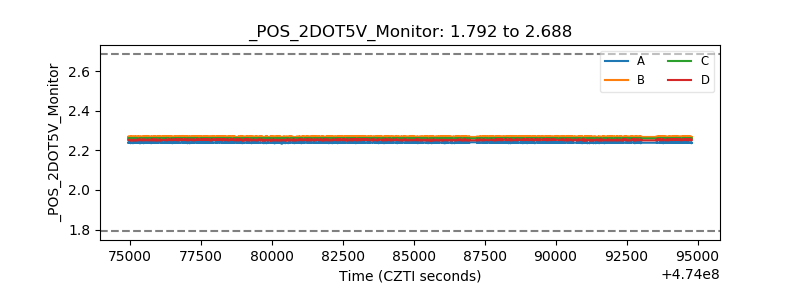 |
| +5 Volts monitor |  |
| _ROLL_ROT | 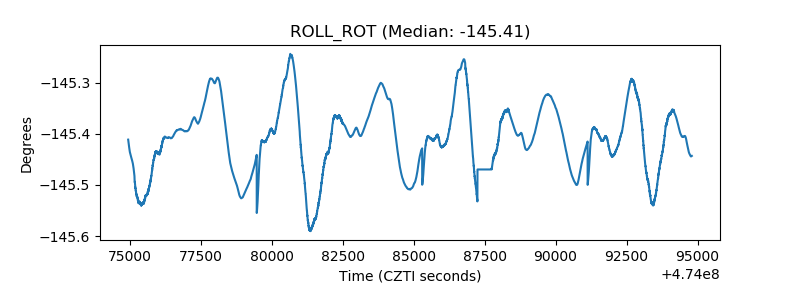 |
| _Roll_DEC | 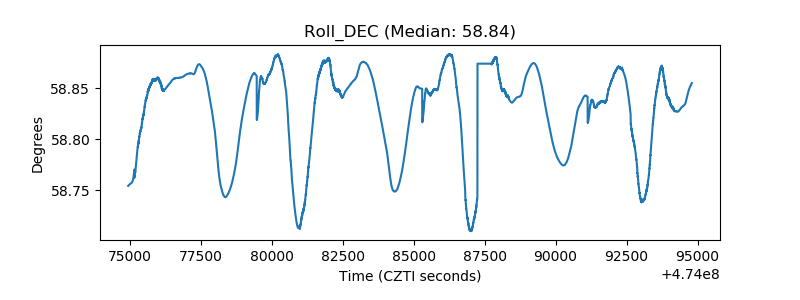 |
| _Roll_RA | 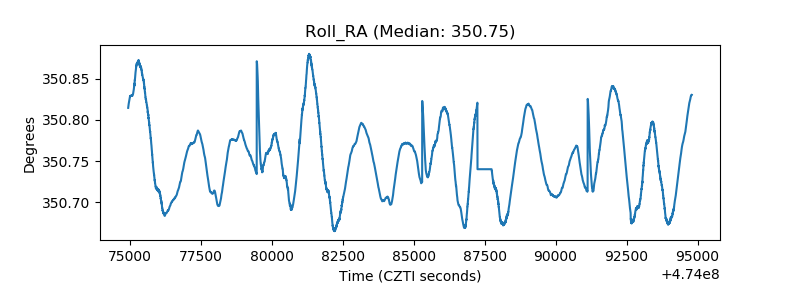 |
| Veto Counter | 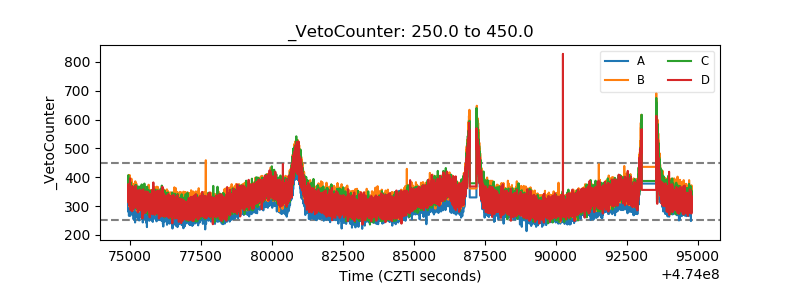 |