| Param | Original file | Final file |
|---|---|---|
| Filename | modeM0/AS1C09_003T01_9000006442_50212cztM0_level2.fits | modeM0/AS1C09_003T01_9000006442_50212cztM0_level2_quad_clean.evt |
| Size (bytes) | 1,015,194,240 | 70,473,600 |
| Size | 968.2 MB | 67.2 MB |
| Events in quadrant A | 6,623,192 | 533,881 |
| Events in quadrant B | 5,407,780 | 586,633 |
| Events in quadrant C | 11,351,502 | 325,050 |
| Events in quadrant D | 13,697,532 | 235,963 |
| Mode M9 | |||
|---|---|---|---|
| Quadrant | BADHDUFLAG | Total packets | Discarded packets |
| A | 0 | 8 | 0 |
| B | 0 | 8 | 0 |
| C | 0 | 8 | 0 |
| D | 0 | 8 | 0 |
| Mode M0 | |||
|---|---|---|---|
| Quadrant | BADHDUFLAG | Total packets | Discarded packets |
| A | 0 | 24117 | 1 |
| B | 0 | 20601 | 1 |
| C | 0 | 38245 | 1 |
| D | 0 | 45140 | 1 |
| Mode SS | |||
|---|---|---|---|
| Quadrant | BADHDUFLAG | Total packets | Discarded packets |
| A | 0 | 130 | 0 |
| B | 0 | 130 | 0 |
| C | 0 | 130 | 0 |
| D | 0 | 130 | 0 |
| Quadrant | Total seconds | Saturated seconds | Saturation percentage |
|---|---|---|---|
| A | 6481 | 838 | 12.930103% |
| B | 6482 | 679 | 10.475162% |
| C | 6482 | 3039 | 46.883678% |
| D | 6482 | 3899 | 60.151188% |
Noise dominated data is calculated using 1-second bins in cleaned event files. If a bin has >2000 counts, and if more than 50% of those come from <1% of pixels, then it is considered to be noise-dominated and hence unusable.
| Quadrant | # 1 sec bins | Bins with >0 counts | Bins with >2000 counts | High rate bins dominated by noise | Noise dominated (total time) | Noise dominated (detector-on time) | Marked lightcurve |
|---|---|---|---|---|---|---|---|
| A | 7221 | 6481 | 783 | 783 | 10.84% | 12.08% | 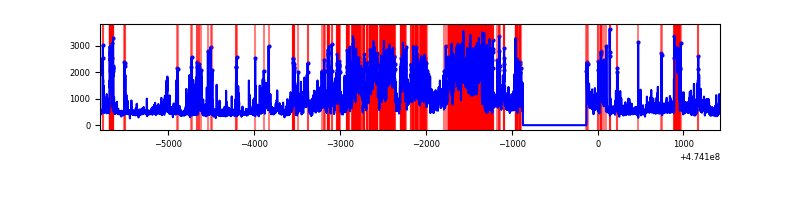 |
| B | 7222 | 6482 | 447 | 447 | 6.19% | 6.90% | 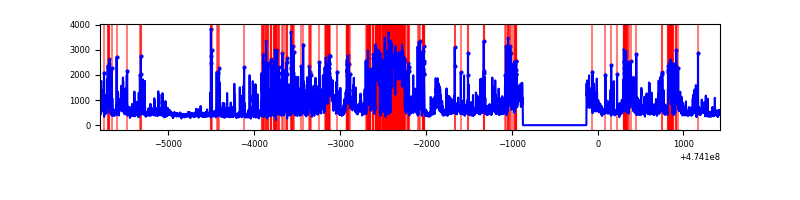 |
| C | 7221 | 6481 | 2683 | 2683 | 37.16% | 41.40% | 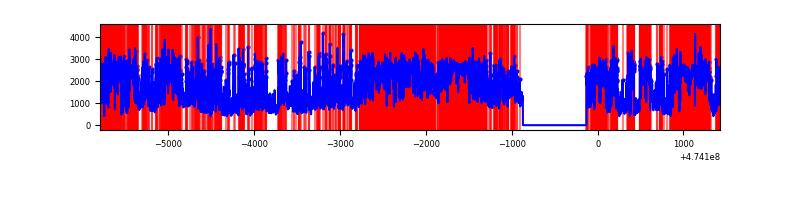 |
| D | 7222 | 6482 | 3950 | 3950 | 54.69% | 60.94% | 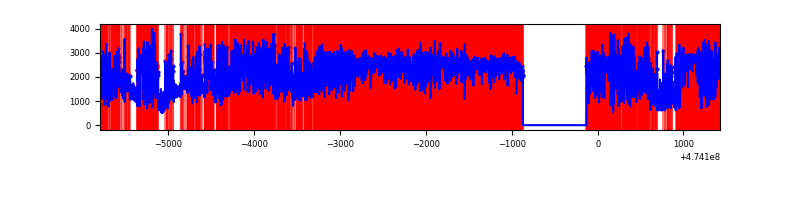 |
Top three noisy pixels from each quadrant. If the there are fewer than three noisy pixels in the level2.evt file, extra rows are filled as -1
| Pixel properties | Quadrant properties | ||||||
|---|---|---|---|---|---|---|---|
| Quadrant | DetID | PixID | Counts | Sigma | Mean | Median | Sigma |
| A | 0 | 98 | 2158642 | 13323.36 | 651 | 634 | 162.0 |
| A | 10 | 253 | 326957 | 2014.69 | 651 | 634 | 162.0 |
| A | 12 | 250 | 298588 | 1839.54 | 651 | 634 | 162.0 |
| B | 4 | 206 | 1864524 | 13467.42 | 648 | 627 | 138.4 |
| B | 6 | 203 | 208464 | 1501.71 | 648 | 627 | 138.4 |
| B | 3 | 249 | 135008 | 970.96 | 648 | 627 | 138.4 |
| C | 4 | 111 | 3420509 | 22682.95 | 505 | 499 | 150.8 |
| C | 15 | 197 | 2578945 | 17101.34 | 505 | 499 | 150.8 |
| C | 15 | 213 | 797251 | 5284.39 | 505 | 499 | 150.8 |
| D | 15 | 108 | 3311727 | 23254.84 | 489 | 474 | 142.4 |
| D | 7 | 61 | 3035498 | 21314.89 | 489 | 474 | 142.4 |
| D | 11 | 245 | 2030537 | 14257.08 | 489 | 474 | 142.4 |
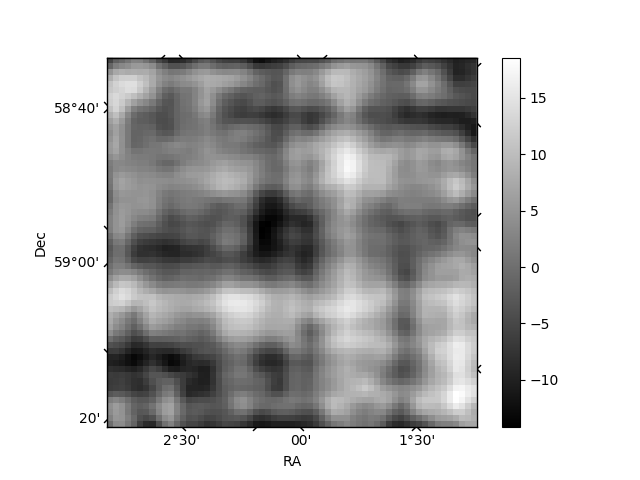
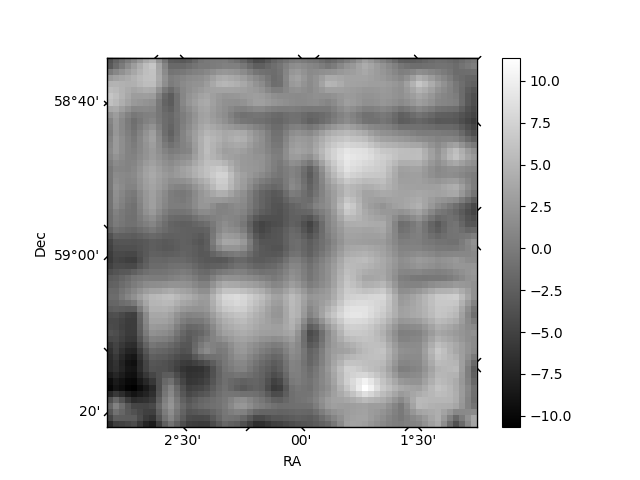
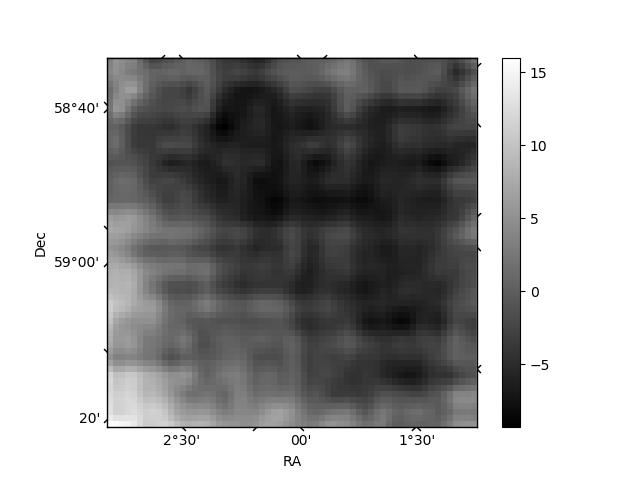
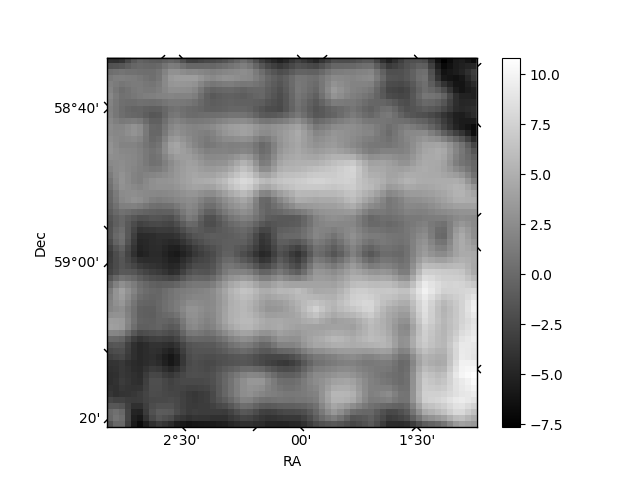
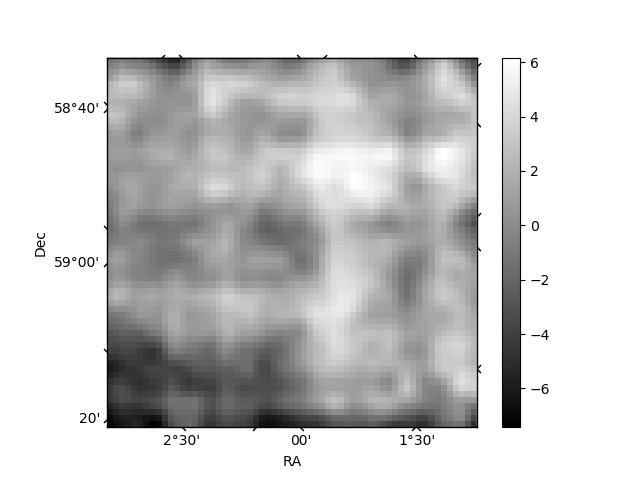
Histogram calculated using DETX and DETY for each event in the final _common_clean file
| Quadrant A | 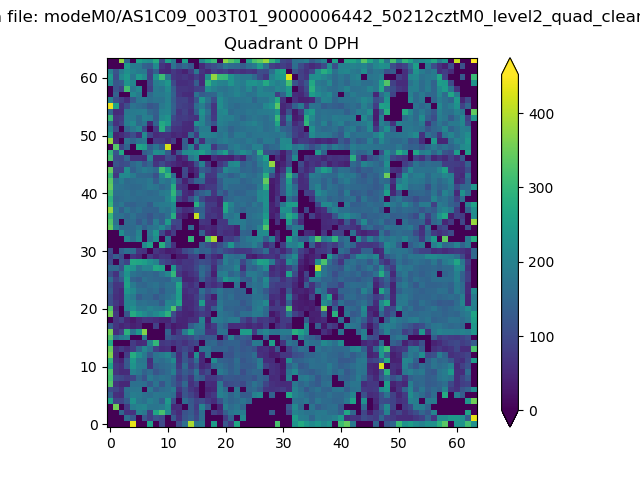 |
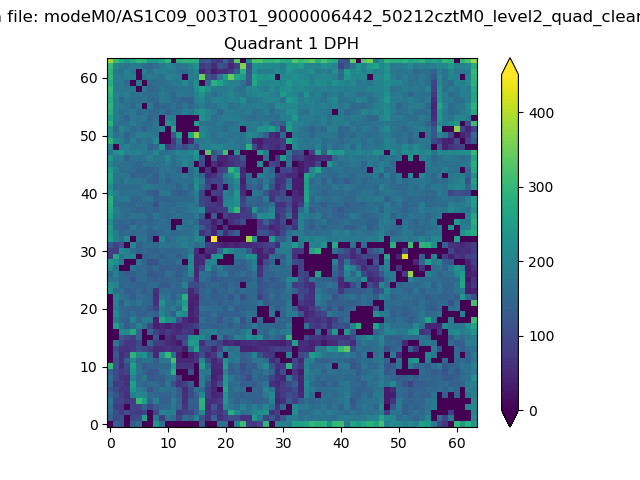 |
Quadrant B |
|---|---|---|---|
| Quadrant D | 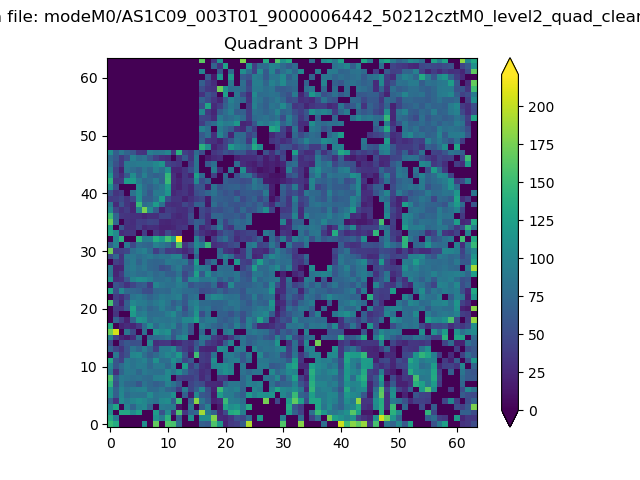 |
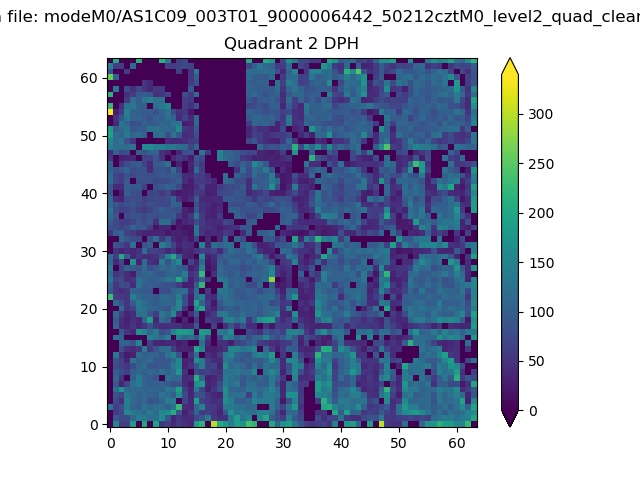 |
Quadrant C |
| Plot type | Count rate plots | Images |
|---|---|---|
| Comparison with Poisson distribution Blue bars denote a histogram of data divided into 1 sec bins. Red curve is a Poisson curve with rate = median count rate of data. |
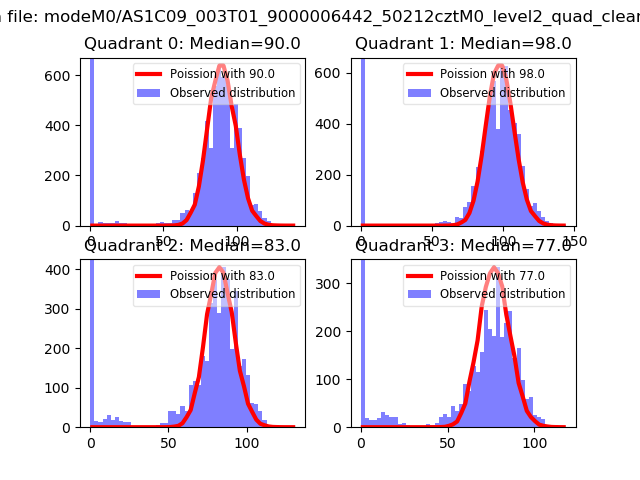 |
 |
| Quadrant-wise count rates Data is divided into 100 sec bins |
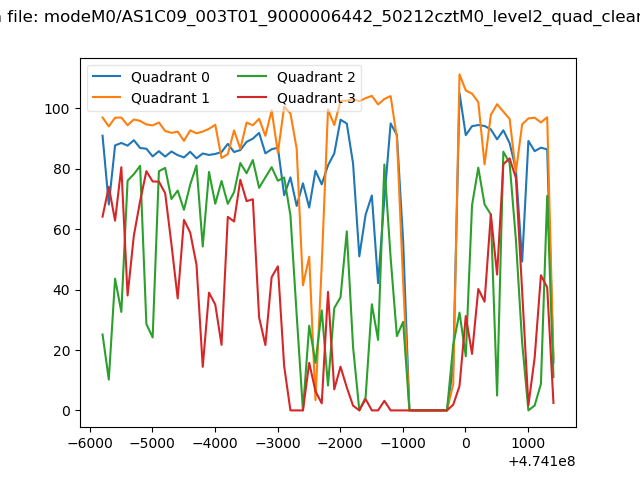 |
|
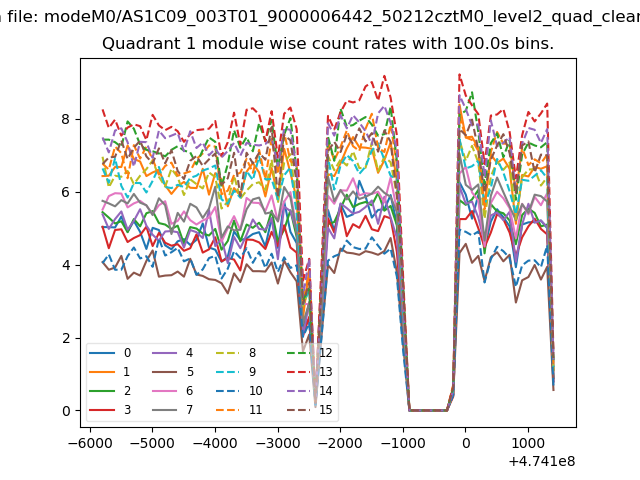
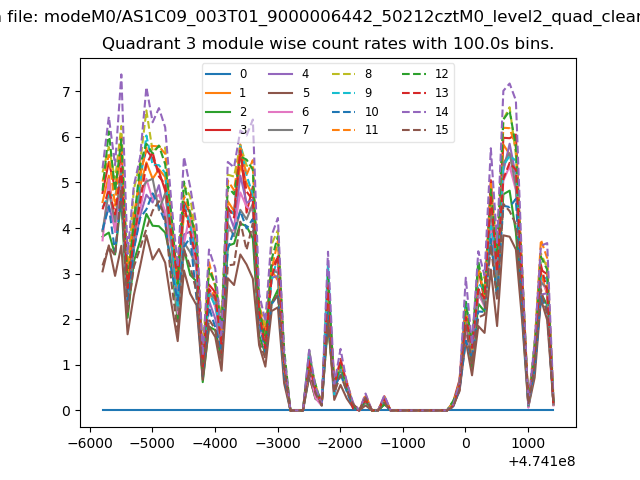
| Module-wise count rates for Quadrant A Data is divided into 100 sec bins |
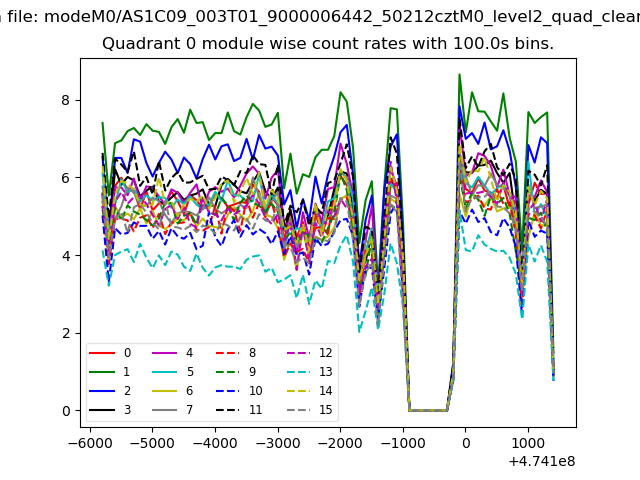 |
 |
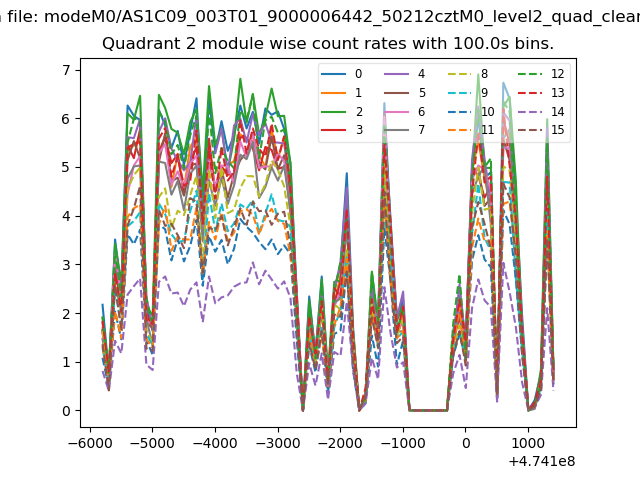
| Module-wise count rates for Quadrant B Data is divided into 100 sec bins |
 |
 |
| Module-wise count rates for Quadrant C Data is divided into 100 sec bins |
 |
 |
| Module-wise count rates for Quadrant D Data is divided into 100 sec bins |
 |
 |
| Parameter | Plot |
|---|---|
| CZT HV Monitor | 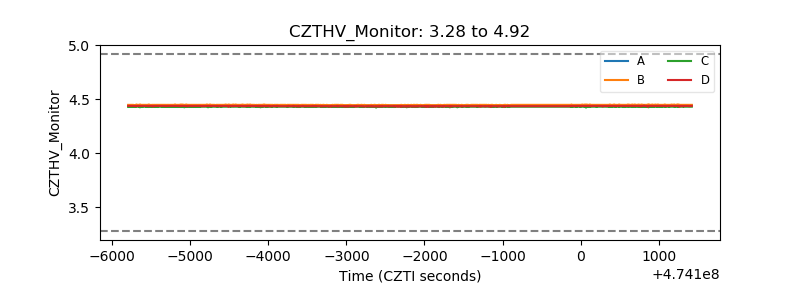 |
| D_VDD | 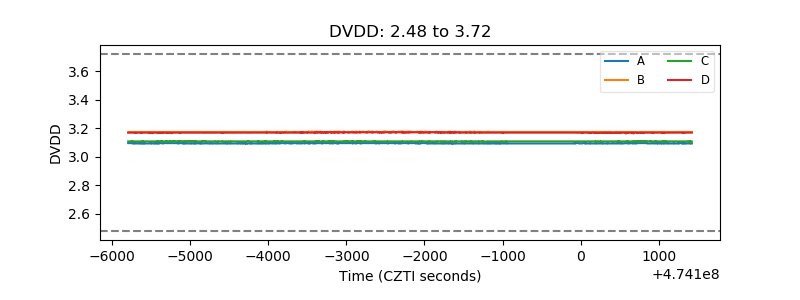 |
| Temperature 1 | 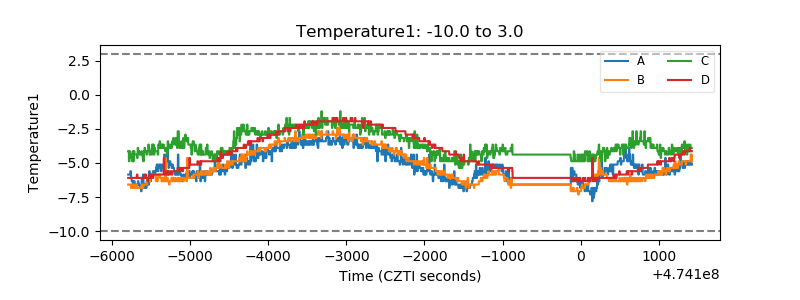 |
| Veto HV Monitor | 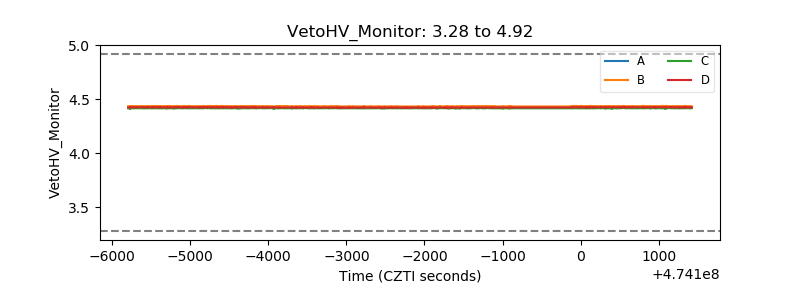 |
| Veto LLD | 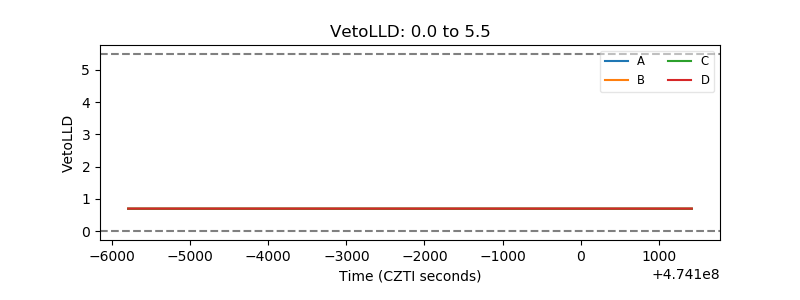 |
| Alpha Counter | 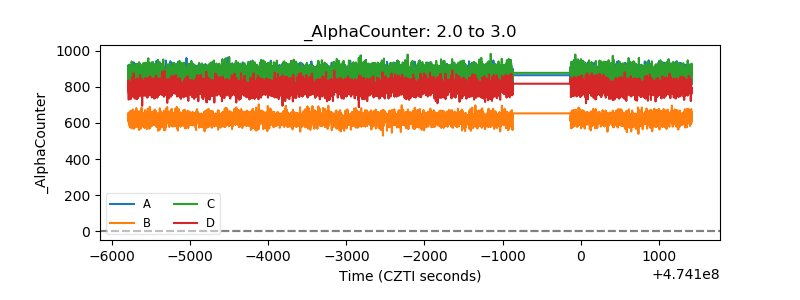 |
| _CPM_Rate | 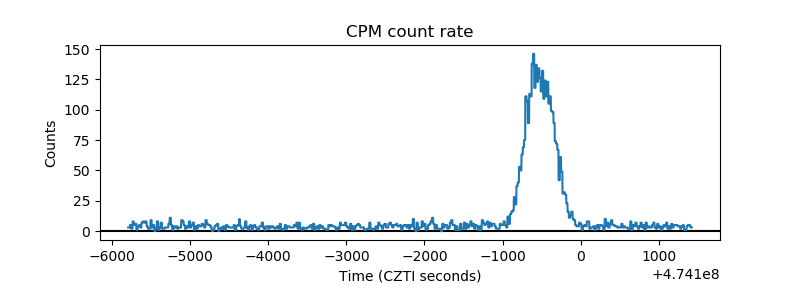 |
| CZT Counter | 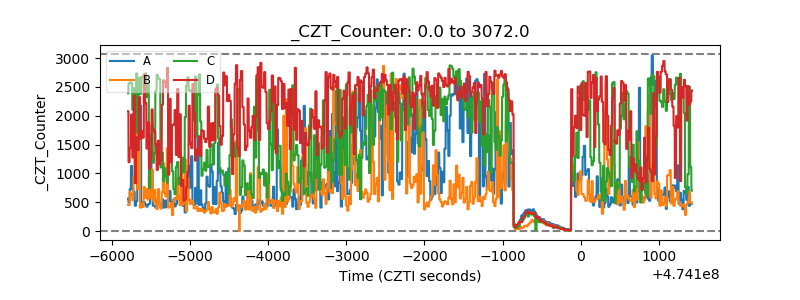 |
| +2.5 Volts monitor | 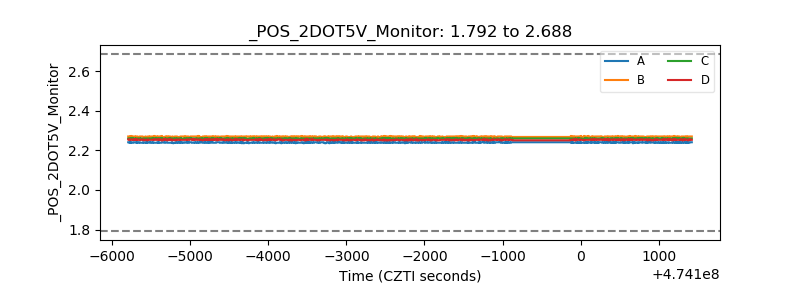 |
| +5 Volts monitor |  |
| _ROLL_ROT | 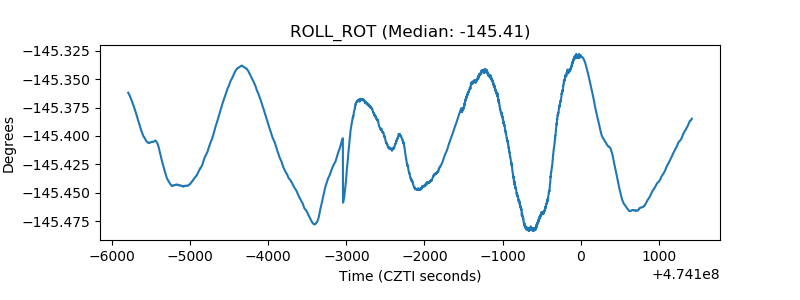 |
| _Roll_DEC | 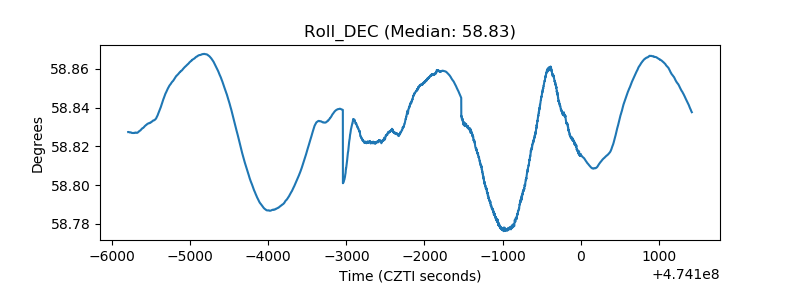 |
| _Roll_RA | 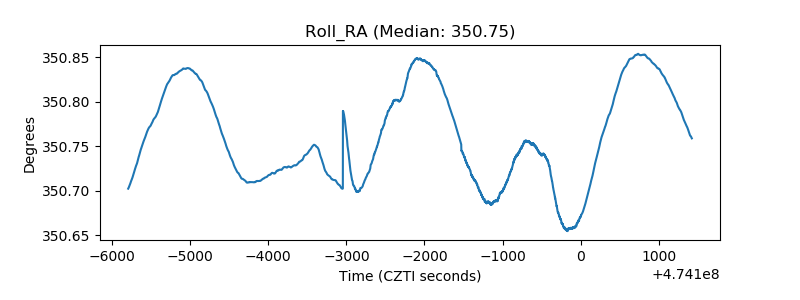 |
| Veto Counter | 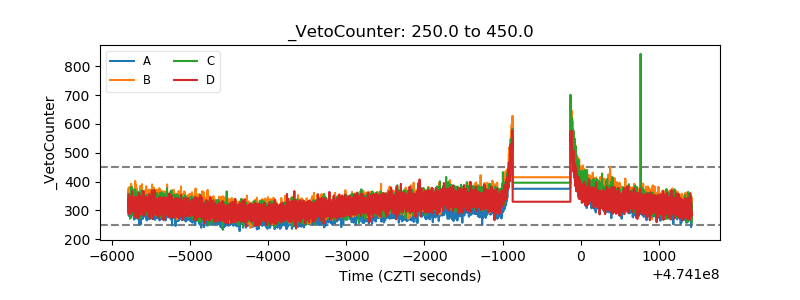 |